HAL Id: hal-01793521
https://hal.inria.fr/hal-01793521
Submitted on 16 May 2018
HAL is a multi-disciplinary open access
archive for the deposit and dissemination of
sci-entific research documents, whether they are
pub-lished or not. The documents may come from
teaching and research institutions in France or
abroad, or from public or private research centers.
L’archive ouverte pluridisciplinaire HAL, est
destinée au dépôt et à la diffusion de documents
scientifiques de niveau recherche, publiés ou non,
émanant des établissements d’enseignement et de
recherche français ou étrangers, des laboratoires
publics ou privés.
SeDuCe: Toward a testbed for research on thermal and
power management in datacenters
Jonathan Pastor, Jean-Marc Menaud
To cite this version:
Jonathan Pastor, Jean-Marc Menaud. SeDuCe: Toward a testbed for research on thermal and power
management in datacenters. E2DC 2018 - 7th International Workshop on Energy-Efficient Data
Centres, Jun 2018, Karlsruhe, Germany. pp.513-518, �10.1145/3208903.3213523�. �hal-01793521�
e-Energy ’18, June 12–15, 2018, Karlsruhe, Germany Jonathan pastor and Jean Marc Menaud
SeDuCe: Toward a testbed for research on thermal and power
management in datacenters
Jonathan pastor
IMT Atlantique - Nantes [email protected]
Jean Marc Menaud
IMT Atlantique - Nantes [email protected]
ABSTRACT
With the advent of Cloud Computing, the size of datacenters is ever increasing and the management of servers and their power con-sumption and heat production have become challenges. The man-agement of the heat produced by servers has been experimentally less explored than the management of their power consumption. It can be partly explained by the lack of a public testbed that provides reliable access to both thermal and power metrics of server rooms. In this paper we propose SeDuCe, a testbed that targets research on power and thermal management of servers, by providing public ac-cess to precise data about the power consumption and the thermal dissipation of 48 servers integrated in Grid’5000 as the new ecotype cluster. We present the chosen software and hardware architecture for the first version of the SeDuCe testbed, highlighting its current limitation and proposing some improvements that will increase its relevance.
ACM Reference format:
Jonathan pastor and Jean Marc Menaud. 2018. SeDuCe: Toward a testbed for research on thermal and power management in datacenters. In Proceedings of e-Energy ’18: International Conference on Future Energy Systems, Karlsruhe,
Germany, June 12–15, 2018 (e-Energy ’18),7 pages.
https://doi.org/10.1145/3208903.3213523
1 INTRODUCTION
The advent of web sites with a global audience and the democratiza-tion of Cloud Computing have led to the construcdemocratiza-tion of datacenters all over the world. Datacenters are facilities that concentrate from a few servers up to hundreds of thousands of servers hosted in rooms specially designed to provide energy and cooling for the servers. These facilities are widely used for applications such as the hosting of web services or High Perfomance Computing.
In recent years, the size of datacenters is ever increasing, which leads to new challenges such as designing fault tolerant software to manage at large scale the servers and energy management of server rooms. On the latter challenge, many research efforts have been conducted [5] [4], most of them focusing on the implementation of on demand power management systems, such as DVFS [9] [10] and VOVO [7] [2]. Some work has been made to extend existing scien-tific testbeds with power monitoring of experiments : for example Publication rights licensed to ACM. ACM acknowledges that this contribution was authored or co-authored by an employee, contractor or affiliate of a national govern-ment. As such, the Government retains a nonexclusive, royalty-free right to publish or reproduce this article, or to allow others to do so, for Government purposes only. e-Energy ’18, June 12–15, 2018, Karlsruhe, Germany
© 2018 Copyright held by the owner/author(s). Publication rights licensed to Associa-tion for Computing Machinery.
ACM ISBN 978-1-4503-5767-8/18/06...$15.00 https://doi.org/10.1145/3208903.3213523
Kwapi [3] enables researchers to track the power consumption of their experiments conducted on Grid’5000.
On the other hand, the thermal management of servers has been less explored, a large part of the existing work considering only simulations [8]. This can be explained, partly, by the difficulty of conducting experiments involving thermal monitoring of servers : to ensure that data recorded experimentally is valid, experimentions must be conducted on a testbed that contains many temperature sensors, not only positionned on cooling systems, but also at the front and the back of each server of racks.
In addition, such a testbed must enable reproducible experimen-tations, by providing its users with a full control on experimental conditions of their experiments and by exposing its data in a non misleading way, via a well documented API (Application Program-ming Interface).
Finally, as power management and temperature management of servers are related problems [6], there is a need for a testbed that enables users to access to both thermal and power data of servers. As far as we know, there is no public testbed that enables re-searchers to work on both power and thermal aspects of servers functionning. The objective of the SeDuCe project is to propose such a testbed : SeDuCe testbed enables its users to use, in the context of the ecotype cluster integrated in the Grid’5000 infras-tructure [1], 48 servers located in 5 airtight racks with a dedicated central cooling system (CCS) positioned inside one of the rack. In parallel of conducting the experiment by leveraging the tools pro-vided by Grid’5000, users can get access to thermal and power data of the testbed via a web portal and a user-friendly API. Stability of experimental conditions is guaranteed by hosting the testbed in a dedicated room equipped with a secondary cooling system (SCS) that enables a precise thermo-regulation of the environment outside the cluster. As resources of the testbed are made publicly available via the Grid’5000 infrastructure, all its users will be able to perform reproducible research on thermal and power management of servers.
2 TESTBED DESIGN
2.1 Ecotype : a Grid’5000 cluster dedicated to
the study of power and thermal
management of servers
We have built the ecotype cluster, which is composed of 48 servers and has been designed for research related to power and thermal management in datacenters. The ecotype cluster is integrated in the Grid’5000 infrastructure and is made available to any of its users : they can reserve servers of the ecotype cluster and conduct experi-ments on them by using the usual Grid’5000 tools. Meanwhile they can access in real time to information regarding the temperature
of the servers involved in their experiments, and get the power consumption of any parts of the testbed (servers, switches, cooling systems, ...).
Each server of the ecotype cluster is a DELL PowerEdge R630 that contains a pair of Intel Xeon E5-2630L v4 CPUs (10 cores, 20 threads per CPU), 128GB of RAM, and 400GB SSD. The CPUs have been designed to have a power consumption that is lower than other CPUs of the XEON 26XX serie, with a thermal design power (TDP) of 55W. Each server is connected via two 10GBe links to the Grid’5000 production network, and via a single 1GBe link to the Grid’5000 management network. Additionally, each server is certified to work in environments where temperature can be up to 35°C.
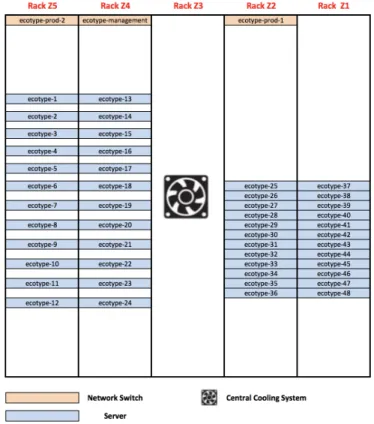
The cluster is composed of 5 Racks (Z1, Z2, Z3, Z4, Z5) and, as shown on Figure 1, one rack (Z4) is in charge of cooling the cooling the cluster by hosting a dedicated central cooling system (CCS), while remaining racks are computing racks and are dedicated to hosting servers.
As depicted by Figure 1, computing racks host 12 servers, follow-ing two layouts of server positions : one layout where servers are organised in a concentrated way with no vertical space between servers (Z1 and Z2), and a second layout where servers are spaced at 1U intervals (Z4 and Z5).
We have deliberately chosen to use these two layouts : they will enable to study the impact of a layout on the temperature and the power consumption of servers.
In addition to servers, the cluster contains three network switches that are in charge of connecting servers to production and manage-ment networks of the Grid’5000 testbed. Three racks (Z2, Z4, Z5) are hosting each a network switch.
The cluster has also been designed to leverage “Schneider Elec-tric IN-ROW” racks that create an inside airtight environment for servers, and guarantee that the environment outside the cluster has a limited impact on temperatures inside the racks. The tempera-ture inside the cluster is regulated by central cooling system (CCS), connected to a dedicated management network, which implements an SNMP service that enables to remote control the cooling and to access its operating data.
In addition, the temperature outside the cluster is regulated by a secondary cooling system (SCS) which is mounted from the ceiling of the server room : the SCS is in charge of maintaining a constant temperature in the server room.
Finally, we have installed Airflow management panels between servers, in order to separate the air of the hot aisle from the air of the cold aisle.
2.2 Power Monitoring
Each element composing the cluster (servers, network switches, fans, condensators, ...) is electrically monitored, and its power con-sumption is recorded every second in a database.
Electrical plugs of servers and network switches are connected to power distribution units (PDUs), which in turn share power con-sumption of servers and network switches via a dedicated service network. Each computing racks contains two PDUs, and each server of a computing rack has two electrical plugs. As depicted in Figure 2, the electrical plugs of a server are connected to two different PDUs,
Figure 1: Layout of the ecotype cluster (front view)
PDU 1 PDU 2 Temperature Sensor Electrical plug Bus (1wire) Scanner (wifi arduino) Server
Power distribution unit
Figure 2: Back view of a server rack
which enables servers to have electrical redundancy. The power consumption of each plug of a server can be fetched by issuing an SNMP request to the PDU it is connected.
In a similar way, energy consumption of the CCS can be fetched by requesting its SNMP service. This SNMP service is able to pro-vide an overall power consumption of the CCS and also the power consumption of each internal part such as the condensator or the fans. The SCS does not implement any built-in networking access, and thus cannot share its metrics with any component over a net-work. To solve this problem, we instrumented several parts of the
e-Energy ’18, June 12–15, 2018, Karlsruhe, Germany Jonathan pastor and Jean Marc Menaud SCS by using a Fluksometer1: a Fluksometer is a connected device
that can monitor several electrical metrics (power consumption, voltage, amperage, ...) and expose their values over a network via a web-service.
Finally, we have added an additional system that tracks overall power consumption of both servers and the CCS. This additional
system is based on the Socomec G50 metering board2, and enables
to check that the aforementioned source of power consumption data are sound. These additional metrics are fetched by using the modbus protocol.
2.3 Temperature Monitoring
In order to track the thermal behavior of the ecotype cluster, each server is monitored by a pair of temperature sensors : one sensor is positioned at the front of the server (in the cold aisle) and another sensor is positioned at the back of the server (in the hot aisle).
As depicted by Figure 2, each temperature sensor is a member of a bus (based on the 1wire protocol) connected to a Scanner (im-plemented by using a wifi arduino) in charge of gathering data from the temperature sensors of the bus. As the front and the back of each server is monitored by temperature sensors, computing racks have in total two Scanners and two buses : a front bus for monitoring the cold aisle and a back bus dedicated to the hot aisle.
Scannersfetch temperatures from their sensors at a frequency of
one reading per sensor every second.
For a first version of the SeDuCe testbed, we have chosen to use the DS18B20 sensor, a temperature sensor produced by “Maxim Integrated”3that costs approximately 3$. According to the specifi-cations provided by its constructor, this sensor is able to provide a temperature reading every 750ms with a precision of 0.5°C between -10 °C and 85 °C.
The key feature of the DS18B20 sensor is that it is able to work as part of an 1wire bus. In the context of the SeDuCe infrastructure, 12 DS18B20 sensors are connected together to form an 1wire bus, and a Scanner, an nodeMCU arduino with built-in wifi capabilities, fetches periodically their temperature readings. The current version of the firmware used by Scanners scans an 1wire bus every seconds, and then pushes temperature data to a Temperature Registerer service, as illustrated in Figure 3.
We also developed a contextualisation tool to generate firmwares for the Scanners. It leverages the PlatformIO framework to program a Scanner that pushes data to a web-service. Using this contextu-alisation tool is simple : a developer needs to define a program template in a language close to C language and marks some parts of code with special tags to indicate that these parts need to be contex-tualized with additional information, such as initializing a variable with the ID of a Scanner device or with the address of a remote web-service (such as the one that will receive temperature records). The contextualisation tool takes this program and a context as input parameters, analyses the template program, and completes parts that requires contextualisation with information provided in the context, which results in valid C language source file. Then, the firmware is compiled and automatically uploaded to Scanners via
1https://www.flukso.net/about
2https://www.socomec.com/range-communication-interfaces_en.html?product=
/diris-g_en.html
3https://datasheets.maximintegrated.com/en/ds/DS18B20.pdf
their serial ports. By leveraging this contextualisation tool, we can remotely configure Scanners and update their firmware.
2.4 Seduce portal
SeDuCe portal InfluxDB Power Consumption Crawlers Temperature RegistererPower sensors Scanners (wifi arduino) API
Users Scripts
polling pushing
Figure 3: Architecture of the SeDuCe portal
To help users to easily access power and thermal metrics gener-ated by the SeDuCe testbed, we developed a platform that exposes
publicly two components : a web portal4and a documented API5
(Application Programming Interface).
As illustrated by Figure 3, the web portal and the API fetch data
from a time series database (TSDB) based on InfluxDB6. InfluxDB
enables to store a large quantity of immutable time series data in a scalable way. In the background, InfluxDB creates aggregates of data by grouping periodically data from a same series. These aggregated sets of data enable the web portal to promptly load data used for visualization.
Two kind of components are in charge of inserting data in the database : the Power consumption crawlers and the Temperature Reg-isterer. Power consumption crawlers are programs that are in charge of polling data from PDUs, Socomecs, Flukso, the CCS and the SCS. In turn, this data is inserted in the database. On the other hand, the
Temperature Registereris a web service that receives temperature
data pushed from nodeMCU arduino devices, and inserts it in the database.
The web portal and the API are both written in Python and leverage the “Flask” micro web framework. The API component
makes an extensive use of the Swagger framework7which
au-tomatises the generation of complete REST web services and their documentations from a single description file (written in JSON or YAML). This choice has enabled us to focus on the definition and the implementation of the API, by reducing the quantity of required boilerplate code.
All the components depicted in Figure 3 are implemented as micro-services. Our system is able to register 200 metrics per sec-onds with minimal hardware requirements (it is currently hosted on a single computer). In the case we add more sensors to our testbed, it is likely that the existing components would be sufficient.
4https://seduce.fr
5https://api.seduce.fr/apidocs 6https://www.influxdata.com/ 7https://swagger.io/
In the case that one of the component would not be able to cope with the additional workload, it would be easy to setup an high availability approach by using a load balancer such as NGINX that would forward requests to a pool of instances of the component.
3 EVALUATING THE DS18B20 SENSOR
3.1 Experimental setup
In this section we evaluate the behaviour of the DS18B20 sensor in order to evaluate its fitness to the thermal measurement of the heat dissipated by servers.
The performance evaluation of the DS18B20 can be made regard-ing two criteria : the precision the temperature it reports, and its response time. The precision of a sensor corresponds to the differ-ence between the reported temperature and the actual temperature (usually it is estimated by a calibrated reference thermometer). On the other hand, the response time of a sensor corresponds to the time taken by the temperature reported by the sensor to converge to the reference temperature.
The evaluation of these two parameters requires an experimental environment and the definition of an experimental protocol.
To ensure that the validation of the DS18B20 sensor is based on reliable data, we used an Hart Scientific 7103 microbath which contained a silicon oil maintained at a specified homogeneous tem-perature. The temperature inside the microbath was controlled by two thermometers (a PT100 probe and a Hart Scientific 1502A). We conducted two experiments : a first experiment to evaluate the precision of the temperatures reported by DS18B20 sensors, and a second experiment to evaluate the reaction time of DS18B20 sensors.
3.2 Sensor precision
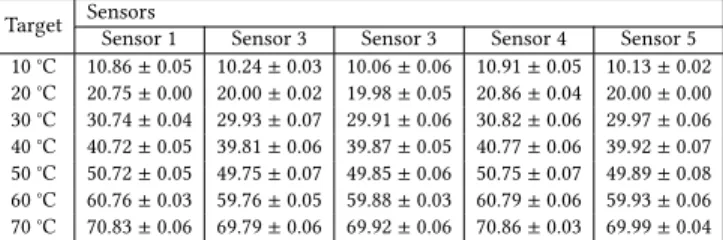
Target SensorsSensor 1 Sensor 3 Sensor 3 Sensor 4 Sensor 5
10 °C 10.86 ± 0.05 10.24 ± 0.03 10.06 ± 0.06 10.91 ± 0.05 10.13 ± 0.02 20 °C 20.75 ± 0.00 20.00 ± 0.02 19.98 ± 0.05 20.86 ± 0.04 20.00 ± 0.00 30 °C 30.74 ± 0.04 29.93 ± 0.07 29.91 ± 0.06 30.82 ± 0.06 29.97 ± 0.06 40 °C 40.72 ± 0.05 39.81 ± 0.06 39.87 ± 0.05 40.77 ± 0.06 39.92 ± 0.07 50 °C 50.72 ± 0.05 49.75 ± 0.07 49.85 ± 0.06 50.75 ± 0.07 49.89 ± 0.08 60 °C 60.76 ± 0.03 59.76 ± 0.05 59.88 ± 0.03 60.79 ± 0.06 59.93 ± 0.06 70 °C 70.83 ± 0.06 69.79 ± 0.06 69.92 ± 0.06 70.86 ± 0.03 69.99 ± 0.04 Table 1: Comparison of 5 DS18B20 sensors (mean tempera-ture ± standard deviation)
To evaluate the precision of DS18B20 sensors, we plunged 5 sensors into a silicon oil configured to be at a precise target tem-perature. Once the temperature of the silicon oil is stabilized, we measured the temperatures reported by the 5 DS18B20 sensors dur-ing 20 minutes. The target temperature was initially set at 10 °C, and incrementally increased by steps of 10 °C.
Table 1 summarizes the temperatures reported by DS18B20 sen-sors at each step of temperature.
First, it is noticeable that for each targeted temperature, the average temperature reported by a DS18B20 sensor is in a range of 1°C band around the target temperature. While this value is higher than the 0.5°C advertised by the manufacturer, it should be relativised : when the target temperature is set to 20°C the difference
between the worst sensor and the reference temperature is less than 5%, and at 50°C it becomes lower than 2%. These results should also be put in the perspective of the price range of DS18B20 sensors (approximately 3$ per unit).
Second, it appears that for a given sensor, the difference between the reported temperature and the reference temperature is stable for any temperature steps. Thus, by comparing several temperature records of a DS18B20 sensor with those of a reference thermometer (such as the one we used to stabilize the silicon oil), it would be pos-sible to modelise the difference between the temperature reported by the sensor and the reference temperature. This would enable the implementation of a calibration mechanism that will be in charge of correcting the difference between the reported temperature and the reference temperature.
3.3 Sensor reactivity
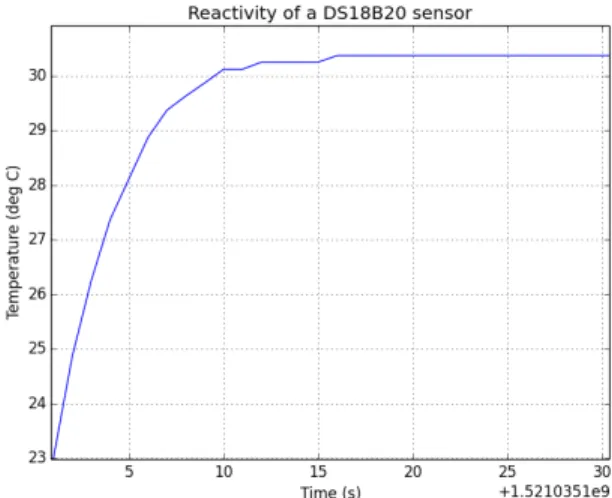
To evaluate the reaction time of DS18B20 sensors, we plunged a single DS18B20 sensor from the ambient air at a temperature of 23°C into a silicon oil at a temperature of 30°C. We measured the time taken by the temperature reported by the DS18B20 sensor to converge to the temperature reported by the reference thermometer. Figure 4 plots these measurements.
The sensors takes about 10 seconds to stabilize at the temperature reported by the reference thermometer. This delay can be explained by the fact the DS18B20 sensor uses a “TO-92” semiconductor pack-age which leverpack-ages plastic to protect its internal components from the external environment. This plastic shield enables the sensor to be used in a wide range of environments. However, the drawback is that it creates a thermal inertia, as the heat has to first penetrate the plastic shield before reaching the electronic part of the sensor. This result indicates that DS18B20 are not suitable for configura-tions where temperature can suddenly change as the reactivity of the DS18B20 sensor is low. However, it appears to be appropriate for cases where the temperature is temperature is already stabilized and will only change smoothly, such as about a few °C over tens of seconds, such as in the hot aisle of the cluster.
4 EXPERIMENTATION
To illustrate the potential of the SeDuCe platform, we conducted an experiment that mixes energetic and thermal monitoring The goal of the experiment was to verify that the data produced by the SeDuCe testbed is reliable, by designing an experiment that will use both the thermal and the power data produced by the testbed. These data would be used to reproduce a scientifically validated observation, such as the impact of idle servers on the power consumption and the temperature of a server room.
Such experiment has been conducted in the past [6], however as far as we know there is no public testbed that would enable researchers to reproduce this result : by reproducing this result on the SeDuCe testbed, we think that it would demonstrate the soundness of our approach and the usefulness of our testbed.
4.1 Description of the experiment
To illustrate the scientific relevance of our testbed, we wanted to reproduce the observations made by third party publication [6].
e-Energy ’18, June 12–15, 2018, Karlsruhe, Germany Jonathan pastor and Jean Marc Menaud
Figure 4: Reactivity of a DS18B20 plunged in a silicon oil at 30°C temperature
In [6], authors have highlighted an interesting fact : in a data-center idle servers (i.e. servers that are turned on while not being used to execute any workload) have a significant impact on power consumption and heat production. We decided to try to reproduce this observation.
For this experiment, servers of the ecotype cluster are divided in three sets of servers:
• Active servers: servers with an even number (2, ecotype-4, ..., ecotype-48) were executing a benchmark that generates a CPU intensive workload.
• Idle servers: a defined quantity (0, 6, 12, 18, 24 servers) of servers with an odd number (1, 3, ..., ecotype-47) was remaining idle.
• Turned-off servers: remaining servers were electrically turned off.
and during one hour we recorded the power consumption of the CCS and the average temperature in the hot aisle of the ecotype cluster.
The CPU intensive workload was based on the “sysbench” tool : the goal was to stress CPUs of each servers, resulting in an impor-tant power consumption and a bigger dissipation of heat.
To guarantee the statistical significance of the measurements, each experimental configuration was repeated 5 times, leading to a total number of 25 experiments.
We executed two sets of experiments : one with the SCS turned-on (Figure 5) and the other while the SCS was turned off (Figure 6). The objective of turning off the SCS was to identify the impact of the SCS over the CCS.
4.2 Results
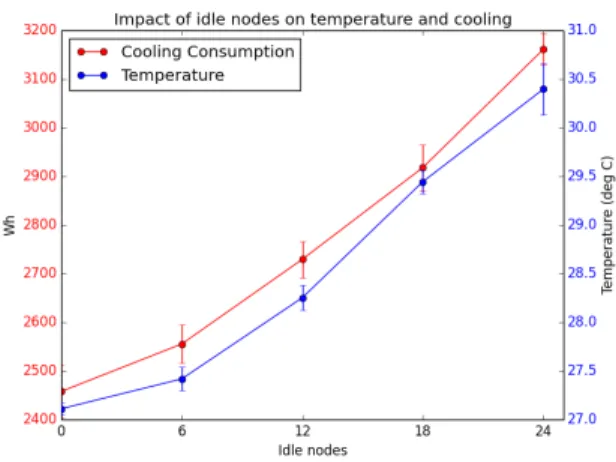
Figure 5 plots the cumulated power consumption of the CCS and the average temperature in the hot aisle of the cluster with the SCS enabled.
First, it is noticeable that as the number of idle nodes increases, both the energy consumed by the SCS and the temperature in the
hot aisle of the rack increase. This can be explained by the fact that an idle node consumes some energy and produces some heat, which increases the workload of the CCS.
The second element highlighted by Figure 5 is that the impact of idle nodes is not linear : the red line representing the CCS consump-tion follows an exponential pattern and the blue line representing the average temperature in the hot aisle follows a sigmoid pattern. The exponential pattern of the power consumption of the CCS can be explained by the fact that the heat produced by a given server has an impact on the temperature of surrounding servers, thus increasing their needs in terms of cooling. Consequently, to cool the additional heat produced by idle servers, the CCS has to work more frequently. On the other hand, the sigmoid pattern of the average temperature in the hot aisle is explained by the fact that the CCS has its own monitoring of the temperature inside racks, and when temperatures at the back of servers reach a threshold, the CCS works more frequently and intensively to make the average temperature back under a specific threshold, thus attenuating the increase of the temperature in the hot aisle.
Figure 6 plots the cumulated power consumption of the CCS and the average temperature in the hot aisle of the cluster while the SCS is disabled. This figure highlights that the power consumption of the CCS is lower when the SCS is disabled. This can be explained by the fact that the SCS was configured to maintain a temperature of 19 °C in the outside room, which is close to the maximum temperatures in the cold aisle : as the SCS does not cool down enough the outside air, by means of thermal conduction, it warms the temperature inside the racks. As a consequence, it increases the needs in term of cooling inside the cluster, leading to an higher power consumption of the CCS.
This experimental campaign has shown that idle servers have an important impact on the power consumption of cooling systems and overall racks temperature, thus it confirms the observation made in this publication [6].
Figure 5: Central cooling consumption and average temper-ature in the hot aisle (SCS enabled)
5 FUTURE WORK
We are considering the replacement of DS18B20 sensors by more reactive and precise sensors. While being suitable for monitoring
Figure 6: Central cooling consumption and average temper-ature in the hot aisle (SCS disabled)
Figure 7: Comparison between DS18B20 and thermocouples temperatures in the hot aisle of our cluster, we have noticed that DS18B20 sensors are not fitting for configurations where tempera-ture can suddenly change in short period of time, as it happens in the cold aisle. Figure 7 compares a DS18B20 sensor and a thermo-couple based sensor, both positioned in the cold aisle at the front of the “ecotype-6” server, and recording temperatures during a typ-ical instance of the CCS workload. At t=0s, the CCSs just finished cooling the cold aisle, thus the temperature has reached its lowest level and is going to increase. The CCS restarts to cool the cluster at t=300s. It is noticeable that the temperature measured by the thermocouple based sensor drops significantly after few seconds, while the DS18B20 sensor measures a temperature that is falling gradually over a hundred of seconds. Even worse, we can see at t=420s that the minimal temperature measured by the DS18B20 sensor does not correspond to the minimal temperature reported by the reference thermometer, but rather to the intersection between its decreasing measured temperature and the increasing reference temperature. We explain this observation by the thermal design of the DS18B20 : as stated in Section 3.3 it leverages the “TO-92” semiconductor package which leads to a significant thermal inertia in air environment.
The thermocouple sensor seems more fitted for measuring the temperature of the cold aisle of the cluster : the MAX31850 is ther-mocouple amplifier compatible with the 1wire protocol, which is compatible with the software architecture we have developed. Ther-mocouples based sensors would lead to a significant improvement in terms of precision and thermal reactivity : we are considering replacing DS18B20 sensors by sensors based on MAX31850K.
6 CONCLUSION
In this article we have presented our initial work on building the Se-DuCe testbed, which targets research related to power and thermal management in datacenters. We have described the architecture of the testbed, which is built on buses of sensors, storage of power and thermal metrics in a time series oriented database (InfluxDB) and an user friendly web portal and a documented API. We have also detailed the components used in this first version of the SeDuCe testbed, and their limitations such as the lack of reactivity of the DS18B20 sensor, a low cost temperature sensor that shows its limits in situation where temperature changes suddendly. However, this model of sensor remains relevant in a large number of situations. Future work on this first version of the SeDuCe testbed will mainly focus on evaluating more reactive temperature sensors. We are thinking to replace all or a part of the existing sensors by thermocouple based sensors, whose main advantages are that they are more reactive and more precise while remaining affordable.
REFERENCES
[1] Raphaël Bolze, Franck Cappello, Eddy Caron, Michel Daydé, Frédéric Desprez, Emmanuel Jeannot, Yvon Jégou, Stephane Lanteri, Julien Leduc, Noredine Melab, et al. 2006. Grid’5000: A large scale and highly reconfigurable experimental grid testbed. The International Journal of High Performance Computing Applications 20, 4 (2006), 481–494.
[2] Jeffrey S Chase, Darrell C Anderson, Prachi N Thakar, Amin M Vahdat, and Ronald P Doyle. 2001. Managing energy and server resources in hosting centers. ACM SIGOPS operating systems review35, 5 (2001), 103–116.
[3] Florentin Clouet, Simon Delamare, Jean-Patrick Gelas, Laurent Lefèvre, Lucas Nussbaum, Clément Parisot, Laurent Pouilloux, and François Rossigneux. 2015. A unified monitoring framework for energy consumption and network traffic. In TRIDENTCOM-International Conference on Testbeds and Research Infrastructures for the Development of Networks & Communities. 10.
[4] Eugen Feller, Louis Rilling, and Christine Morin. 2011. Energy-aware ant colony based workload placement in clouds. In Proceedings of the 2011 IEEE/ACM 12th International Conference on Grid Computing. IEEE Computer Society, 26–33. [5] Fabien Hermenier, Xavier Lorca, Jean-Marc Menaud, Gilles Muller, and Julia
Lawall. 2009. Entropy: a consolidation manager for clusters. In Proceedings of the 2009 ACM SIGPLAN/SIGOPS international conference on Virtual execution environments. ACM, 41–50.
[6] Justin D Moore, Jeffrey S Chase, Parthasarathy Ranganathan, and Ratnesh K Sharma. 2005. Making Scheduling" Cool": Temperature-Aware Workload Place-ment in Data Centers.. In USENIX annual technical conference, General Track. 61–75.
[7] Eduardo Pinheiro, Ricardo Bianchini, Enrique V Carrera, and Taliver Heath. 2003. Dynamic cluster reconfiguration for power and performance. In Compilers and operating systems for low power. Springer, 75–93.
[8] Hongyang Sun, Patricia Stolf, and Jean-Marc Pierson. 2017. Spatio-temporal thermal-aware scheduling for homogeneous high-performance computing data-centers. Future Generation Computer Systems 71 (2017), 157–170.
[9] Gregor Von Laszewski, Lizhe Wang, Andrew J Younge, and Xi He. 2009. Power-aware scheduling of virtual machines in dvfs-enabled clusters. In Cluster Com-puting and Workshops, 2009. CLUSTER’09. IEEE International Conference on. IEEE, 1–10.
[10] Chia-Ming Wu, Ruay-Shiung Chang, and Hsin-Yu Chan. 2014. A green energy-efficient scheduling algorithm using the DVFS technique for cloud datacenters. Future Generation Computer Systems37 (2014), 141–147.