Supplementary material
Evaluation of hydrogen peroxide and ozone residue levels on N95 masks following chemical
decontamination
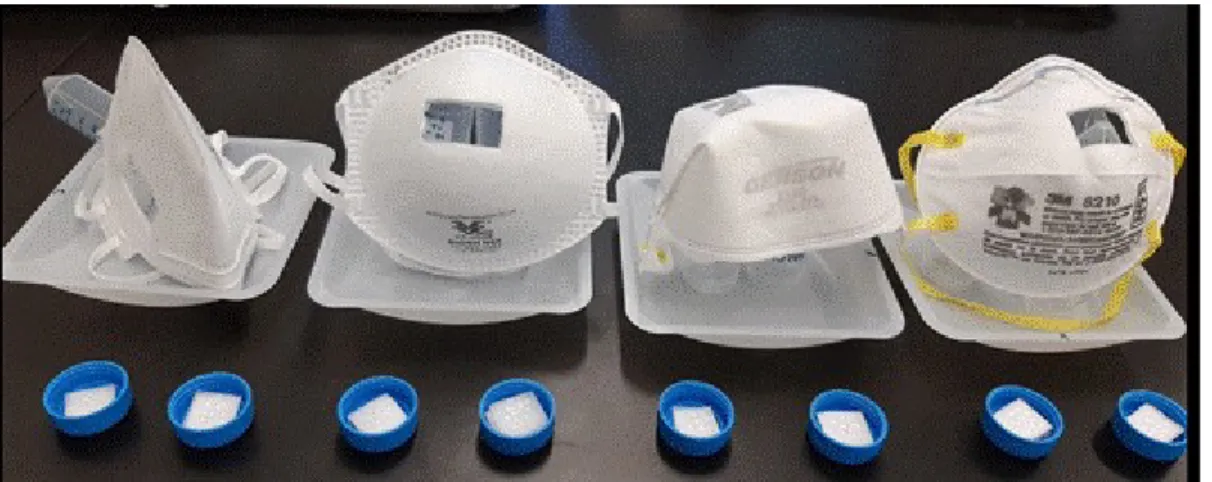
Figure S1: Layers of N95 masks (A to F) separated from a 2 cm x 2cm piece outer layer middle layer inner layer
Figure S2: A 2 cm x 2 cm piece sampled from the masks for hydrogen peroxide extraction
Chemicals
30% by weight (% wt.) hydrogen peroxide (CAS 7722-84-1, Perhydrol™, 25% wt. sulfuric acid (H2SO4,
CAS 7664-93-9, for analysis EMSURE®) and 15% wt. titanium oxysulfate solution in diluted sulfuric acid (TiO(SO4), CAS 13825-74-6, trace metal grade) were acquired from Millipore Sigma, Darmstadt,
Germany. Deionized water (DIW) for extraction and preparing reagent solution and hydrogen peroxide standard solutions was generated from reverse osmosis connected to the ultrapure water type I (Millipore Synergy UV-R, Canada).
Data processing
The concentration of hydrogen peroxide (mmol/L) on the N95 masks from the extraction was obtained via a calibration graph of hydrogen peroxide standard solutions. The extraction volume (10 mL) and weight of one N95 mask and a test piece were used and reported as mg/mask using Equation 1.
Concentration of H
2O
2per mask=
[
C ] x 34 x extration volume x wt
maskw t
test piecex 1,000
When [C] is a concentration of hydrogen peroxide (mmol/L) obtained from a calibration graph and 34 is a molecular weight of hydrogen peroxide (34 g/mol), and extraction volume is 10 mL.
Method validation for residual gas phase analysis and hydrogen peroxide on masks
The commercial gas detectors were calibrated and subsequently used as prescribed by the manufacturers. Background levels of hydrogen peroxide and ozone gas released from untreated masks were as follows: hydrogen peroxide was not detected and ozone ranged from 0.03 ppm to 0.04 ppm.
To obtain hydrogen peroxide background levels of untreated N95 masks, a new mask was extracted with deionized water and conducted the same reaction as described above. Background level readings of untreated masks ranged from 0.04 mg/mask to 0.37 mg/mask from mask A (Table S1). The method accuracy was determined using surrogate samples. The percent recovery of the surrogate samples ranged from 80% to 105%. The overall mean recovery and associated uncertainty was 98% 4% (at 95% confidence interval).
Table S1: Background hydrogen peroxide of untreated N95 masks (n=3) Labe
l untreated N95 mask
Background level of hydrogen peroxide (mg/mask) A 3M 1860 0.371 0.095 B 3M 8210 0.044 0.020 C 3M 9205 0.038 0.056 D FT N040 0.276 0.066 E FT N058 0.057 0.028 F Gerson 2130 0.074 0.015
Table S2: Hydrogen peroxide and ozone gases (ppm) after decontamination process I following aeration Time
(h)
Hydrogen peroxide (ppm) Ozone (ppm)
2.00 0.1 0.4 0.1 0.3 0.6 0.4 0.080 0.096 0.06 0.086 0.123 0.101
2.50 0.0 0.5 0.1 0.2 0.3 0.3 0.052 0.096 0.054 0.081 0.101 0.083
Table S3: Hydrogen peroxide and ozone gas (ppm) afterdecontamination process II following aeration Time
(h)
Hydrogen peroxide (ppm) Ozone (ppm)
A B C D E F A B C D E F 0.50 10.8 6.8 4.5 1.8 5.2 14.5 0.058 0.074 0.108 0.046 0.045 0.07 1.00 3.6 3.0 2.3 0.7 2.7 5.6 0.103 0.095 0.084 0.040 0.084 0.073 1.50 1.6 1.3 1.8 0.5 2.4 2.7 0.127 0.098 0.107 0.043 0.107 0.084 2.00 1.6 1.6 1.1 0.4 1.2 1.7 0.145 0.103 0.078 0.038 0.123 0.116 2.50 0.8 0.9 1.2 0.3 1.4 0.8 0.130 0.109 0.134 0.048 0.124 0.112 3.00 0.7 0.7 1.2 0.2 1.3 0.7 0.137 0.129 0.130 0.062 0.134 0.123 3.50 0.6 0.7 0.9 0.2 1.0 0.6 0.108 0.129 0.133 0.062 0.141 0.136 4.00 0.7 0.4 0.6 0.1 0.8 0.6 0.105 0.128 0.106 0.067 0.118 0.136 4.50 0.6 0.6 1.2 0.1 0.7 0.7 0.083 0.115 0.081 0.058 0.129 0.088 5.00 0.6 0.6 1.5 0.0 0.6 0.5 0.09 0.083 0.113 0.044 0.134 0.132 5.50 0.5 0.5 0.9 0.1 0.5 0.2 0.075 0.08 0.109 0.052 0.131 0.139 24.0 0.0 0.0 0.0 0.0 0 0 0.033 0.076 0.078 0.022 0.032 0.050
Table S4: The concentrations of hydrogen peroxide and associated standard deviation (mg/mask) on N95 masks (A to F) after decontamination process I Time (h) Process I A B C* D E F 0.5 1.01 0.35 1.03 0.14 0.028 0.008 1.66 0.05 1.63 0.257 4.84 1.07 1 0.594 0.248 0.773 0.046 0.032 0.016 0.719 0.284 1.34 0.226 3.10 0.63 2 0.230 0.091 0.428 0.077 0.016 0.004 0.204 0.056 0.749 0.049 1.34 0.11 3 0.306 0.107 0.257 0.020 0.020 0.011 0.321 0.304 0.481 0.061 0.128 0.22 6 0.305 0.020 0.135 0.081 0.011 0.008 0.271 0.070 0.119 0.010 0.020 0.015
*The concentration of hydrogen peroxide from mask-C is below the limit of detection (0.16 g/mask).
Table S5: The concentrations of hydrogen peroxide and associated standard deviation on N95 masks (A to F) after decontamination process II
Time (h) Process II A B C D E F 0.5 20.9 3.8 34.5 8.3 0.109 0.114 7.12 0.73 55.9 2.4 47.6 4.6 1 11.3 1.8 23.1 3.2 0.209 0.242 4.09 0.97 39.6 3.8 28.3 2.7 2 8.80 0.46 11.7 2.0 ND 1.27 0.26 19.5 2.5 14.1 1.35 3 3.29 0.77 7.46 1.20 ND 0.606 0.135 7.49 1.9 5.86 0.56 4 3.25 0.29 5.21 1.06 ND 0.430 0.090 5.33 1.6 3.83 0.37 5 2.15 0.20 3.50 0.5 ND 0.303 0.068 2.31 0.95 1.77 0.17 24 0.455 0.186 0.050 0.050 ND 0.118 0.022 0.131 0.023 0.037 0.015
Figure S3: Exponential correlation between hydrogen peroxide residue on N95 masks (A to F) from process I
and aeration time (h)
Figure S4: Exponential correlation between
hydrogen peroxide residue on N95 masks (A to F) from process II and aeration time (h)
0 0.5 1 1.5 2 2.5 3 3.5 4 4.5 5 0.000 0.200 0.400 0.600 0.800 1.000 1.200 f(x) = 0.64 exp( − 0.17 x ) R² = 0.38
A
0 0.5 1 1.5 2 2.5 3 3.5 4 4.5 5 0.000 0.400 0.800 1.200 f(x) = 1.03 exp( − 0.36 x ) R² = 0.94B
0 0.5 1 1.5 2 2.5 3 3.5 4 4.5 5 0.000 0.010 0.020 0.030 0.040 0.050 f(x) = 0.03 exp( − 0.17 x ) R² = 0.79C
0 0.5 1 1.5 2 2.5 3 3.5 4 4.5 5 0.000 0.400 0.800 1.200 1.600 2.000 f(x) = 0.88 exp( − 0.26 x ) R² = 0.43D
0 0.5 1 1.5 2 2.5 3 3.5 4 4.5 5 0.000 0.200 0.400 0.600 0.800 1.000 1.200 1.400 1.600 1.800 f(x) = 2.05 exp( − 0.48 x ) R² = 1E
0.000 0.500 1.000 1.500 2.000 0.000 2.000 4.000 6.000 8.000 f(x) = 14.43 exp( − 2.03 x ) R² = 0.83F
0 0.5 1 1.5 2 2.5 3 3.5 4 4.5 5 0.0 10.0 20.0 30.0 40.0 f(x) = 37.7 exp( − 0.5 x ) R² = 0.98B
0 0.5 1 1.5 2 2.5 3 3.5 4 4.5 5 0.00 0.05 0.10 0.15 0.20 0.25 f(x) = − 0.03 x + 0.15 R² = 0.52C
0 0.5 1 1.5 2 2.5 3 3.5 4 4.5 5 0.00 2.00 4.00 6.00 8.00 f(x) = 7.43 exp( − 0.71 x ) R² = 0.94D
0 0.5 1 1.5 2 2.5 3 3.5 4 4.5 5 0.0 10.0 20.0 30.0 40.0 50.0 60.0 f(x) = 77.61 exp( − 0.7 x ) R² = 0.99E
0 0.5 1 1.5 2 2.5 3 3.5 4 4.5 5 0.0 15.0 30.0 45.0 60.0 f(x) = 60.36 exp( − 0.71 x ) R² = 0.99F
0 1 2 3 4 5 0.0 5.0 10.0 15.0 20.0 25.0 f(x) = 21.27 exp( − 0.49 x ) R² = 0.93A
Table S6: Predicted hydrogen peroxide on masks after drying (h) by decontamination process I Process I Measured hydrogen peroxide (mg/mask) after 0.5 h drying Function
Predicted hydrogen peroxide (mg/mask) after drying (h)
0.5 h 2 h 3 h A 1.010 Y = 0.6426e-0.171x 0.59 0.46 0.38 B 1.033 Y = 1.0257e-0.365x 0.85 0.49 0.34 C 0.028 Y = 0.0309e-0.171x 0.03 0.02 0.02 D 1.659 Y = 0.8758e-0.256x 0.77 0.52 0.41 E 1.630 Y = 2.0549e-0.478x 1.62 0.79 0.49 F 4.844 Y = 14.431e-2.027x 5.24 0.25 0.03
Table S7: Predicted hydrogen peroxide on masks after drying (h) by decontamination process II
Process II
Measured hydrogen peroxide (mg/mask) after 0.5 h drying
Function
Predicted hydrogen peroxide (mg/mask) after drying (h)
0.5 h 2 h 3 h 9 h A 20.93 Y = 21.271e-0.488x 16.7 8.0 4.9 0.26 B 34.50 Y = 37.696e-0.498x 29.4 13.9 8.5 0.43 C 0.109 No correlation - - - -D 7.12 Y = 7.4256e-0.707x 5.2 1.8 0.9 0.01 E 55.95 Y = 77.612e-0.704x 54.6 19.0 9.4 0.44 F 47.63 Y = 60.36e-0.714x 42.2 14.5 7.1 0.10
Table S8: Hydrogen peroxide amounts per application in cosmetic products vs. residual hydrogen peroxide levels reported in this study
Products (hydrogen peroxide composition) Amount of hydrogen peroxide per application a
Hair dying (1% to 6%) 720 mg
Textile bleaching (35%) 36 mg
Mouthwash (0.1%) 15 mg
Tooth beaching (2% to 35%) < 1 mg
Decontamination process I (this study) < 0.49 mg (residue after aeration 3 h) Decontamination process II (this study) < 8.5 mg (residue after aeration 3 h)
< 0.44 mg (residue after aeration 9 h)
[1] ECHA. EUR 20844 EN European Union Risk Assessment Report hydrogen peroxide. In: Munn SJ, Allanou R, Aschberger K, Berthault F, Bruijn de J, Musset C, et al., editors. Eur. Union Risk Assess. Rep. Volume 38, Luxembourg: Office for Official Publications of the European Communities; 2003, p. 258.