Why do poverty reduction strategies not bring real effects in Northern Mountain, Vietnam ? Case of the commune of Xuan Phong and Tu Ly, Hoa Binh province
21
0
0
Texte intégral
(2) Why do poverty reduction strategies not bring real effects in Northern Mountain, Vietnam? Case of the commune of Xuan Phong and Tu Ly, Hoa Binh province Mai Lan Phương[1], Phillippe Lebailly[2], Nguyen Mau Dung[3]. Summary In many developing countries, the poverty alleviation program has been implemented since the 1980’s and 1990’s, and will be continued into the next decades. The emerging question is why “poverty issues” still exist for such a long time and do challenge not only the Vietnamese government but also many countries all over the world. One may ask if poverty reduction strategies, applied in Vietnam and other countries, are suited to the real poverty situation, and if they are sustainable. This paper is based on a research to investigate the nature of government’s interventions as a “poverty reduction strategy”, at Tu Ly and Xuan Phong communes in Hoa Binh province. Vietnam’s official poverty identification method and participatory poverty assessment of people are applied. This study does claim that the currently “inappropriate definition of poverty” is a key problems at the roots of the lack of obvious success of the ongoing strategy. Key words: Poverty, Poverty reduction strategies, Development strategy 1. Introduction The definition of poverty is not unique and it changes according to the economic and social situation of the country. In Viet Nam, formerly the poverty was absolute and synonymous with famine. There was a lack of income for families and they lived in precarious conditions, with no access to health care, education etc. Currently, poverty reflects a relative state. Poor people are the people who have more problems or vulnerabilities in their daily lives than others in the same social economic environment. The weight of poverty is especially present in remote areas, especially mountainous areas, populated by ethnic minorities. This population lacks infrastructure and access to resources that could cover their basic needs. 2.
(3) Since the 1990s, to combat poverty, Viet Nam developed many strategies which have changed over the years with the needs and the results in areas of concern. Governmental provisions were to promote so-called integrated strategies both for increasing food production, crop diversification and access to various basic services. In particular, since 2001, with the assistance of the World Bank and the IMF, Viet Nam has developed what we call the “The Comprehensive Poverty Reduction and Growth Strategy" (GPRGS). Initially, these strategies have had a good impact on the lives of poor households, especially in rural areas. Life is seen to be transformed in a very positive way. The national poverty rate has fallen from 37.4% in 1998 to 9.5% in 2010. However, although the national rate of poverty decreased, and despite all the efforts of everybody, poverty in Viet Nam is still very "stable". The Ministry of Labour, Invalids and Social Affairs (MOLISA) in its report "Evaluation of control strategies against poverty mid-term"1 found that GPRGS outcomes are not sustainable because households that come out of poverty have incomes close to the national poverty line and are remaining groups at risk. In fact, the gap between the rich and the poor grows more and more. The standard of living of poor households is still low especially in mountainous areas. It appears that a identical implementation of the strategies of poverty alleviation for all regions of the country is not adapted and does not produce the desired effects. The administrative system cannot handle specific poverty situations on a daily basis and it is why households cannot receive the aid they need when they need. The report also notes that 10% of the beneficiaries of assistance from these programs are not poor and that, at the same time, 52.1 per cent of poor households are not included in the list of poor households of the communes. This entails the current problem of the revision of the poor population census in the Viet Nam. 1. MOLISA. 2009. Looking back to face a new challenges: "Evaluation of control strategies against poverty midterm". 3.
(4) A close look at the reality of poverty in Viet Nam shows that a dichotomous vision (poor against non-poor) is irrelevant: some households are not truly poor (their monetary income rose above the national poverty line) but the real ability of these households to overcome shocks remains very low and therefore the need of social protection is required. However, this category of households receives nothing because the local government and social associations are not interested in them. This form of exclusion is derived from the definition of the MOLISA that determines who will get the status of "poor household" and to benefit from subsidies. The calculation technique used to determine the status of household appears not to reflect always the true nature of poverty. In our study we try to understand how the administrative authorities define the class of poor households, and to propose alternative methods to ensure sustainable poverty alleviation strategies. 2. Methodology The province of Hoa Binh was selected for the study because it has the social and economic characteristics adapted to the study. Hoa Binh is one of the provinces of the mountainous Northern region of Viet Nam where the poverty rate has declined after the policy of "Doi me". However, the rate of poverty in the province is still high and the standard of living of the population is still low. The growth of GDP amounts to 11.8% during 2000-2010. The poverty rate was 31.31% in 2005, and was 14% in 2010 , but in 2011 the rate of poverty has jumped again to 37.68% , according to the new rate of poverty. During the past ten years, the average income per person per year has increased from 4.3 million VND/person to 18.1 million VND/person. The commune of Xuan Phong which is located in the district of Cao Phong , and the commune of Tu Ly, located in the Da Bac district have been selected for this research because the features. of both these communes are representative of the province of Hoa. Binh. The main activities are related to agriculture and forestry. Processing activities are. 4.
(5) poorly developed. Most households incomes are linked to corn and cane sugar. Rice is not enough developed to ensure the consumption of the family, and animal raising is poorly developed. They are five ethnic groups in the municipality of Tu Ly: the Muong (50%), Dao (17%), the Kinh (17%), Thai (12%), and the Tay (4%). The commune gathers 13 villages consisting of 1314 homes. Xuan Phong commune consists of 12 villages with a total of 729 households and a total population estimated currently at 3304 people. In this municipality there are now three ethnic groups: the Muong 98.5%, the Vietnamese and Thai, which represents 1.5% of the population. Data were collected in 2009-2010 during a survey of 90 households. They provide a basis of multidisciplinary variables intended to cover the different aspects of the living conditions of the household. Thanks to the established mutual trust, data could be collected by direct observation of the village framework. The final questionnaire could be established following discussions with the village authorities and communal officials, who provided the information on the characteristics and problems of the villages. It is through them that we were able to make contact with the various categories of stakeholders in the villages. The choice of 90 families is based on the national poverty line defined between 20062010.[4]. According to the information gathered, the sample could be divided into 3 groups in the two communes: o The first group (A) includes the category "persistently poor", i.e. households who are poor for all dates where data are available; o The second group (B) includes "the transient poor", which have average incomes above the poverty threshold , but are found among poor households at certain dates; 5.
(6) o The third category does not have currently an income level below the level of poverty , but were poor in the past. That (C) group has just come out of poverty; 3 Search results 3.1. The beneficiaries of the fight against poverty strategy Since the 2000s, like all mountainous regions in the North, the province of Hoa Binh has implemented many programs of the Government to combat poverty. During the period 2001-2005, the objectives of these programs were to: -. Decrease the rate of poverty and to achieve a rate of less than 10%. Each year the poverty had to decrease by a rate of about 3% to 4% (i.e. annually a reduction of about 4,500 to 6000 poor households at the level of the province);. -. Improve the infrastructure of all communes such as roads, schools, centers of health care, drinking water, irrigation, local markets etc. In the period 2006-2010, the poverty rate has fallen from 31.31% in 2005 to 8,86 % in. 2010, with the improvement of living conditions of poor households, the decrease in the income gap between poor and rich, between rural and urban areas. To achieve these results, two types of projects were being implemented, as follows: -. The first was to directly target poor households with low rates credits and extension projects.. -. The second has worked at the level of municipalities with basic infrastructure projects, the creation of other money earning activities to strengthen the capacity of the villagers to obtain extra farm income, and training communal cadres especially in the poorest communes, etc.. The recipients of these strategies were the poorest in general , poor households as well as poor communes.. 6.
(7) Who are the poor households in Viet Nam? All households who have incomes below the national poverty level are classified as poor. The poverty line is calculated on a base of daily needs: food base, clothing and household supplies etc. Since 2000 until today, the national poverty line has changed three times. As shown in the figure 1, the national poverty line in rural households. increased. from. 80,000. VND/month/person. in. 2001. to. 400,000. VND/month/person in 2011. All the communes of the province of Hoa Binh, like other communes in the mountainous region of the North must apply this threshold to calculate their rate of poverty. This means that the price used to calculate the threshold of the poverty of Hoa Binh is not the local price. Based on this threshold, one can establish the number of poor households, and a list that includes all these households by village as well as in the different communes. These data have to allow checking the proper functioning of poverty alleviation strategies and other relevant policies. If one look at the graph showing the rate of poverty in Hoa Binh since 2001, we can see that the rate of poverty has fluctuated heavily. It has decreased very strongly at the end of each period, but it has jumped to a new height at the beginning of the following period. For example, in the period of 2005 – 2010 the rate has fallen from 31.31%% to 13.87 %, but as soon as early 2011 the poverty rate has jumped again to 31,51% (according to the new poverty line for the period 2011-2015).. 7.
(8) In the two communes studied, the rate of poverty in the year 2011 is very much higher than in the year 2010 due to the change about the threshold of poverty. The poverty threshold change every five years due to inflation. Every five years one has to reset the counters to zero at the level of the new poverty rate figures. In other words, it is the return of poverty. At the end of the previous period poor households seemed less poor in monetary terms, compared to their previous life. But their current real situation of poverty has almost not changed. This shows that poor households are always lagging behind, and that strategies that combat poverty meet the needs of poor households only in a short moment at the beginning of a new period. 3.2. Determination of poor households by the MOLISA method The MOLISA and Departments of Labor Invalids and Social Affairs (DOLISA) poverty data collection is based on a „perception‟ index carried out under a MOLISA circular No. 04/2007/TT-BLĐTBXH, dated 28 February, 2007. Data are collected once a year at the end of the year in November. The survey is processed and the record is published in the first quarter of the following year thereby giving the list of household and household members to receive benefits during the one year period following the publishing of the list. The poverty data collection starts at the Commune level where a Commune survey board is established to review household wellbeing. This board includes the heads of villages and representatives from associations and unions. The survey board reviews the poverty situation in a fully participatory manner and submits the results to a District Survey Board for approval and subsequently to the Commune People‟s Committee to include a new list of those who have not escaped poverty. The assessment is based on those household judged to be below the poverty line which are then listed.. 8.
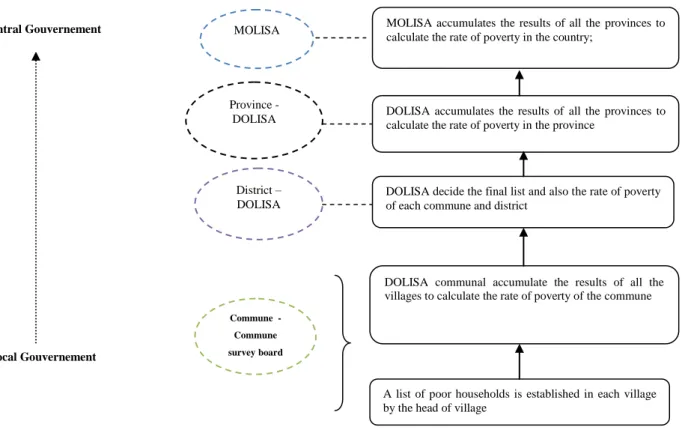
(9) At the commune level, we can see that the chiefs of villages and the communal officials play a very important role in determining precise figures for the rate of poverty of the people.. Central Gouvernement. MOLISA accumulates the results of all the provinces to calculate the rate of poverty in the country;. MOLISA. Province DOLISA. DOLISA accumulates the results of all the provinces to calculate the rate of poverty in the province. District – DOLISA. DOLISA decide the final list and also the rate of poverty of each commune and district. DOLISA communal accumulate the results of all the villages to calculate the rate of poverty of the commune Commune Commune. Local Gouvernement. survey board. A list of poor households is established in each village by the head of village. Figure 1-Level of Administrative authority to manage poor household There are two groups of households which are analyzed. The first includes the poor households of the previous year, but that are perhaps no more poor in the revised year. The second group is households which were not poor last year but who have perhaps become poor during the revised year. First of all, village leaders write in priority two lists of the two groups of households to be analyzed, and based on revised data from the previous year and their observations throughout the year: one list for those likely to exit poverty and one for those having an income below the poverty line. Then, they take in consideration the revised criteria of MOLISA like: the changes which have occurred in the status of workers active in the household; situation of income, welfare, cropland; the basic living conditions - like electricity, water, accommodation in the house and also the risks in the production activity. Henceforth they are. 9.
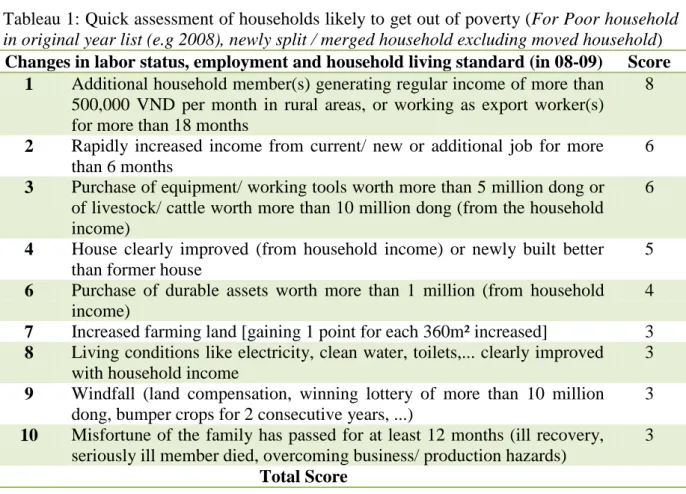
(10) able to calculate the points acquired by each household on the list. It should also be noted that all these changes are in relation to the change of income and expenditure of households. Therefore, if households in the first list have more than 10 points, they are no longer in the criteria of poverty and households in the second list if they have 10 or more, are at risk of being poor during the period calculated. Tableau 1: Quick assessment of households likely to get out of poverty (For Poor household in original year list (e.g 2008), newly split / merged household excluding moved household) Changes in labor status, employment and household living standard (in 08-09) Score Additional household member(s) generating regular income of more than 8 1 500,000 VND per month in rural areas, or working as export worker(s) for more than 18 months Rapidly increased income from current/ new or additional job for more 6 2 than 6 months Purchase of equipment/ working tools worth more than 5 million dong or 6 3 of livestock/ cattle worth more than 10 million dong (from the household income) House clearly improved (from household income) or newly built better 5 4 than former house Purchase of durable assets worth more than 1 million (from household 4 6 income) Increased farming land [gaining 1 point for each 360m² increased] 3 7 Living conditions like electricity, clean water, toilets,... clearly improved 3 8 with household income Windfall (land compensation, winning lottery of more than 10 million 3 9 dong, bumper crops for 2 consecutive years, ...) Misfortune of the family has passed for at least 12 months (ill recovery, 3 10 seriously ill member died, overcoming business/ production hazards) Total Score Tableau 2: Quick assessment of household likely to fall into poverty (Non-poor household in original year (e.g 2008), including migrated household, non-poor split/ merged household in the year.) Bad events in 2008 - 2009 Score Main source of income lost due to poor harvest, natural disaster, disease, 8 1 unfortunate in business/ production... and recovery is impossible and lack of support from relatives Breadwinner losing work ability for long term seriously affects household 8 2 income Land sold to cover household member suffering from serious illness for 6 3 months. School-age child/ children dropping out due to the lack of money 4 4 household member involving in drug use, gambling, alcoholism, ... social 4 6 vices Newly split household or newly born child without additional income. 3 7 Bad luck forces the household to sell existing furniture, producion tools 3 8 10.
(11) 9. to buy daily food Other hazards (like losing fortunity...) Total Score. 3. For households in the second list, who have reached the number 10 and more, the village chief will once again review their revenue and their expenditures to determine the annual income of the household. All activities of production in agriculture and non agricultural activities (including the proceeds of sale and consumption), wages and other revenues are revised. The household income is calculated as the balance between revenue and expenditure. Finally the total household income is divided by the number of people in the family and then divided into 12 months. If the household income is 200,000 VND/person/month, one can say that it is poor. There may be recommendations soon from the Institute of Labor Science and Social Affairs (ILSSA) that household which are classified as being „permanently poor‟ due to health or age reasons need not be reassessed annually but included on the poverty list permanently. Once the lists are generated there is a poll conducted by the Village Heads at the village level by way of a show of hands to check that the survey board lists are correct. The poverty lists are then submitted to the Commune People‟s Committee (CPC) for checking and consolidation prior to forwarding it to the District People‟s Committee (DPC), District sub-DOLISA and Provincial (DOLISA) levels. Once the CPC has stamped and signed the poverty lists these are final and are not altered by either DPC or Provincial authorities. These lists are important as they are a means of monitoring those HH that may continue to improve as well as those that for various reasons slide back into poverty. The reliability of the income figures of peasants The question is if the two communes poverty rate reflects the reality of poverty in these communes? In reality, the calculation of families income - particularly rural families -. 11.
(12) is not at all easy. How can you ask a rural family to recall all its revenues and all expenses for one year, and especially if the source of its revenue is diverse and very unstable? For example, there are farmers who have no regular work. Some months they have more or less 15 working days, but there are also months they have any work or sometimes the payment is done in meals. It is then impossible to have a precise figure for the level of income. The people involved in this task should be more competent - more rigorous, they should have a representative core questionnaire of the situation of the villagers, more availability, and a strict methodology to ask questions. Moreover, the calculations are based on the price level existing in the two communes whereas the poverty level of 200.000VND/mois/personne was based on the average price level of all rural areas in Viet Nam. Therefore one can have doubts about the meaning of establishing the poverty situation in the two communes in relation with such an average national threshold of reference. On the other hand, there are always differences between the calculated figures and the figures presented in the official report of the communes. This change seems linked with contradictory pressures which influence the poverty policy of the communal authorities. There are two main reasons. The first one is the so-called "results disease" which point to the tendency of the commune head to decreases the rate of poverty in order to show that its social economic development plan is reached. The other reason is the desire to attract investments and non-governmental organizations with the discourse: "we are still very poor, we need help". And that leads to a tendency to increase the poverty rate higher than the reality. We know that it is probably better to let the municipality officials in charge of the revision of the rate of poverty, because these people know and understand all the details of the daily reality of their commune. However, in the two studied communes, all villages heads do not master the required capabilities to review the situation of poor households. But they. 12.
(13) have the right to decide who are poor and who are not, who are the beneficiaries of the poverty alleviation strategy, and also who will receive grants from the Government. Who needs help? The purpose of poor households identification is to define which people have to be the beneficiaries of the subsidies from the Government. Each commune studied includes more or less 12 villages, each village has its village chief, who is appointed by the vote of the villagers. The village chief has the responsibility to determine who are the poor households, in order to distribute the subsidies from the Government. Households included in the list of poor households of the village enjoy diverse types of aid including a reduction in the cost of study for the children of the household, free health care, and money and rice in the occasion of new year... Households that are not in the list receive nothing. This fact has actually created many problems. Because of the lack of an appropriate framework to tackle the real conditions of poverty, there are many households who are not poor according to the monetary threshold of poverty, but they have very precarious living conditions. These households could get out of their vulnerability in a sustainable way only if the Government and other organizations give them an appropriate aid. It would be better to take in consideration all households which are in a precarious situation. But the latest can not be reduced only to being under a certain monetary threshold which is very elusive, due to the high rate of inflation. If one does continue with the present system, many people look at it as a sort of lottery in which one has to try, by all means, to win „the gifts of God” , and stick after to the “status of poor” which has been won. That is shown by the attitude of households which have already been once subsidized, and who do not want to abandon their “privileged” status.. 13.
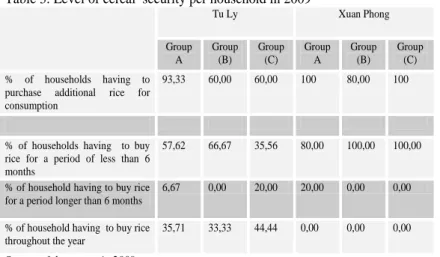
(14) In the following section we try to give some indications of the discrepancy between a poverty line based upon a monetary threshold, and the more general features of precarious conditions of living. In this part, we have taken 3 groups of households to consider their respective ability to meet their needs in their daily lives. They are comparisons between poor households and other groups of households who are not poor - according to the poverty threshold - but who are still very vulnerable. The message from this analysis is that all the three groups A-B-C are different according to the level of monetary income but they have the same problems of food security and deficient access to basic services. First of all, we have observed the cereal self sufficiency capacity of all households. This ability is very important to farmers because most of their revenues come from their agricultural activity. With access to the natural resources of the soil and the forest, farmers can make the most of their food from a kitchen garden and a small farm. They can also glean the wild forest products and cook with local firewood. The problems of food production have since long been seen as the major explanatory cause of hunger. Indeed, access to food for household matches its capabilities in terms of production. This is why the factors such as access to land and the level of production are taken into account in the analysis of the ability of a household to access to food. Table 3 shows the. Table 3: Level of cereal security per household in 2009 Tu Ly Group A. Group (B). Xuan Phong Group (C). Group A. Group (B). Group (C). % of households having to purchase additional rice for consumption. 93,33. 60,00. 60,00. 100. 80,00. 100. % of households having to buy rice for a period of less than 6 months % of household having to buy rice for a period longer than 6 months. 57,62. 66,67. 35,56. 80,00. 100,00. 100,00. 6,67. 0,00. 20,00. 20,00. 0,00. 0,00. % of household having to buy rice throughout the year. 35,71. 33,33. 44,44. 0,00. 0,00. 0,00. ability of different groups of households to reach cereal self-sufficiency. It represents the percentage of households who must purchase rice to meet their consumption needs.. Source of the survey in 2009. 14.
(15) This table presents no major differences between the poor groups with other groups. Households which have to buy rice over all the year are households which have very little cultivated land or have no culture of rice field. Looking at the overall table 3, we see that the rate of household cereal self-sufficiency in the town of Xuan Phong is less than the one of the commune of Tu Ly. The reason is that the amount of land cultivated by households in the municipality of Tu Ly is higher than in the commune of Xuan Phong. According to the households view, especially households of groups A and B, there is a lack of rice during the months of March, April, September and October, since during this period the previous harvest products are almost finished. This is why these households face many difficulties to achieve annual food security. There are two main reasons why households in the two communes must buy rice in supplement. The first reason is that their average land area of rice per household is small. The second reason is a low efficiency of rice production, due to the lack of capital, technology, active workers and soil quality .The categories of food that households can produce are not varied but very simple. Each person eat every day rice, vegetables, and often drink alcohol and tea, but it is not the green tea, but teas from the forest. The frequency of consumption of meat depends on the types of families. Poor families have no money to buy often it, and the Group B and C know also the same problem. Here is the confidence of Mrs.B., (group C), "I go often in the forest to glean vegetables, shoots of bamboo for food." We eat pork meat and fish about 5 times per month. Vegetables are the only food I have not to buy in the market. Sometimes, there are weeks where we have no meat to eat. When we have no more rice, I borrow approximately 5 kgs, which is enough for 2 days. And then I have to go in the forest to gather wood, medicinal plants or bamboo to sell for getting some money. But we are no more considered as poor. 15.
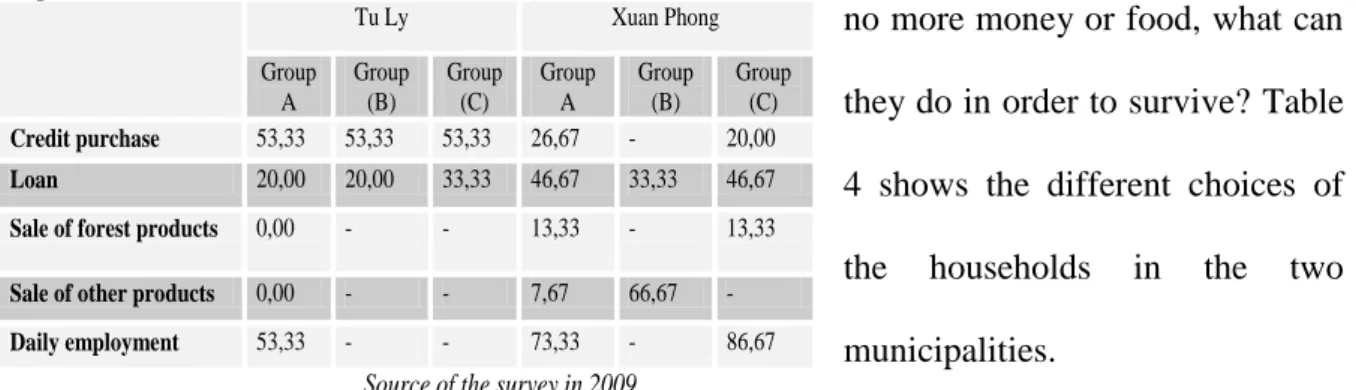
(16) people. There are many poor families who have their meals richer than ours, why are we no more in the category of "poor"? "Personally I don't know" Such an opinion does show that food self-sufficiency is very important for poor households, even more important than the monetary threshold, to define their situation of poverty. Instead of spending his money to buy food, a household want to save its very limited cash to invest in another production (corn or sugar cane). In the case households have. Table 4: Choice of households when their regular income is not sufficient to purchase food Tu Ly. no more money or food, what can. Xuan Phong. Credit purchase. Group A 53,33. Group (B) 53,33. Group (C) 53,33. Group A 26,67. Loan. 20,00. 20,00. 33,33. Sale of forest products. 0,00. -. Sale of other products. 0,00. Daily employment. 53,33. Group (B). they do in order to survive? Table. -. Group (C) 20,00. 46,67. 33,33. 46,67. 4 shows the different choices of. -. 13,33. -. 13,33. -. -. 7,67. 66,67. -. -. -. 73,33. -. 86,67. the. households. in. the. two. municipalities.. Source of the survey in 2009. Most people choose to buy their food on credit because the trust still exists between the seller (the store) and the buyer can feed himself and pay off only a few weeks later – a period of one to four weeks. In fact in these two communes, there is no communal market. There is only small private stores. All the people know each other. Small merchants say "most people here are such, that if you are not selling on credit, nobody comes to purchase”. Few families in the three groups A-B-C have the opportunity to produce more than what they eat and therefore are not able to sell a surplus. A low rate of households, concentrated in the commune of Xuan Phong, go into the forest to gather non-wood products. A high percentage of households prefer to search daily employment in the municipality. This rate is higher in Xuan Phong commune than in Tu Ly. In the commune of Tu Ly, they are no household in the first three groups, which have agricultural products to sell. However, in the commune of Xuan Phong, as people go more. 16.
(17) often to the forest and gather non-wood products, they can exchange their products and thus buy food and pay off their credit. In summary, through the comparison between the poor and non-poor households (according to the threshold of poverty ), we see that all the three groups of households A-B-C have the same problem of food security and low living level, and therefore they are all vulnerable. Consequently to choose only the group of beneficiaries on basis of the poverty threshold, to give aid, is not appropriate. However, when the threshold of poverty changes in 2011, all the three groups in the studies (A, B, C) are again recognized as poor household who deserve aid. From 2011 on, households in Group B and C may become also the beneficiaries of the program to combat poverty. That means that the lot of vulnerable people depends too much of the vagaries of macro-statistics which define an abstract level of monetary poverty. Often the latest is far from the realities of the vulnerability they endure. That means also that the roots of vulnerability are not taken in an efficient way. What is the point of view of the villagers? After asking the peasants to give me their opinion to describe the differences between today poor families and those of before, here is what some have said to me: Mr Xa, Chau village, commune Tu Ly: " previously, poverty was synonymous with famine, and the poor family was a family which had nothing, neither money nor goods." The poor family could not borrow to anybody since everyone was in the same situation. Now, a family is poor but is not hungry, she still has means of production and may borrow to somebody else in case of necessity. Moreover a poor family can rely upon what the Government or other organizations can give. "In summary, the poor family of before had more difficulty than the poor family of today. According to him, there are many reasons why a family is poor. In first instance one has the lack of land to cultivate or / and the lack of active workers. Another reason is that the. 17.
(18) family has many children or members who are frequently sick, or many disabled and elderly people, so the revenues are minimal whereas the spending is high. An other reason is that the active workers are lazy. According to him, families who are in the second case, still have the opportunity to get out of poverty when their children grow up or disease is cured. The last example is a more difficult situation because the families do not have the courage to leave poverty by themselves. According to Ms. Bui Thi, head of the association of the Union of women of the commune of Xuan Phong: " previously, when the Government had not yet set the poverty line, we analyzed ourselves the situation of each household via the opinion of the villagers. For example, there were 30 households in the village, and each family named on the list which households met the criteria of poverty based on their personal observation and their daily lives with each other. If a family had 80-100% of votes, it meant that it was a poor family ." According to her, today, poor households are taken in consideration in the directives of the Government and organizations. That is why they have received a lot of help. On the contrary before poor families had nothing. She thinks that instead of helping only these families that are named "poor" according to the criteria of the “poverty threshold”, one should focus also on families that are not poor but who need to get out of their precarious situation. Today, the poverty assessment of the villagers is based upon their observation of the way of life of everyone in comparing the families within their environment. This assessment can be not just as one plus one equals two, but it reflects the current reality. The villagers know the families who need cakes and those who need materials to make cakes. For those who need cakes, there is no easy solution to get out of poverty, but in the other case, there are opportunities if they get help. This can be a base to decide the type of assistance for each. 18.
(19) case. It is necessary to have a type of association which could represent the villagers to monitor their current problems in daily life and in production, and which could inform properly the local government. 3.3 Recommendation for the improvement of the role of peasants and women associations to ensure social security In the new context of economic development of the country, small farmers, especially the peasants in mountainous regions, must change in order to better adapt to the new environment. This adaptation is not only made through a diversification of agricultural and non-agricultural activities in their rural areas to diversify their sources of income. More and more they have to migrate outside their region to go to the city and become a migrant worker. In the two communes studied here, there is already a decentralization of poverty monitoring and of programs against poverty management which allows to better target beneficiaries. Thanks to it, the local administrator could be better informed on the members of the community, and therefore be better placed to identify the poor households in a more effective manner. However the method used by the MOLISA to determine poor households has created problems, because the system uses only the level of household income to classify the categories of villagers. Due to insufficient elements to calculate the national poverty line, a part of village groups are not included in the list of beneficiaries but are actually very vulnerable and need help. These are households that are not poor, according to the criteria set, but which would be listed as poor households in the situation of recession economic, crop failures, or after a period of floods Which are the conditions for the success of the decentralization of poverty monitoring? In our recommendation we look at the question of how to make decentralization work for households in need of social protection. Devolution appears to be an effective solution because it involves the transfer of powers to an institution or a local association with. 19.
(20) autonomy, legal personality and representation. This form of decentralization needs to be accompanied by mechanisms for popular participation in the process of decision-making that take place at the village level. In the two municipalities studied here, there are already farmers associations and women associations who work at the request and according to the interests of all participants. These associations are social organizations that have the leadership, knowledge and skills to manage all tasks, and obviously have their own rule and may act under the control of local government. These are organizations that are responsible for the execution of all what concerns the projects supporting poor households. However they do not have the right to choose the beneficiaries because the latter are already named in the list based upon the criteria of the national poverty line. On the other hand, all policies fighting poverty and other policies have documents that explain clearly all mandatory steps to follow, but are the same for all regions and do not take into account the specific characters of each region. Local government and associations do not have the right to change anything. Indeed, the budget of local government and associations depends on the central Government. The result is that the decision by an association or a local government is always a passive act. This does never create effective results! If strategies for poverty reduction have to provide concrete results, it is preferable: -. to leave the community, in particular associations of peasants and women who are responsible for the villagers, take the decisions to choose the recipients best suited to each type of project to fight poverty.. -. to increase the power of action of the associations and allow them to be more active in determining activities and concrete criteria for a better monitoring of households. Devolution is already made but it is stuck half way, due to a lack of. 20.
(21) autonomy to be able to use the different resources needed to implement their own projects to aid the poor.. [1]. The University of Agronomy in Ha Noi The University of Lièger, Agro Biotech GemBloux [3] The University of Agronomy in Ha Noi [2]. [4] According to the Regulation 170 CP of the Government which was promulgated on 8 July 2005: for rural areas,. households are considered as poor if the average income is below 200.000VND/person/month (11,25 USD) or 2.400.000VND/person/year (134,83 USD). For urban areas, poor households have incomes of less than 260.000VND/person/month (14, 61USD) or 3.120.000VND/person/ year (175,28 USD). 21.
(22)
Figure
Documents relatifs
douce lumière quant tout est obscur.Il vit avec ma maladie comme si ce n’avait été qu’un contre-temps dans ma vie ou encore une rumeur ne pouvant. exister.Il me fait
few shareholders exchange, as in the first scenario, then an individual receives the expected takeover benefits regardless of the exchange decision. Similarly, if many
Secondly, the distribution of costs and benefits between the farmers and the traders along the chains (incomes have been estimated by adding monetary incomes and the
With longer and colder winters, the northern region is characterized by a per capita rural energy consumption level that is 33% higher than in the southern region (Zhou et
Owing to the direct precipitation of the samples as hydrated mixed oxides, on the one hand, and to the loss of reactivity observed upon heating, particularly through the drastic drop
(a) The reference map (300 " 300 pixels) employed to produce original 4 (f)); (b) the generated SR-map using degraded image with a scale factor of 10 (see Figures 4 (g) or (h))
Numismatics is a field of research for which current search engines are of a very limited use (with an exception, to handle with caution, for Publish or Perish). It may be
Not convinced by the topical promises of urban reform, and that are captured in neoliberal development plans such as Kenya Vision 2030 and its proliferating spatial
