HAL Id: hal-02349690
https://hal.archives-ouvertes.fr/hal-02349690
Submitted on 7 Nov 2019
HAL is a multi-disciplinary open access archive for the deposit and dissemination of sci-entific research documents, whether they are pub-lished or not. The documents may come from teaching and research institutions in France or abroad, or from public or private research centers.
L’archive ouverte pluridisciplinaire HAL, est destinée au dépôt et à la diffusion de documents scientifiques de niveau recherche, publiés ou non, émanant des établissements d’enseignement et de recherche français ou étrangers, des laboratoires publics ou privés.
Distributed under a Creative Commons Attribution| 4.0 International License
New insight on early oxidation stages of austenitic
stainless steel from in situ XPS analysis on
single-crystalline Fe–18Cr–13Ni
Li Ma, Frédéric Wiame, Vincent Maurice, Philippe Marcus
To cite this version:
Li Ma, Frédéric Wiame, Vincent Maurice, Philippe Marcus. New insight on early oxidation stages of austenitic stainless steel from in situ XPS analysis on single-crystalline Fe–18Cr–13Ni. Corrosion Science, Elsevier, 2018, 140, pp.205-216. �10.1016/j.corsci.2018.06.001�. �hal-02349690�
New insight on early oxidation stages of austenitic stainless steel
from in situ XPS analysis on single-crystalline Fe-18Cr-13Ni
Li Ma, Fr´ed´eric Wiame, Vincent Maurice∗, Philippe Marcus
PSL Research University, CNRS-Chimie ParisTech, Institut de Recherche de Chimie Paris (IRCP), Research Group of Physical Chemistry of Surfaces, 75005 Paris, France
Abstract
In situ X-ray photoelectron spectroscopy real-time measurements and angular-dependent high resolution core level analysis were used for the first time to investigate the Cr enrichment and oxide growth mechanisms on a model 304 austenitic stainless steel surface in the very initial stages of oxidation leading to pre-passivation. The oxidation kinetics was followed for increasing oxygen exposure and temperature, revealing an early nucleation regime (for exposure < 10 L) leading to the formation of a strongly Cr-enriched Cr3+/Fe3+ mixed layer followed by an oxide growth regime where preferential iron oxidation takes over and mitigate the initial chromium enrichment.
Keywords: In situ X-ray photoelectron spectroscopy (XPS); stainless steel; single crystal
surface; oxidation kinetics; Cr enrichment; growth mechanism
1. Introduction
Stainless steels (FeCr-based alloys) are widely used because of their high corrosion resis-tance resulting from the formation of a continuous and protective surface oxide layer, the passive film. Numerous surface analytical studies have shown that the passive film is only a few nanometers thick and markedly enriched in Cr(III) oxide/hydroxide species [1–13]. Re-cently, it has been suggested from nanometer scale studies on austenitic stainless steels that
∗Corresponding author
Email addresses: li.ma@chimieparistech.psl.eu (Li Ma), frederic.wiame@chimieparistech.psl.eu (Fr´ed´eric Wiame), vincent.maurice@chimieparistech.psl.eu (Vincent Maurice), philippe.marcus@chimieparistech.psl.eu (Philippe Marcus) Paper accepted to Corrosion Science
the Cr enrichment, which is the key factor for the corrosion resistance, may not be homoge-neous in the oxide film [14, 15]. The pre-passivation mechanism by which the native oxide is initially formed most often in air may produce enrichment heterogeneities at the origin of the failure of the corrosion resistance by initiation of localized corrosion. Thus it appears essential to thoroughly investigate the initial stages of oxidation (i.e. pre-passivation) of the alloy surface under well-controlled temperature and exposure conditions, as well as the mechanisms governing the Cr enrichment.
Most studies [16–22] on the initial oxidation of pure iron and based alloys (mostly Fe-Cr alloys) have been carried out with a surface science approach in ultra-high vacuum (UHV) conditions, because it provides a maximal control of surface state and oxidation conditions which are key factors to surface reactivity and growth mechanism studies of ultra-thin oxide films. Polycrystalline alloys for practical applications were investigated despite the fact that single crystal surfaces enable a deeper insight to the surface composition and to the oxide formation process since limiting the complexity brought by dissimilar crystallographic orientations, grain boundaries, second phase particles and impurities. Only very few studies have been conducted on stainless steel single crystals [4, 15, 20, 23, 24].
X-ray Photoelectron Spectroscopy (XPS) is commonly applied to analyze surface chemi-cal states and composition. Numerous XPS analyses provided chemichemi-cal states references on Cr, Fe and Ni metals, as well as their various oxides [4, 5, 15, 23, 25–33]. For the alloy surface composition, it was concluded from previous works focused on the proportion of formed Cr oxides and Fe oxides that the formation of Cr oxides is thermodynamically favored while that of Fe oxides is kinetically controlled [34, 35]. The stratification of oxide films can be analyzed by angle-resolved XPS (ARXPS). For example, Castle et al. [31] have determined the in-depth distribution of oxides species according to a surface model determined from ARXPS measurements. However, there is almost no stratification analysis of surface region during the very first stages of oxidation.
Previous studies have also shown that oxidation temperature and oxygen exposure are two key factors for the oxidation rate, surface composition and oxides structure [16, 19, 20, 22, 36]. Most previous works were carried out at room temperature (RT) [16, 17, 24, 37]
and around 300◦C [20, 22, 37], the latter because of its industrial relevance. However, no oxidation study of Fe-Cr-Ni alloys was conducted systematically at different temperatures.
Regarding oxygen exposure, experiments were carried out at values larger than 1 000 L
(1 L = 1.33×10⁻⁶mbar·s), under oxygen pressure usually higher than 10−6 mbar. According
to our kinetics data presented hereafter, this is far beyond the initial stages of oxidation, defined as the range of exposure for which the surface varies the most. The understanding of the mechanisms of oxide growth and Cr enrichment in the initial stages of oxidation is essential to understand the structure and properties of ultra-thin oxide films. However, to the best of our knowledge, there was no investigation of Fe-Cr-Ni alloy surfaces during and/or after very low oxygen exposure (< 100 L), neither of the mechanism of ultra-thin oxide film formation.
Nitrogen segregation has been observed in some studies performed on N-containing stain-less steel [22, 38–40] and resulted in the formation of surface chromium nitride compounds. It was deduced by some authors that the co-segregation of chromium with nitrogen could increase the proportion of surface chromium oxides [41].
Here, we bring new insight on the oxidation kinetics and evolution of the surface com-position and stratification during the initial oxidation of austenitic stainless steel. Nitrogen segregation is also discussed. The study was performed by in situ XPS on a (100)-oriented Fe-18Cr-13Ni single crystal (a model of the most common 304 grade of austenitic stain-less steel) during the initial stages of oxygen exposure (< 100 L) at RT, 150◦C and 250◦C. The work is aimed at providing new comprehensive knowledge for the surface treatments of Fe-Cr-Ni alloys for improved resistance to initiation of localized corrosion of stainless steel.
2. Experimental
Firstly, the clean surface and nitrogen segregation were characterized. Then, the evolu-tion of the oxygen uptake during oxygen exposure was monitored in situ to determine the oxidation kinetics. For that purpose, a novel specific XPS acquisition mode was adopted to record the real-time evolution of the photoelectron spectra during oxidation. In this way,
the continuity of signal variation was achieved which strengthened greatly the kinetics mon-itoring. Afterwards, oxidation was conducted at exposures selected according to the kinetics data. The high resolution spectra were decomposed in order to determine the chemical states and their proportions. Based on angle-resolved data, oxide models were proposed to discuss the surface composition and stratification, as well as the thickness and formation mechanism of the oxide films and their Cr enrichment. A complementary Scanning Tun-neling Microscopy (STM) study of the local topographical and structural alterations of the surface brought by initial oxidation will be reported separately [42].
The experiments were performed in a multi-chamber UHV system including a preparation chamber and two analysis chambers (XPS chamber and STM chamber), maintaining a base
pressure < 10−10mbar. The preparation chamber is equipped with an Ar+ cold cathode ion
gun for sputtering and resistive heating filament for annealing. Samples are heated from back side and temperature is controlled through a thermocouple attached on the manipulator in contact with the sample.
A (100)-oriented Fe-18Cr-13Ni single crystal with 99.999% purity was used. The sample was mechanically and electrochemically polished before introduction in the UHV system (procedure described elsewhere [23]). After introduction, the sample surface was cleaned by
cycles of Ar+ ion sputtering (1 kV, 10 µA, 10 minutes) and annealing (700◦C, 10 minutes)
in the preparation chamber. Sputtering and annealing cycles were applied between each oxidation experiment. The chemical and structural quality of the surface were controlled by XPS and low energy electron diffraction (LEED), respectively.
Gaseous oxygen (99.999% purity) was introduced via a leak valve directly connected to the preparation chamber or via an oxidation cell installed in the XPS analysis chamber. XPS analysis was conducted with the Argus spectrometer, using the monochromatic XM1000 Mkll Al Kα X-ray source (1486.6 eV) both from Scienta Omicron. The Argus detector with 128 channels has a high spatial resolution and a high counting rate that allow to record electron spectra over short time period. The in situ XPS investigations were carried out using the Snapshot detection mode, recording a spectrum every 10 seconds in real-time monitoring during oxidation. Thousands of spectra were recorded to describe the variation
of oxygen (or nitrogen) peak intensity during oxidation (or annealing). Most of oxidation
treatments were carried out at RT, 150◦C and 250◦C with O2 pressure ≤ 10−8 mbar. Such
low oxygen pressure was kept in order to monitor the 0–100 L exposure range with good
precision. The pressure in the chamber was continuously recorded and the exposure to O2
was calculated from the integration of oxygen pressure as a function of oxidation time. According to the in situ kinetics data, series of oxidations under very low oxygen expo-sures were carried out for detailed chemical analysis of the surface evolution. Survey and high resolution spectra of Fe 2p, Cr 2p, Ni 2p, O 1s, N 1s and C 1s core levels were recorded after each oxidation treatment, with constant pass energy of 50 eV and 20 eV, respectively.
Both take-off angles of 45◦ and 90◦ were studied in order to determine the distribution of
species along the direction normal to the surface. All obtained XPS spectra were referenced to the Fermi edge. Three exposures less than 10 L and nine exposures above were chosen for decomposition analyses. More than 400 high-resolution spectra were recorded and analyzed
in this work. After exposure to about 300 L at 250◦C, no more significant change in the
substrate signal was observed.
Data analyses were performed using the CasaXPS software (Version 2.3.17) [43]. For reconstruction of the high resolution spectra, several constraints were considered to achieve accuracy and consistency.
The width of analyzed regions was carefully adjusted to ensure a suitable background contribution. For Fe and Cr, the 2p core levels were fitted by adjusting the intensity ratio
between 2p3/2 and 2p1/2 components to values matching the theoretical ratio. For nickel, as
there was no overlapping between the 2p3/2 (852.8 eV) and 2p1/2 (869.6 eV) peaks, only Ni
2p3/2 was considered. In order to improve the accuracy of the quantitative determination,
only the 2p3/2data were used to calculate the concentration and to establish the oxide model
as 2p1/2 components have larger uncertainties.
Background subtraction methods can influence the quantitative values of Fe and Cr chemical states concentrations [25, 31, 44, 45]. It was found that the chemical states propor-tions extracted by using different background subtraction can vary by ±5% for iron oxide and ±3% for chromium oxide [25]. To minimize the effect of background subtraction on
components concentration, an adjustable Shirley background [46] was adopted for our peak fitting.
A Lorentzian asymmetric line shape, with the same asymptotic behavior as Doniach-ˇ
Sunji´c component [47], convoluted by a Gaussian shape was used for fitting the metallic
component peaks. The indexes of asymmetry follow the order: metal > oxide > satellite ≈ 0. A simple product of Gaussian and Lorentzian line shapes was used for the non-metallic components.
Binding energy (BE) and full width at half maximum (FWHM) are two important param-eters affecting the reconstruction of the synthetic curve shape. Although metal compounds states have been largely studied by XPS [25–31, 35], BE and FWHM can be different ac-cording to the used sample and spectrometer. There are few data in the literature about
the BE position of 2p1/2 core level peaks and shake-up satellite peaks. As for FWHM, it
depends on the chemical environment. Normally, the FWHM values of the different peaks follow the order: satellite > oxide(nitride) > metal and 2p1/2 > 2p3/2.
Once the fitting parameters were determined, they were fixed for all the high-resolution
spectra recorded at take-off angles of 45◦and 90◦. Only the relative peak intensities were
treated as the variable for peak fitting.
3. Results and discussion 3.1. XPS fitting parameters
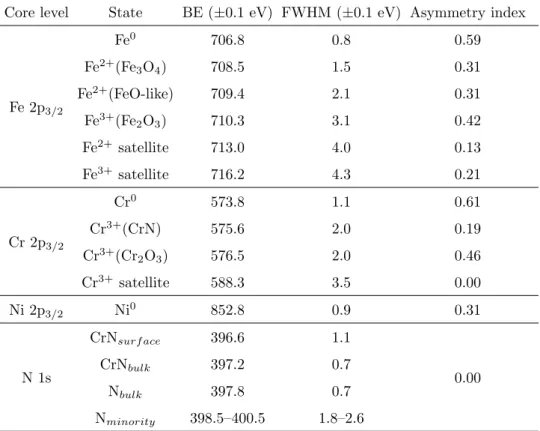
Table 1 compiles the fitting parameters determined from the XPS spectra reconstruction. They are consistent with typical values found in other works [25, 28, 29]. The chemical shifts
of the different Fe oxides with respect to Fe0 metal are 1.7 eV, 2.6 eV and 3.5 eV for the
components assigned to Fe2+(in Fe
3O4 matrix), Fe2+(in FeO-like matrix) and Fe3+(in Fe2O3 matrix), respectively. Spin orbit splitting is 13.1 eV between the Fe 2p3/2 and Fe 2p1/2 main
peaks and 13.5 eV between the Fe 2p3/2 and Fe 2p1/2 shake-up satellite peaks, which is close
to the values from recent studies [25, 26, 28, 31, 35]. BE separations between the Fe 2p3/2
Table 1 Fitting parameters obtained by reconstruction of the XPS core level spectra
Core level State BE (±0.1 eV) FWHM (±0.1 eV) Asymmetry index
Fe 2p3/2 Fe0 706.8 0.8 0.59 Fe2+(Fe3O4) 708.5 1.5 0.31 Fe2+(FeO-like) 709.4 2.1 0.31 Fe3+(Fe2O3) 710.3 3.1 0.42 Fe2+ satellite 713.0 4.0 0.13 Fe3+ satellite 716.2 4.3 0.21 Cr 2p3/2 Cr0 573.8 1.1 0.61 Cr3+(CrN) 575.6 2.0 0.19 Cr3+(Cr2O3) 576.5 2.0 0.46 Cr3+ satellite 588.3 3.5 0.00 Ni 2p3/2 Ni0 852.8 0.9 0.31 N 1s CrNsurf ace 396.6 1.1 0.00 CrNbulk 397.2 0.7 Nbulk 397.8 0.7 Nminority 398.5–400.5 1.8–2.6
This is 1–2 eV smaller than for pure Fe3O4 and Fe2O3 oxide samples like pointed out by
Aronniemi et al. [25].
For chromium, the chemical shift is 1.8 eV for Cr3+(CrN) and 2.7 eV for Cr3+ oxide
(Cr2O3). These values are of the order reported in the literature [5, 25, 27, 28, 30].
Spin-orbit splitting between the Cr 2p3/2 and Cr 2p1/2 peaks are 9.4 eV, 9.5 eV, 9.6 eV and
9.0 eV for Cr0, Cr3+(CrN), Cr3+(Cr
2O3) and Cr shake-up satellite peaks, respectively. BE separation for Cr satellite peak is 14.5 eV which is 2–3 eV smaller than reported from a Cr 2p curve fitting study of a pure Cr2O3 powder sample [25].
The 2p3/2 and 2p1/2 doublet intensity ratios for Fe and Cr vary from 0.49 to 0.52, which
is close to the theoretical value of 0.5.
As for the FWHM, compared to the metallic peaks, it is confirmed that the oxide peaks are wider. Satellite peaks have larger FWHM values in the range about 3.5–4.3 eV due to the strong overlap with the main peaks and the background. The metallic peaks contribute
a lot to the asymmetry of the spectra.
3.2. Clean surface characterization and nitrogen segregation
After Ar+ sputtering the alloy surface, only the Fe 2p, Cr 2p and Ni 2p core levels were
identified indicating the absence of contaminants. No carbon or nitrogen were detected. It proves that the nominal amounts of these elements are below the detection limit of the XPS (< 0.5 at%). The surface composition (at%) was determined as 75Fe-15Cr-10Ni, depleted in Cr at the surface compared to the nominal bulk value (69Fe-18Cr-13Ni). However, after
annealing at 700◦C for 10 minutes, a N 1s feature appeared at around 397.2 eV, indicating
that nitrogen, below the detection limit after sputtering, segregated on the surface upon thermal treatment. The details of the Fe 2p, Cr 2p, Ni 2p and N 1s spectra are discussed in Section 3.4. The composition of the surface obtained after annealing was (at%) 54Fe-29Cr-9Ni with 8 at% N. It should be noted that these composition values were deduced from quantitative analysis of the XPS spectra assuming an identical surface distribution for all elements. Their relative changes evidence that Cr and N segregate at the surface upon annealing. The form under which these elements segregate will be discussed in section 3.4.
Fig. 1 depicts the real-time segregation of nitrogen at the surface as illustrated by the plot of the normalized area of N 1s peak versus annealing time (Fig. 1 (a)) and the variation of the segregation rate as a function of annealing temperature (Fig. 1 (b)). The data were acquired in three successive experiments (as seen from the two discontinuities in the plots) using the XPS Snapshot mode.
Fig. 1 (a) shows that the nitrogen intensity markedly increases from 400–500◦C and
reaches saturation at about 680◦C, which is in agreement with surface segregation of nitrogen
reported after annealing a Fe-Cr alloy at 527◦C [22]. When the temperature exceeds about
680◦C, the N surface concentration remains unchanged. Compared to the surface annealed
at 700◦C during 10 min, the surface saturated at 680◦C has the same amount of nitrogen.
Fig. 1 (b) provides more details on the variation of the nitrogen surface uptake. It shows that the segregation rate, as given by dNdt, the derivative of the normalized area of the N 1s
N o rm al iz ed N 1 s in te n si ty ( a. u .) 0 0.4 0.8 1.2 T em p er at u re ( ℃ ) 0 100 200 300 400 500 600 700 Time (h) 0 1 2 3 4 Temperature Normalized N 1s intensity (a) d N 1 s( sm o o th ed )/ d t (a .u .) −1×10⁻⁴ 0 1×10⁻⁴ 2×10⁻⁴ 3×10⁻⁴ 4×10⁻⁴ Temperature (℃) 0 100 200 300 400 500 600 700 dN 1s/dt Fitting curve (b)
Fig. 1. Real-time nitrogen segregation on Fe-18Cr-13Ni(100) as measured by XPS in Snapshot mode upon annealing the sputter-cleaned surface: (a) variation of normalized N 1s intensity, (b) nitrogen segregation rate and fitting curve (see text for details).
about 620◦C before dropping quickly to zero after surface saturation at 680◦C, showing that nitrogen segregation depends effectively on temperature. Since nitrogen starts to segregate at 400◦C, it is nearly impossible to prepare an annealed and well-structured metallic surface that is nitrogen-free. As shown in Fig. 1 (b), the nitrogen segregation kinetics plot can be fitted by the following equation:
dN
dt = A exp
−E
kT (1)
where k is the Boltzmann constant and E the activation energy for N segregation. The fitted value of E is 72±5 kJ/mol. This is less than the value found for N segregation in a ferritic Fe-Mo alloy [48]. The N saturation of the oxide-free surface would therefore be easier to achieve in our case of an austenitic alloy.
Previous studies have discussed the influence of nitrogen on oxidation and wet corrosion of stainless steel [5, 22, 38, 40, 41]. It was reported that Cr and N co-segregate at the surface, as confirmed in the present work, which may promote the selective oxidation of metallic Cr enriched at the co-segregated surface. Cr and N co-segregate in the form of chromium nitride compounds [22, 40, 41], which is discussed in the following.
3.3. Surface oxidation kinetics
In order to determine the influence of oxygen pressure and temperature during the initial
oxidation of the Fe-18Cr-13Ni(100) surface, oxidation runs were performed at RT, 150◦C and
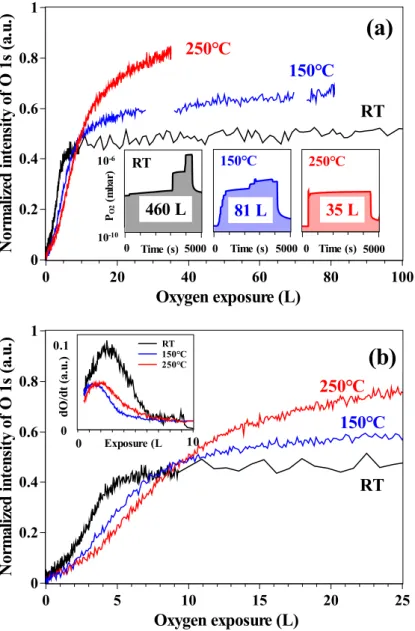
250◦C at different oxygen pressures on the sample surface pre-annealed at 700◦C. Fig. 2
presents the evolution of the normalized O 1s peak area at these three temperatures as a
function of O2 exposure (100 L) as measured in real-time by in situ XPS. Fig. 2 (b) enlarges
the region of the first 25 L of exposure. This is the first observation of oxidation kinetics at the very early stage. In previous studies, oxidation experiments of iron or stainless steel were carried out at PO2 > 10
−6 mbar [20, 21, 24, 39, 49]. At these pressures, the detailed
information on oxide film growth in the very first stages is lost. This is why our study was
limited to 10−8 mbar for low exposures (< 100 L) and did not exceed 10−6 mbar for larger
N
o
rm
al
iz
ed
i
n
te
n
si
ty
o
f
O
1
s
(a
.u
.)
0 0.2 0.4 0.6 0.8 1Oxygen exposure (L)
0 20 40 60 80 100RT
250℃
150℃
(a)
N
o
rm
al
iz
ed
i
n
te
n
si
ty
o
f
O
1
s
(a
.u
.)
0 0.2 0.4 0.6 0.8 1Oxygen exposure (L)
0 5 10 15 20 25(b)
250℃
150℃
RT
0 Time (s) 5000 Time (s) RT460 L
10-10 10-6 PO 2 ( m b a r) 0 5000 0 5000 250℃ Time (s) 250℃35 L
0 5000 0 5000 150℃ Time (s) 150℃81 L
0 Time (s) 5000 0 1 2 3 4 5 6 7 8 9 10 d O /d t (a .u .) 0 0.1 Exposure (L) RT 150℃ 250℃ 0Fig. 2. Real-time oxygen uptake on Fe-18Cr-13Ni(100) as measured by XPS in Snapshot mode during oxidation: (a) normalized intensity of O 1s as a function of O2exposure in the 0–100 L range, (b) enlarged 0–25 L range. The time variation of the oxygen pressure is inserted in (a). The variation of oxidation rate with exposure is inserted in (b).
the kinetic curves recorded at RT and 150◦C, the change of oxygen pressure is concluded to have no apparent influence on the oxidation kinetics in the conditions tested.
At a fixed temperature, the O 1s intensity first increases rapidly before slowing down and leveling. At RT, the oxygen uptake reaches saturation when oxygen exposure exceeds
10 L (Fig. 2 (b)). At 150◦C or 250◦C, the oxygen uptake is reduced after exposure to 20 L
(Fig. 2 (a)), but no oxidation saturation is observed upon oxygen exposure up to 81 L and to 35 L, respectively. The inset in Fig. 2 (b) presents the oxygen uptake rate (dOdt) recorded in situ in the 0–10 L exposure range at the three temperatures. It shows that the oxidation rate reaches a maximum at 2–3 L exposure and then decreases to stabilize to around zero at 10 L at RT. At 150◦C and 250◦C, a slow oxidation rate is still observed after 10 L exposure. As evidenced in Fig. 2 (b), as the temperature increases, the initial oxygen uptake is reduced. This is consistent with the decrease of the physical adsorption time (Arrhenius law) with, as a consequence, the decrease of the reaction rate at very low exposure (< 10 L). At RT, a component was detected at 531.4 eV BE in the O 1s region, close to the value attributed to adsorbed molecular oxygen [50]. This component, distinct from the oxide
component peaks, was not observed in the spectra obtained at 150 and 250◦C (Fig. S1 in
supplementary data). This is consistent with the initial reduction of the sticking coefficient at these temperatures. In contrast, Fig. 2 (b) shows that for exposures larger than 10 L, the oxygen uptake and its saturation level increase at higher temperature. This is consistent with higher temperature promoting atomic displacement at the surface and/or atomic transport between surface and sub-surface of the sample, thus resulting in the formation of more surface oxide by oxide growth.
Studies reported in the literature were carried out at 10−6 mbar or higher pressure
for exposures larger than 1 000 L [20, 21, 24], overlooking the initial stages of oxidation. Oxidation saturation was also observed by XPS on Fe(111) as recently reported by Davies et al. [21]. It was found that surface oxygen saturates after an oxygen exposure of about 100
L at 280 K (under PO2 ≈ 10
−6 mbar), whereas about 10 L are required to reach saturation
on our alloy surface at RT. On Fe(111), the rate of oxygen uptake was almost the same at 280 K and 500 K, but the oxygen coverage reached at 500 K is higher [21] in agreement with
the increasing saturation level measured at 150◦C and 250◦C in the present work.
Thus, it is shown by in situ XPS analysis of the initial stages of the Fe-18Cr-13Ni surface oxidation that there is no apparent effects of oxygen pressure on the oxidation kinetics in the tested pressure range (< 10−6 mbar) and that the effects of temperature are different depending on oxygen exposure. The exposure of about 10 L can be estimated as the threshold below which the oxidation rate would be essentially limited by the sticking coefficient suggesting a nucleation phase reaching saturation at this exposure. Beyond 10 L, atomic displacement and/or transport would become rate limiting suggesting that the oxidation process has entered the growth phase leading to the increase of the surface oxide formation with increasing temperature.
3.4. Surface composition and oxidation mechanisms 3.4.1. Surface species and their evolution
XPS high resolution core level analysis was performed at 45◦ and 90◦ take-off angles after cumulative exposure of the surface to oxygen in order to characterize the surface species and their evolution, as well as to quantify the surface composition. Based on the oxidation kinetics data presented above, the exposure series were of 0 L, 0.5 L, 3 L, 6 L, 9 L and 14
L at RT. At 150 and 250◦C, they were of 0 L, 3 L, 6 L, 9 L and 15 L, complemented with
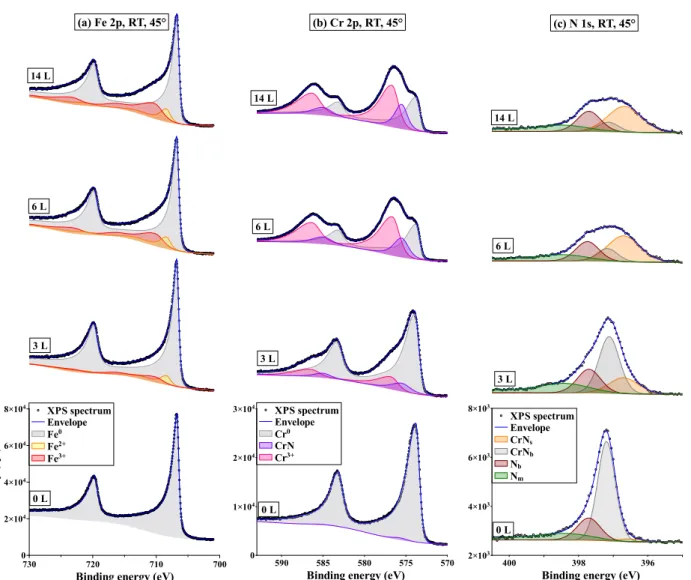
series at 21 L, 35/37 L, 49/51 L, 76 L, 102/106 L, 221/224 L and 328/346 L. No carbon contamination was detected. The reconstruction of all Fe 2p, Cr 2p and N 1s spectra (more than 300 spectra) was performed using the fitting parameters compiled in Table 1. Fig. 3
shows the reconstruction of Fe 2p, Cr 2p and N 1s spectra measured at 45◦ take-off angle
after exposures of 0 L, 3 L, 6 L and 14 L at RT.
For the sake of clarity, the main peaks and satellites have been summed up for each
oxidation state of Fe and Cr. The Fe2+ and Fe3+ components were identified based on the
spectra obtained at higher temperature where they are more prominent. Comparatively, the evolution of the Cr 2p spectra was more marked at RT (as seen on Fig. 3), enabling the
Cr3+ oxide and nitride components to be better identified.
The spectra presented in Fig. 3 show that the main cations in the surface oxide grown 13
(a) Fe 2p, RT, 45° 14 L 6 L 3 L XPS spectrum Envelope Fe0 Fe2+ Fe3+ In te n si ty ( cp s) 0 2×10⁴ 4×10⁴ 6×10⁴ 8×10⁴
Binding energy (eV)
730 720 710 700 XPS spectrum Envelope Fe metal 0 L (b) Cr 2p, RT, 45° 14 L 6 L 3 L XPS spectrum Envelope Cr0 CrN Cr3+ 0 1×10⁴ 2×10⁴ 3×10⁴
Binding energy (eV)
590 585 580 575 570 0 L (c) N 1s, RT, 45° 14 L 6 L 3 L 2×10³ 4×10³ 6×10³ 8×10³
Binding energy (eV)
400 398 396 CPS XPS spectrum Envelope CrNs CrNb Nb Nm 0 L
Fig. 3. Reconstruction of the XPS (a) Fe 2p, (b) Cr 2p, (c) N 1s core level regions for Fe-18Cr-13Ni(100) exposed to oxygen from 0 to 14 L at RT (take-off angle 45◦). The Fe and Cr components are the sum of the main peaks and their satellites. Each component is represented by a colored and shaded area; the envelope indicates the sum of all component peaks; the dots represent the measured spectra.
at RT are Cr3+, Fe2+ and Fe3+. No oxidized nickel (Ni2+) was observed after oxidation since
only a single metallic Ni 2p3/2 component was measured at 852.8 eV BE in agreement with
previous studies [20, 23, 24]. Four nitrogen component peaks assigned to CrNb, CrNs, Nb
and Nm (CrNsurf ace, CrNbulk, Nbulk and Nminority in Table 1) were also distinguished before and after oxygen exposure. For all core levels, there are no significant differences between the spectra at 6 L and 14 L, indicating that the surface reaction reached saturation at RT in agreement with the in situ kinetics data presented in Fig. 2.
Even if one considers the uncertainty in the peak fitting, the spectra presented in Fig.
3 (a) yield a relative amount of Fe3+ and Fe2+ (e.g. Fe3+/Fe2+ intensity ratio of 1.4 at
3 L exposure) markedly below that (ratio of 2) corresponding to Fe3O4 which suggests
the presence of non-stoichiometric mixed Fe2+-Fe3+ rather than FeO oxide nuclei prior to
reaching saturation in agreement with the 709.4 eV BE value of Fe2+. As far as we know,
the existence of FeO at the earlier stage of stainless steel oxidation is still under debate [17–
19, 36]. Several studies have demonstrated that the main surface compounds were Fe2O3
and Fe3O4 for iron oxidation under oxygen exposure larger than 104 L [19]. On the contrary, the structure of FeO or FeO-like compounds were observed in studies [17, 18] addressing the conditions of FeO formation as compared to the phase diagram for the iron-oxygen system. Graat et al. [36] proposed the presence of FeO at RT for low oxygen exposure of 22 L. Our finding of Fe2+ species is in agreement with this work [36] and that of Roosendaal et al. [18]
but we also find Fe3+ species. Lin et al. [17] indicated that FeOx, the FeO-like oxide, was
the nucleating oxide formed after low oxygen exposure (10 L to 50 L) at RT. The change
of x value implies that the oxygen-deficient Fe2+-Fe3+ mixed phases are first formed during
the initial stages of oxidation and are transformed to Fe3O4 by further oxidation. We find
that Fe2+-Fe3+ mixed oxide nuclei, possibly oxygen-deficient, are formed on the surface in
the nucleation phase for oxygen exposures lower than 6 L for RT, 150 and 250◦C. At higher
exposure, the Fe3+/Fe2+ intensity ratio is found consistent with the presence of Fe3O4 as
well as the BE value of Fe2+ (709.4 eV). However, as discussed below, angle-resolved analysis
points to a different in-depth repartition of the Fe3+ and Fe2+ species.
Fig. 3 (b) shows the development of Cr3+ oxide and nitride components during oxidation.
Cr6+ species, expected at 579.3 eV BE [25], were not found. After long exposures (> 24 000 L), Fe-Cr mixed oxides were identified by Olefjord [51]. Lince et al. [16] have identified
only one Fe 2p peak varying at 709.5–710.8 eV BE to determine the existence of FeCr2O4 or
Fe1+xCr2−xO4, for a Fe-16Cr(001) surface exposed to oxygen for more than 400 L. Instead,
two components at 709.4 eV and 710.3 eV were used for iron oxide peak reconstruction in
our data. Thus the presence of Fe3+ and/or Fe2+ cations in the grown Cr3+ oxide matrix
cannot be excluded. It is also observed in Fig. 3 that chromium oxidizes more rapidly than iron because of its higher oxide to metal intensity ratio when oxygen exposure is lower than 14 L, i.e. in the nucleation phase. This is consistent with the results of Lince et al. [16].
Fig. 3 (c) presents the four identified nitrogen components: CrNb, CrNs, Nb and Nm.
CrNb is the main product of Cr-N co-segregation at the surface. It is attributed to
three-dimensional clusters [22, 52, 53] formed in the outer surface region including topmost and
subsurface and hereafter referred to as bulk nitride. CrNscorresponds to the two-dimensional
CrN [22, 52, 54] formed at the topmost surface and referred to as surface nitride. The peak
at 397.8 eV BE is identified here as interstitial nitrogen Nb [22] rather than Cr2N (397.6
eV) [5, 22] due to the inconsistency of the CrN and Nb intensities. The broad component
denoted Nm is identified in the decomposition of all spectra. Because of its broadness and
low intensity, this component could originate from the sum of various minority contributions.
At the very beginning of oxidation, mostly the CrNs and barely the Nb components increase
while the CrNb component decreases markedly in intensity. As discussed above, nitrogen
segregation saturation after annealing at 700◦C of the sputtered surface causes the formation
of a Cr-depleted region below the surface. This means that the increase of CrNs and Nb
components during oxidation is not the result of further nitrogen segregation from the bulk but the indication that the in-depth distribution of nitride has been modified by oxidation.
The transformation from CrNb to CrNs and Nb is accelerated at 150◦C and 250◦C. This
variation of nitrogen species was also observed in previous studies of ferritic steel upon
annealing [22] and assigned to the increasing instability of CrNb with increasing annealing
temperature. In summary, there is no nitrogen surface segregation during oxidation, rather
surface preparation.
Because of the complexity in oxide products, it was not attempted to distinguish the various Cr and Fe oxides according to the O spectra. Only the consistency between Cr and Fe oxides amounts and O intensity was verified.
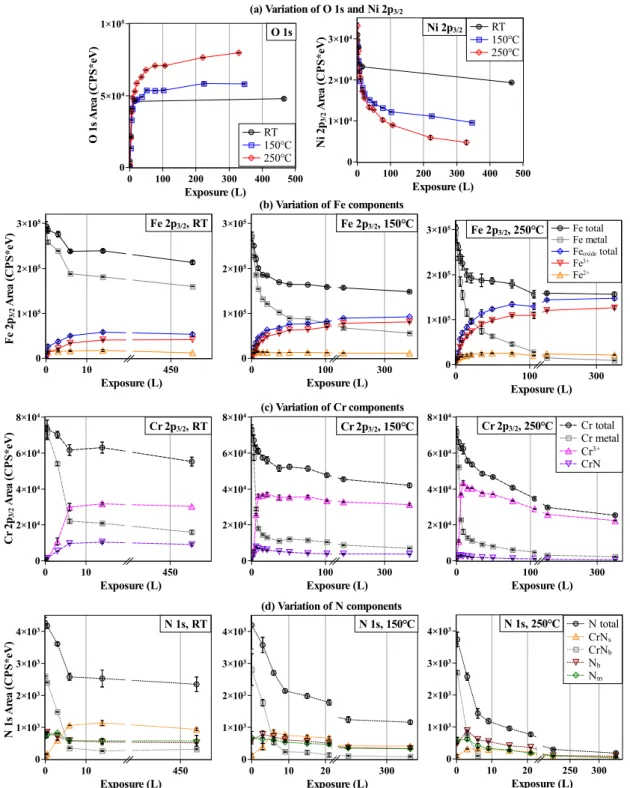
Fig. 4 presents the intensity variation of all core level components measured as a function
of oxygen exposure at the three temperatures and 45◦ take-off angle. Fig. 4 (a) shows the
variation of the total area of the O 1s and Ni 2p3/2 core levels. The O 1s intensity increases
until saturation at RT and near saturation at 150 and 250◦C. The saturation level increases
with increasing temperature, in agreement with the variation observed during the real-time monitoring as presented in Fig. 2. Concerning nickel, the observed continuous intensity decrease with ongoing oxidation is consistent with continuous attenuation of the signal by the growing Ni-free oxide film. No oxide of Ni was formed compared to Fe or Cr which is in agreement with their standard Gibbs energy of formation.
Fig. 4 (b) shows the variation of the Fe 2p3/2 metal and oxide core level components at
the three temperatures. At RT, the Fe2+ and Fe3+ components first increase simultaneously
(0.5 L). The increase of the Fe2+ component is stopped already at 3 L whereas that of
the Fe3+ component goes on until saturation at 14 L. A higher temperature promotes the
increase of the Fe3+ component but barely that of the Fe2+ component. This shows that
Fe-18Cr-13Ni(100) sample is first oxidized to simultaneously form Fe2+ and Fe3+ species in the
nucleation phase. Then, with further O2 exposure, Fe3+ is preferentially formed possibly by
oxidation of preformed Fe2+. This possibility implies that Fe2+ is still formed from metallic
Fe since still observed with ongoing oxidation. Another possibility would be that Fe3+ could
be produced directly from metallic Fe. In both cases, a higher temperature would promote
the oxidation reaction to Fe3+ and atomic transport leading to the increase of the oxide
quantity formed at saturation. The continuous intensity decrease with ongoing oxidation
of the metallic Fe0 component is consistent with continuous attenuation of photoelectrons
signal by the growing oxide species.
The variation of Cr3+ (Cr oxides), CrN and Cr metal component intensities is presented
in Fig. 4 (c). The Cr3+ oxide intensity increases rapidly in the nucleation phase for exposure 17
O 1 s A re a (C P S * eV ) 0 5×10⁴ 1×10⁵ Exposure (L) 0 100 200 300 400 500 O 1s RT 150℃ 250℃ N i 2 p3/2 A re a (C P S * eV ) 0 1×10⁴ 2×10⁴ 3×10⁴ Exposure (L) 0 100 200 300 400 500 Ni 2p3/2 RT 150℃ 250℃ (a) Variation of O 1s and Ni 2p3/2
F e 2 p3/2 A re a (C P S * eV ) 0 1×10⁵ 2×10⁵ 3×10⁵ Exposure (L) 0 10 450 Fe 2p3/2, RT 0 1×10⁵ 2×10⁵ 3×10⁵ Exposure (L) 0 100 300 (b) Variation of Fe components Fe 2p3/2, 150℃ 0 1×10⁵ 2×10⁵ 3×10⁵ Exposure (L) 0 100 300 Fe total Fe metal Feoxide total Fe3+ Fe2+ Fe 2p3/2, 250℃ C r 2 p3/2 A re a (C P S * eV ) 0 2×10⁴ 4×10⁴ 6×10⁴ 8×10⁴ Exposure (L) 0 10 450 Cr 2p3/2, RT 0 2×10⁴ 4×10⁴ 6×10⁴ 8×10⁴ Exposure (L) 0 100 300 (c) Variation of Cr components Cr 2p3/2, 150℃ 0 2×10⁴ 4×10⁴ 6×10⁴ 8×10⁴ Exposure (L) 0 100 300 Cr total Cr metal Cr3+ CrN Cr 2p3/2, 250℃ N 1 s A re a (C P S * eV ) 0 1×10³ 2×10³ 3×10³ 4×10³ Exposure (L) 0 10 450 N 1s, RT 0 1×10³ 2×10³ 3×10³ 4×10³ Exposure (L) 0 10 20 300 N 1s, 150℃ (d) Variation of N components 0 1×10³ 2×10³ 3×10³ 4×10³ Exposure (L) 0 10 20 250 300 N 1s, 250℃ N total CrNs CrNb Nb Nm
Fig. 4. Intensity variation of XPS core level components with increasing oxygen exposure at RT, 150◦C, 250◦C: (a) O 1s and Ni 2p3/2; (b) Fe 2p3/2; (c) Cr 2p3/2; (d) N 1s. Take-off angle: 45◦.
below 10 L and then levels off at higher exposure. A diminution is even observed with ongoing
exposure at 150 and 250◦C. There are two reasons for this diminution: Cr3+ formation slows
down while Fe3+ still forms and/or the Fe3+ oxides form above the Cr3+ oxides attenuating
the Cr3+ signal. The same evolution is found for the nitride component as for the oxide
Cr3+ component at all three temperatures. Comparing the consumption of metallic Cr0 and
Fe0, it can be deduced that, in the studied temperature range, chromium is preferentially
oxidized at the very beginning of oxidation in the nucleation phase below 10 L. For exposure
above 10 L, a higher temperature promotes the preferential formation of Fe3+-containing
oxides.
Fig. 4 (d) shows the evolution of the nitrogen component intensities with oxygen
ex-posure. CrNb, as the main product of Cr-N co-segregation at the prepared initial surface,
sharply decreases in intensity for the exposure below 10 L, and even almost disappears after
6 L at 250◦C. In contrast, CrNs increases in intensity and becomes the predominant nitride
species, before being attenuated by the oxide film still growing above 10 L exposure at 150 and 250◦C. Nm presents a similar intensity variation to Nb, supporting the assumption that it is related to minority structures associated to N in solution. It is concluded from the drop in intensity of all N components with increasing exposure to oxygen above 10 L exposure at
150 and 250◦C that the surface oxides develop above the remaining surface nitrides.
To sum up, these data show that the initial build-up of the surface oxide proceeds in the range of exposure below 10 L by simultaneous oxidation of iron and chromium. In
this nucleation stage, Cr3+ formation is preferential over Fe3+ and Fe2+ formation. Fe2+
formation is mostly observed in the very first stage of oxidation (0.5 L). Afterwards, only
Fe3+ is produced by further oxidation. Beyond 10 L of exposure to oxygen in the oxide
growth regime, the competitive oxidation switches in favor of Fe3+ formation. Increasing
the temperature (at 150◦C and 250◦C) increases the oxidation rate and quantity of formed
oxide without modifying the competitive oxidation sequence. Surface oxidation destabilizes the 3D surface nitrides produced by surface preparation and the oxide films grow above the remaining 2D interfacial nitrides. No oxidized nickel enters the composition of the oxide films.
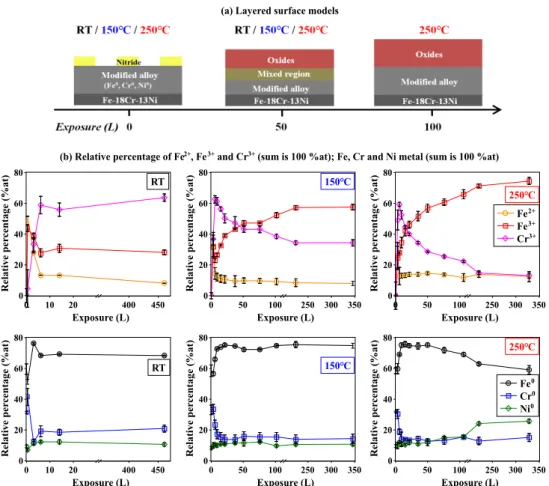
Relative per centage (% at) 0 20 40 60 80 Exposure (L) 0 10 20 400 450 RT Relative per centage (% at) 0 20 40 60 80 Exposure (L) 0 10 20 400 450 RT Relative per centage (% at) 0 20 40 60 80 Exposure (L) 0 50 100 250 300 350 Fe0 Cr0 Ni0 250℃ Relative per centage (% at) 0 20 40 60 80 Exposure (L) 0 50 100 250 300 350
(b) Relative percentage of Fe2+, Fe3+ and Cr3+ (sum is 100 %at); Fe, Cr and Ni metal (sum is 100 %at)
150℃ Relative per centage (% at) 0 20 40 60 80 Exposure (L) 0 50 100 250 300 350 150℃ Relative per centage (% at) 0 20 40 60 80 Exposure (L) 0 50 100 250 300 350 Fe2+ Fe3+ Cr3+ 250℃
(a) Layered surface models
Fig. 5. (a) Layered models of the Fe-18Cr-13Ni(100) surface after 0–100 L exposure to oxygen: bulk (Fe-18Cr-13Ni), modified alloy region (different concentration of alloy elements compared to bulk), mixed region (consisting of nitride, oxide and metallic components) and oxides region. (b) Variation of the relative concentrations of Fe, Cr and Ni compounds in metal and oxide phases with increasing exposure to oxygen at RT, 150◦C and 250◦C. The total percentage of metallic or oxide compounds is equal to 100 at%.
3.4.2. Layered surface composition
Although previous studies [16, 19, 20, 22, 24] have shown that no abrupt interface is formed between oxide and metal, layered models have been widely applied to describe the stratification of oxidized surfaces and quantify their composition. In this work, we have
performed comparative analysis of the XPS intensities measured at 45◦ and 90◦ take-off
angles of the emitted photoelectrons for each chemical component in order to define its relative distribution along the surface normal and thus to determine the in-depth distribution of the surface species.
Layered models were applied to quantify the surface composition and equivalent oxide film thickness. The resulting values do not account for the inhomogeneity of the growth process that can be expected due to local structural and chemical variations at the alloy surface, in particular in the nucleation phase. This aspect will be discussed separately in an article based on STM data. Still, the values reported hereafter allow us to discuss the highly relevant aspect of chromium enrichment and its variation with the build-up of the oxide film.
Fig. 5 (a) presents the layered models of surface composition that were used for the clean
annealed surface and the surface oxidized up to 100 L exposure at RT, 150◦C and 250◦C.
For all three temperatures, the layered surface composition was modeled with 3 regions: the oxide region, the mixed region (consisting of nitride, oxide and metallic components) and the modified alloy region where the compositions of alloy elements differ from that in the bulk alloy. This classical model of the top oxide layer covering the modified alloy layer with a mixed inter region as a transition between oxide and metal has been used in previous studies [17–20, 22, 24]. Prior to oxidation (0 L), the two-dimensional chromium nitride is formed at the outermost surface and the alloy is modified due to the co-segregation of Cr and N. Upon oxidation, an intermediate region mixing metal, oxide and nitride species is observed up to 50 L exposure at the interface between oxide and modified alloy; the nitride signal becomes totally attenuated by the top oxide layer for an exposure of about 100 L at
250◦C. Upon higher exposure at 150◦C and 250◦C, the models are unchanged.
Assuming a homogeneous composition for both oxide and modified alloy layers, com-position and equivalent oxide film thickness may be calculated. Variations of the relative concentration of Fe, Cr and Ni compounds in metallic and oxide phases as a function of exposure are shown in Fig. 5 (b). The equivalent thickness values were calculated from the
intensity ratios between the metal and oxide components of the Fe and Cr 2p3/2 core level
based on the exponential attenuation of the photoelectron intensity with depth [15, 55, 56]. These thicknesses are given in Fig. 6.
These composition and thickness results should be taken with caution as they are cal-culated from a simplified model. However these quantities are relevant for comparison with
previous studies and relative changes in concentrations help us to understand the underlying mechanism that govern the oxide growth process.
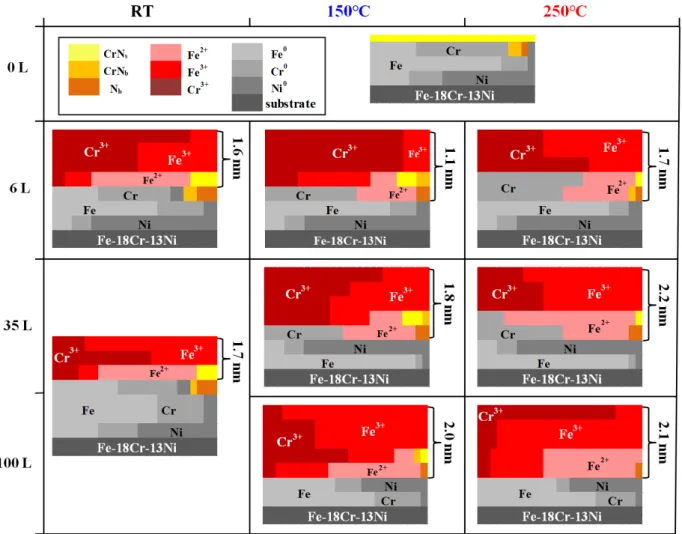
Based on an analysis of angular dependent photoemission spectra, a more precise model of the surface may be proposed. Fig. 6 presents the schematic view of the species
distribu-tion as a funcdistribu-tion of oxygen exposure at RT, 150◦C and 250◦C. This is the first complete
stratification scheme of oxidized surface of a stainless steel at the initial oxidation stage. The equivalent thicknesses of the oxide regions ranges between 1.1–2.2 nm, calculated based on a simplified homogeneous model including the interfacial oxide/metal mixed region. This is consistent with oxide films reported to be 1–4 nm thick when formed on Fe or Fe-base alloys [16, 17, 19, 20, 22–24, 36, 57]. At RT, the calculated thickness is stable at 1.6–1.7 nm after the 6 L exposure, in agreement with the saturation observed in the oxygen uptake (Fig. 2 and 4) and with 1.8–2 nm thickness reported for the native oxide film formed on
the same austenitic stainless steel surface [23]. At 150 and 250◦C, the oxide equivalent
thickness increases with exposure also following the same trend as the oxygen uptake (Fig. 2). However, the increase observed in the oxygen uptake at saturation with temperature
increasing to 150 and 250◦C (Fig. 4) is not reproduced by the calculated thickness which
yields similar values of 2.0–2.1 nm. A possible explanation is that the simplified model used for calculation does not accurately account for the deviation of the morphology of the surface
oxides grown at 150 and 250◦C from a continuous and uniformly thick film. This suggests
that the films grown at higher temperature may include 3D oxide islands and thus may be non-uniform in thickness.
On the as-prepared surface (0 L), the modified region is enriched in metallic Cr (29 at% instead of 18 at% in the bulk alloy) and stratified. Metallic Cr is found concentrated in the upper part of the modified alloy region due to co-segregation with nitrogen after annealing
at 700◦C. The two-dimensional CrNscomponent is located on the topmost surface; while the
three-dimensional CrNb component and interstitial nitrogen Nbare found in this Cr-enriched
upper part. Metallic Fe is found to be concentrated just below the Cr-enriched upper part while metallic Ni concentrates at the bottom of the modified alloy region. After oxidation
Fig. 6. Schematic stratification profiles of the Fe-18Cr-13Ni(100) surface after 0–100 L exposure to oxygen at RT, 150◦C and 250◦C. The color blocks areas represent the relative proportions of components in the oxide and modified alloy regions. The equivalent thickness of oxide region (calculated from layered models in Fig. 5) is indicated on the right.
mixed interfacial region developed between growing oxide and modified alloy. Only at RT,
CrNb and Nb remain in the upper part of the modified alloy region underneath the oxide.
According to previous studies [22, 24], there would be no clear separation between Cr
oxide and Fe oxide in the oxidized surface. An amorphous oxide FeCr2O4-like phase could
exist after a large exposure at a higher temperature (1000 L, 300◦C) [20]. However, our angle-resolved analysis supports the formation of layered surface oxides with different relative
positions of the Cr3+, Fe3+ and Fe2+ species. The mechanisms by which the component
distribution varies under very low exposure at the three studied temperatures are as follows.
Upon oxidation at RT, the surface oxide is found markedly enriched in Cr3+ already after
an oxygen exposure of 6 L as a result of the preferential oxidation of chromium due to their
relative standard Gibbs energy of formation. The cation fraction of Cr3+ in the oxide is then
calculated as 59 at%. Fe2+ and Fe3+ oxide species are also formed by competitive oxidation
but in lower amounts. Their fractions are 13 at% and 28 at%, respectively. The Fe2+ oxide
species are found mixed with the CrNs species in the interfacial layer underneath the Cr3+
and Fe3+ mixed layer, likely as a result of their competitive formation on the bare metallic
surface in the very first oxidation step (0.5 L) as discussed above. Further oxidation beyond saturation has little effect on the layered oxidized structure and composition. The cation fraction is 56 at% for Cr3+, 13 at% for Fe2+ and 31 at% for Fe3+ at 35 L. The modified alloy region has an unchanged concentration of 68%Fe-19%Cr-13%Ni at 6 L and 69%Fe-19%Cr-12%Ni at 35 L if we assume a homogeneous distribution of species, still not depleted in Cr and with a Cr-enriched metallic layer at the top. This means that the surface saturated with oxygen at RT has still the capacity to form Cr oxides in order to grow a protective surface layer.
Upon oxidation at 250◦C, the same layered structure of oxide film is found with a mixed
Cr3+/Fe3+ layer above the Fe2+-containing interfacial layer. Moreover, the results show that the structure is determined not only by the competitive oxidation of Cr and Fe, but also by their atomic mobility. At 6 L (Fig. 6), metallic Cr is found preferentially in the interfacial
region containing Fe2+ and Cr-nitrides, suggesting its transport from the modified alloy
(the cation fraction is 59 at% for Cr3+, 13 at% for Fe2+ and 28 at% for Fe3+ in Fig. 5 (b)). As a result, the modified alloy region is enriched with metallic Fe in its upper part. Thus, the competitive oxidation of iron is promoted gradually after 10 L exposure and Fe oxidation prevails over Cr oxidation at the oxide-metal interface. As a result, the Cr enrichment in
the growing oxide film decreases with cation fractions of 34 at% for Cr3+, 14 at% for Fe2+
and 52 at% for Fe3+ after 35 L exposure, and the interfacial region and the upper part of
the modified alloy regions become depleted in metallic Cr. Subsequent oxygen exposure (> 50 L) still preferentially consumes Fe leading to further decrease of the Cr enrichment in
the growing oxide film with cation fractions of 22 at% for Cr3+, 12 at% for Fe2+ and 66 at%
for Fe3+ after 106 L. At this exposure, the Fe3+-rich oxide is found predominantly below
the Cr3+-rich oxide, which suggests its preferential formation at the oxide-metal interface,
i.e. under the Cr oxide. The metallic fraction in the modified alloy region below the
oxide varies from 69%Fe-19%Cr-12%Ni at 6 L to 74%Fe-14%Cr-12%Ni at 35 L and 68%Fe-16%Cr-16%Ni at 106 L, indicating that iron is relatively stable, chromium consumed and Ni enriched. These variations suggest that Fe oxidation is sustained by diffusion of metallic Fe from sub-surface region to the modified alloy region, whereas that of Cr is much less so possibly due to slower diffusion. The slight enrichment of Ni is detected in the Cr-depleted region, similarly to the Ni segregation reported in a study of Fe-20Cr-18Ni oxidation at
300◦C [20]. We conclude from these data obtained at 250◦C that the oxide film growth
and resulting surface composition are ruled by thermodynamically-dominated competitive oxidation of Cr and Fe in the very first stages like at RT. When oxygen exposure exceeds 50 L, Fe oxide formation at oxide-metal interface becomes dominant and dependent on diffusion in the modified alloy region. This dependence of the competition between Cr oxidation and Fe oxidation over exposure is consistent with transformation from thermodynamically dominated to kinetically controlled reaction processes [35].
According to our kinetics results discussed above, the oxide film growth at 150◦C is
intermediate between those at RT and 250◦C. Similarly to the results obtained at RT and
250◦C, the oxide is enriched in Cr3+ in the earliest stage of oxidation with cation fractions
of 63 at% for Cr3+, 14 at% for Fe2+ and 23 at% for Fe3+ at 6 L. The modified alloy region
is still not depleted in chromium with a concentration of 66%Fe-23%Cr-11%Ni. For the
exposure of about 40 L, the oxide enrichment in Cr3+ decreases (cation fractions of 48 at%
for Cr3+, 9 at% for Fe2+and 43 at% for Fe3+) like at 250◦C with Cr depletion in the modified
metallic alloy (73%Fe-15%Cr-12%Ni). For further exposure (> 50 L), the Cr3+ enrichment
still decreases in the oxide (cation fractions of 39 at% for Cr3+, 9 at% for Fe2+ and 52
at% for Fe3+) owing to preferential Fe oxidation. The Cr concentration in the modified
metallic layer is unchanged (75%Fe-14%Cr-11%Ni). This confirms that the preferential
consumption of iron by oxidation is compensated by diffusion from the sub-surface to the
modified alloy region. Like at 250◦C, Ni becomes concentrated in the upper part of the
modified alloy region. A noticeable difference with the oxide film grown at 250◦C is the
preferential formation of Fe3+ oxide at the topmost surface, as at RT. This suggests that
at 150◦C iron transport through the Cr3+/Fe3+ oxides is dominant for the oxide growth for
exposures larger than 35 L, whereas at 250◦C oxygen transport to the oxide-metal interface
would be dominant.
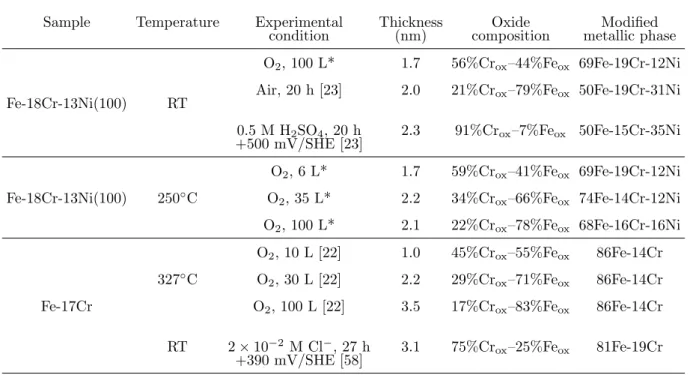
Table 2 compiles the data of surface composition and thickness obtained in this work, the data for a native oxide film formed by exposure to ambient air and a passive film formed by anodic polarization on the same alloy surface at RT, and the data for a thermal oxide
film formed by exposing a Fe-17Cr alloy surface to oxygen at 327◦C. At RT, the surface
saturated under oxygen in the present work is found more enriched in Cr3+ than the surface
aged for 20 h under ambient air [23]. This can be assigned, at least partly, to the Cr-N co-segregation resulting from surface preparation in our work and that would promote the selective oxidation of chromium as previously reported [22]. However, the oxide film grown
at RT under oxygen in the present work in much less enriched in Cr3+ than a passive film
produced in acidic aqueous solution [23], which can be assigned to the absence of preferential dissolution of iron oxides promoting chromium enrichment in acidic media, as also found on a ferritic Fe-17Cr alloy oxide film grown by exposure to oxygen [22] and anodic polarization
[58]. With the increase of temperature to 250◦C, it is found in the present work that the
chromium oxidation is hindered by the depletion of metallic Cr underneath the growing oxide layer, while the diffusion of metallic Fe from the bulk enables to sustain iron oxidation, thus
Table 2 Thickness and chemical composition (at%) of thermal oxide film, native oxide film and passive oxide film formed on Fe-18Cr-13Ni(100) and Fe-17Cr, assuming homogeneous distribution of species
Sample Temperature Experimental Thickness Oxide Modified
condition (nm) composition metallic phase
Fe-18Cr-13Ni(100) RT
O2, 100 L* 1.7 56%Crox–44%Feox 69Fe-19Cr-12Ni Air, 20 h [23] 2.0 21%Crox–79%Feox 50Fe-19Cr-31Ni 0.5 M H2SO4, 20 h 2.3 91%Crox–7%Feox 50Fe-15Cr-35Ni +500 mV/SHE [23]
Fe-18Cr-13Ni(100) 250◦C
O2, 6 L* 1.7 59%Crox–41%Feox 69Fe-19Cr-12Ni
O2, 35 L* 2.2 34%Crox–66%Feox 74Fe-14Cr-12Ni O2, 100 L* 2.1 22%Crox–78%Feox 68Fe-16Cr-16Ni
Fe-17Cr
327◦C
O2, 10 L [22] 1.0 45%Crox–55%Feox 86Fe-14Cr O2, 30 L [22] 2.2 29%Crox–71%Feox 86Fe-14Cr O2, 100 L [22] 3.5 17%Crox–83%Feox 86Fe-14Cr RT 2 × 10⁻² M Cl−, 27 h 3.1 75%Cr
ox–25%Feox 81Fe-19Cr +390 mV/SHE [58]
* This work
leading to a gradual decrease of the Cr3+ enrichment with increasing exposure. Compared
to the thermal oxidation of a ferritic Fe-17Cr sample (also with surface nitrides) at 327◦C
[22], the variation of the Cr3+ enrichment on our austenitic sample follows the same trend.
4. Conclusion
Real-time monitoring of the evolution of a model 304 stainless steel monocrystal surface,
Fe-18Cr-13Ni(100), in the early stages of oxidation at RT, 150◦C and 250◦C was achieved
using in situ XPS in Snapshot mode analysis and complemented by high resolution core level analysis of the growth mechanisms and Cr enrichment. The work revealed, for the first time to our knowledge, the mechanisms of stratification during the early build-up of the surface oxide on a model austenitic stainless steel surface at different temperatures.
The results show that, on the oxide-free surface, nitrogen segregation is detected upon heating at 400◦C and increases significantly above 500◦C to reach a saturation at 680◦C. The
activation energy of nitrogen segregation is 72±5 kJ/mol. Marked Cr enrichment of the as prepared metallic surface was observed as a result of Cr segregation and Cr-N co-segregation
with N forming mainly three-dimensional CrNbparticles with minority two-dimensional CrNs
and interstitial nitrogen Nb. Surface oxidation destabilizes the 3D chromium nitrides and
the oxide films grow above the 2D surface nitrides remaining at the surface.
The temperature dependence of the surface oxygen uptake as measured by real-time monitoring evidences two regimes for the growth of the surface oxide. Up to about 10 L of oxygen exposure, the uptake is faster with a maximum at 2–5 L and decreases with increasing temperature, suggesting a nucleation regime of the surface oxide limited by oxygen adsorption. Beyond 10 L, the uptake is saturated at RT but increases with temperature, suggesting a growth regime of the surface oxide limited by atomic displacement and mobility.
The oxygen pressure in the range below 10−6 mbar is found to have no effect on the oxidation
rate.
In the nucleation regime leading to saturation, Cr3+ formation is preferential over Fe3+
formation and Fe2+ formation is mostly observed in the very first stage of oxidation (0.5
L). Nickel is not oxidized. A surface layer of strongly Cr3+-enriched oxide is thus formed
over the mainly Fe2+ oxide (FeO-like) species mixed with the CrN
s species in the interfacial
layer underneath the Cr3+/Fe3+ mixed layer. Further oxidation beyond saturation at RT
causes no marked evolution of the oxide layered structure, composition and thickness. The modified alloy region is still not depleted in metallic Cr and thus able to further grow a Cr3+-enriched protective surface layer.
At 150 and 250◦C, the oxide formed in the nucleation regime is also enriched in Cr3+
but the modified alloy region gets depleted with metallic Cr. As a result, the competitive oxidation of iron is gradually promoted in the oxide growth regime leading to the decrease of
the Cr3+ enrichment in the oxide. Fe oxidation is sustained by diffusion of metallic Fe from
sub-surface region to the modified alloy region. At 150◦C, Fe3+ oxide was found to form
at the topmost surface, whereas at 250◦C it was at the oxide-metal interface, suggesting a
switch of the oxide growth from predominant iron transport through the Cr3+/Fe3+ oxide
Acknowledgments
This project has received funding from the European Research Council (ERC) under the European Union’s Horizon 2020 research and innovation program (ERC Advanced Grant No.
741123). R´egion ˆIle-de-France is acknowledged for partial funding of the XPS equipment.
China Scholarship Council (CSC) is acknowledged for the scholarship to the first author (No. 201606380129).
References
[1] D. Macdonald, Passivity - The key to our metals-based civilization, Pure Appl. Chem. 71 (1999) 951 – 978.
[2] H. H. Strehblow, V. Maurice, P. Marcus, Passivity of metals, Corros. Technol., CRC Press, 2011, pp. 235 – 326.
[3] P. Marcus, V. Maurice, Oxide passive films and corrosion protection, Wiley-VCH Verlag GmbH & Co. KGaA, 2011, pp. 119 – 144.
[4] V. Maurice, W. P. Yang, P. Marcus, XPS and STM study of passive films formed on Fe-22Cr(110) single-crystal surfaces, J. Electrochem. Soc. 143 (1996) 1182 – 1200.
[5] P. Marcus, M. E. Bussell, XPS study of the passive films formed on nitrogen-implanted austenitic stainless steels, Appl. Surf. Sci. 59 (1) (1992) 7 – 21.
[6] I. Olefjord, The passive state of stainless steels, Mater. Sci. Eng. 42 (C) (1980) 161 – 171.
[7] I. Olefjord, B. O. Elfstrom, Composition of the surface during passivation of stainless steel, Corrosion 38 (1) (1982) 46 – 52.
[8] I. Olefjord, B. O. Elfstrom, Investigation by ESCA of the passive film formed on austenitic stainless steel in oxygenated water, EUROCOR’77, Eur. Congr. on Met. Corros., 92nd Event of the Eur. Fed. of Corros. (1977) 21 – 28.
[9] I. Olefjord, L. Wegrelius, Surface analysis of passive state, Corros. Sci. 31 (C) (1990) 89 – 98.
[10] P. Jemmely, S. Mischler, D. Landolt, Tribocorrosion behaviour of Fe-17Cr stainless steel in acid and alkaline solutions, Tribol. Int. 32 (6) (1999) 295 – 303.
[11] C. R. Clayton, G. P. Halada, J. R. Kearns, Passivity of high-nitrogen stainless alloys: the role of metal oxyanions and salt films, Mater. Sci. Eng., A 198 (1) (1995) 135 – 144.
[12] A. R. Brooks, C. R. Clayton, K. Doss, Y. C. Lu, On the role of Cr in the passivity of stainless steel, J. Electrochem. Soc. 133 (1986) 2459 – 2464.
[13] J. E. Castle, C. R. Clayton, The use of in the X-ray photo-electron spectroscopy analyses of passive layers on stainless steel, Corros. Sci. 17 (1) (1977) 7 – 26.
[14] T. Massoud, V. Maurice, L. H. Klein, A. Seyeux, P. Marcus, Nanostructure and local properties of oxide layers grown on stainless steel in simulated pressurized water reactor environment, Corros. Sci. 84 (2014) 198 – 203.
[15] V. Maurice, H. Peng, L. H. Klein, A. Seyeux, S. Zanna, P. Marcus, Effects of molybdenum on the composition and nanoscale morphology of passivated austenitic stainless steel surfaces, Faraday Discuss. 180 (2015) 151 – 170.
[16] J. R. Lince, S. V. Didziulis, D. K. Shuh, T. D. Durbin, J. A. Yarmoff, Interaction of O2 with the Fe0.84Cr0.16(001) surface studied by photoelectron spectroscopy, Surf. Sci. 277 (1) (1992) 43 – 63. [17] T. C. Lin, G. Seshadri, J. A. Kelber, A consistent method for quantitative XPS peak analysis of thin
oxide films on clean polycrystalline iron surfaces, Appl. Surf. Sci. 119 (12) (1997) 83 – 92.
[18] S. J. Roosendaal, B. van Asselen, J. W. Elsenaar, A. M. Vredenberg, F. H. P. M. Habraken, The oxidation state of Fe(100) after initial oxidation in O2, Surf. Sci. (1999) 329 – 337.
[19] A. P. Grosvenor, B. A. Kobe, N. S. McIntyre, Examination of the oxidation of iron by oxygen using X-ray photoelectron spectroscopy and QUASES, Surf. Sci. 565 (23) (2004) 151 – 162.
[20] M. Lampim¨aki, K. Lahtonen, P. Jussila, M. Hirsim¨aki, M. Valden, Morphology and composition of nanoscale surface oxides on Fe-20Cr-18Ni(111) austenitic stainless steel, J. Electron. Spectrosc. Relat. Phenom. 154 (3) (2007) 69 – 78.
[21] R. Davies, D. Edwards, J. Gr¨afe, L. Gilbert, P. Davies, G. Hutchings, M. Bowker, The oxidation of Fe(111), Surf. Sci. 605 (1718) (2011) 1754 – 1762.
[22] H. Ali-L¨oytty, P. Jussila, M. Hirsim¨aki, M. Valden, Influence of CrN surface compound on the initial stages of high temperature oxidation of ferritic stainless steel, Appl. Surf. Sci. 257 (17) (2011) 7783 – 7791.
[23] V. Maurice, W. P. Yang, P. Marcus, X-ray photoelectron spectroscopy and scanning tunneling mi-croscopy study of passive films formed on (100) Fe-18Cr-13Ni single-crystal surfaces, J. Electrochem. Soc. 145 (3) (1998) 909 – 920.
[24] P. Jussila, K. Lahtonen, M. Lampim¨aki, M. Hirsim¨aki, M. Valden, Influence of minor alloying elements on the initial stages of oxidation of austenitic stainless steel materials, Surf. Interface Anal. 40 (8) (2008) 1149 – 1156.
[25] M. Aronniemi, J. Sainio, J. Lahtinen, Chemical state quantification of iron and chromium oxides using XPS: the effect of the background subtraction method, Surf. Sci. 578 (13) (2005) 108 – 123.
[26] T. Yamashita, P. Hayes, Analysis of XPS spectra of Fe2+and Fe3+ions in oxide materials, Appl. Surf. Sci. 254 (8) (2008) 2441 – 2449.
[27] B. P. Payne, M. C. Biesinger, N. S. McIntyre, X-ray photoelectron spectroscopy studies of reactions on chromium metal and chromium oxide surfaces, J. Electron. Spectrosc. Relat. Phenom. 184 (12) (2011)
29 – 37.
[28] M. C. Biesinger, B. P. Payne, A. P. Grosvenor, L. W. M. Lau, A. R. Gerson, R. S. C. Smart, Resolving surface chemical states in XPS analysis of first row transition metals, oxides and hydroxides: Cr, Mn, Fe, Co and Ni, Appl. Surf. Sci. 257 (7) (2011) 2717 – 2730.
[29] A. P. Grosvenor, M. C. Biesinger, R. S. C. Smart, N. S. McIntyre, New interpretations of XPS spectra of nickel metal and oxides, Surf. Sci. 600 (9) (2006) 1771 – 1779.
[30] A. M. Salvi, J. E. Castle, J. F. Watts, E. Desimoni, Peak fitting of the chromium 2p XPS spectrum, Appl. Surf. Sci. 90 (3) (1995) 333 – 341.
[31] J. E. Castle, H. Chapman-Kpodo, A. Proctor, A. M. Salvi, Curve-fitting in XPS using extrinsic and intrinsic background structure, J. Electron. Spectrosc. Relat. Phenom. 106 (1) (2000) 65 – 80.
[32] I. Grohmann, E. Kemnitz, A. Lippitz, W. E. S. Unger, Curve fitting of Cr 2p photoelectron spectra of Cr2O3and CrF3, Surf. Interface Anal. 23 (13) (1995) 887 – 891.
[33] E. ¨Unveren, E. Kemnitz, S. Hutton, A. Lippitz, W. E. S. Unger, Analysis of highly resolved X-ray photoelectron Cr 2p spectra obtained with a Cr2O3powder sample prepared with adhesive tape, Surf. Interface Anal. 36 (1) (2004) 92 – 95.
[34] D. D. Wagman, W. H. Evans, V. B. Parker, R. H. Schumm, R. L. Nutall, The NBS tables of chemical thermodynamic properties, J. Phys. Chem. Ref. Data 11.
[35] G. C. Allen, S. J. Harris, J. A. Jutson, J. M. Dyke, A study of a number of mixed transition metal oxide spinels using X-ray photoelectron spectroscopy, Appl. Surf. Sci. 37 (1) (1989) 111 – 134.
[36] P. C. J. Graat, M. A. J. Somers, Simultaneous determination of composition and thickness of thin iron-oxide films from XPS Fe 2p spectra, Appl. Surf. Sci. 100/101 (1996) 36 – 40.
[37] P. Graat, M. Somers, Quantitative analysis of overlapping XPS peaks by spectrum reconstruction: Determination of the thickness and composition of thin iron oxide films, Surf. Interface Anal. 26 (1998) 773 – 782.
[38] D. J. Coates, A. Hendry, The effect of dispersed nitrides on the oxidation of ferritic alloys, Corros. Sci. 22 (10) (1982) 973 – 989.
[39] S. J. Roosendaal, A. M. Vredenberg, F. H. P. M. Habraken, The influence of adsorbed N in the initial stages of oxidation of iron, Surf. Sci. 402404 (1998) 135 – 139.
[40] D. J. Coates, B. Mortimer, A. Hendry, The oxidation and corrosion resistance of nitrided iron alloys, Corros. Sci. 22 (10) (1982) 951 – 972.
[41] H. J. Grabke, R. Dennert, B. Wagemann, The effect of S, N, and C on the oxidation of Ni-20Cr and Fe-20Cr, Oxid. Met. 47 (5-6) (1997) 495 – 506.
[42] L. Ma, F. Wiame, V. Maurice, P. Marcus, to be published. [43] www.casaxps.com.