HAL Id: tel-02438017
https://tel.archives-ouvertes.fr/tel-02438017
Submitted on 14 Jan 2020HAL is a multi-disciplinary open access archive for the deposit and dissemination of sci-entific research documents, whether they are pub-lished or not. The documents may come from teaching and research institutions in France or abroad, or from public or private research centers.
L’archive ouverte pluridisciplinaire HAL, est destinée au dépôt et à la diffusion de documents scientifiques de niveau recherche, publiés ou non, émanant des établissements d’enseignement et de recherche français ou étrangers, des laboratoires publics ou privés.
Hydrogen production from irradiated calcium silicate
hydrate
Chengying Yin
To cite this version:
Chengying Yin. Hydrogen production from irradiated calcium silicate hydrate. Radiochemistry. Uni-versité Paris Saclay (COmUE), 2019. English. �NNT : 2019SACLS355�. �tel-02438017�
1
Hydrogen production from
irradiated calcium silicate hydrate
Thèse de doctorat de l'Université Paris-Saclay préparée à l'Université Paris-Sud
École doctorale n°571 Sciences chimiques : molécules, matériaux, instrumentation et biosystèmes (2MIB) Spécialité de doctorat Chimie
Thèse présentée et soutenue à Marcoule, 15, Novembre, 2019 par
Chengying YIN
NT T: 2 0 1 9 S A CL S 3 5 5 Composition du Jury : M. Mehran MostafaviProfesseur, Université Paris-Saclay Président
Mme. Isabelle Pochard
Maître de Conférences HDR CNRS, Institut UTINAM, Besançon Rapporteur
Mme. Nathalie Moncoffre
Directrice de Recherche CNRS, IP2I-Lyon Rapporteur
M. Jean-Baptiste d’ESPINOSE de LACAILLERIE
Professeur, ESPCI Paris Examinateur
M. Jean-Philippe Renault
Chercheur CEA, CEA Saclay Directeur de thèse
Mme. Adeline Dannoux-Papin
Chercheur CEA, CEA Marcoule Encadrant de thèse
M. Jérémy Haas
2
Les ciments Portland utilisés pour le conditionnement ou l'enrobage de déchets radioactifs sont principalement composés de phases silicates et aluminates dont l'hydratation conduit à la formation de deux hydrates principaux, les hydrates de silicate de calcium (C-S-H)
et la portlandite (Ca(OH)2). Le comportement de la pâte de ciment sous irradiation est bien
connu dans la littérature en termes de radiolyse de l'eau interstitielle et donc d'émission d'hydrogène radiolytique. Leur stabilité sous irradiation pouvant atteindre l'ordre de plusieurs GGy de doses absorbées en font des matériaux de choix pour les déchets d'emballages. De plus, une diminution de la résistance mécanique s'explique par la décomposition des hydrates, l'apparition de phases amorphes et la dissociation de l'eau chimiquement liée. Enfin, l'hydrogène radiolytique est principalement produit par radiolyse de l'eau interstitielle ("libre"). Des études récentes ont montré que l'eau d'hydratation ("liée") de différents hydrates contribue également. De plus, l'eau à l'interface des hydrates inclus dans le ciment joue un rôle essentiel. Bien que l'effet de l'irradiation sur la microstructure et l'émission d'hydrogène radiolytique aient été étudiés, il reste peu de connaissances sur la radiolyse de l'eau à l'interface des hydrates et comment elle contribue à la stabilité du matériau cimentaire sous irradiation. Selon certains auteurs, certains effets spécifiques devraient être attendus dans des matériaux tels que les transferts d'énergie ou la diffusion d'espèces radiolytiques transitoires dans le solide et/ ou à l'interface eau/ solide. Les défauts électroniques dus au rayonnement dans les différents hydrates (CSH, portlandite, ...) du ciment sont inconnus. Mais identifier et étudier leur stabilité est la clé pour comprendre les mécanismes impliqués dans la radiolyse de l'eau dans un environnement complexe.Le but de cette étude est de comprendre les mécanismes radiolytiques de la production d'hydrogène dans la CSH, d'étudier l'effet des impuretés (telles que les ions alcalins, les hydroxydes supplémentaires ou les ions nitrates) sur
la production de gaz H2 dans la CSH et d'examiner s'il existe des interactions entre les différents
phases principales (CSH et portlandite) dans la matrice de ciment. Après avoir utilisé diverses techniques de caractérisation, les échantillons ont été soumis à différents types d'irradiation (rayons gamma et électrons et faisceaux d'ions lourds (HI)) pour déterminer leur rendement
radiolytique en H2, G (H2). Dans le système C-S-H, il a été démontré, sous irradiation gamma,
que le G (H2) ne dépend pas de la teneur en eau.En outre, le système C-S-H produit lui-même
efficacement du gaz H2. La comparaison entre les résultats obtenus sous rayons gamma et ceux
obtenus sous HI implique: il n'y a pas/ peu d'effet LET en C-S-H. Alors qu'avec les ions nitrate
3
principalement composés de C-S-H et de portlandite montre qu'il n'y a pas de phénomène de transfert d'énergie entre ces deux phases. Enfin, les expériences de spectroscopie par résonance paramagnétique électronique (EPR) ont permis de proposer des mécanismes radiolytiques. Tous ces résultats nous aident à comprendre les effets des rayonnements dans les ciments.
4
Acknowledgments
Firstly, I would like to express my sincere gratitude to my supervisors Adeline Dannoux-Papin and Jérémy Haas, for their guidance helped me in all the time of research and writing of this thesis. Thank you for your patience. As well as my director Jean-Philippe Renault, for the scientific advice and important discussion during the thesis, for his patience and immense knowledge.
Besides my advisors, I would like to thank the rest of my thesis committee: Isabelle Pochard, Nathalie Moncoffre, Mehran Mostafavi, Jean-Baptiste d’Espinose de LACAILLERIE, for accepting the invitation to be the members of jury of my thesis.
I would like to thank the chiefs of LCBC, Stéphane Perrin and Fabien Frizon, for their help during the thesis. Thank you all for receiving me in your laboratory and allowing me to use research facilities.
My deepest thanks go to Stéphane Esnouf for helping me on the EPR experiments and for teaching me to perform the analysis from the very beginning, this thesis work cannot be conducted without you! I won’t forget how kind you were! Thank you so much.
I would like to express my gratitude to Arnaud Poulesquen, for SAXS/ WAXS analysis and TEM experiments, Thank you for the help, for your clear explanation, your time and your kindness.
My sincere thanks also go to Jennifer Sanchez-Canet, Pascal Antonucci, Karine Ressayre, Thomas Piallat, David Rudloff, Aderine Gerenton, Géraldine Dideron, Maryline Charlot-Ortega, Leslie Berthillot, Véronique Labed.
I would like to thank David Chartier, Céline Cau-Dit-Coumes, Jean-Baptiste Champenois, and David Lambertin, they had always encouraging words and pertinent scientific advice.
I thank my fellow labmates Birsen, Jihane, Pauline, Oriane, Nicolas, Frédéric, Svetlana, Donatien, Julien and Priscillia, for all the fun we have had in the last three years.
I take this opportunity to express gratitude to all of the administration group in the lab for helping me focusing the research, they are Myriam Capion, Kelly Salomez, and Xia Lo.
5
Last but not least, I would like to thank my family: my parents for supporting me spiritually throughout writing this thesis and my life in general.
6
List of contents
ACKNOWLEDGMENTS ... 2 LIST OF CONTENTS ... 6 LIST OF TABLES ... 10 LIST OF FIGURES ... 13 GLOSSARY ... 18 INTRODUCTION ... 19CHAPTER 1: LITERATURE REVIEW ... 22
1.1. CEMENT CHEMISTRY ... 22
1.1.1. Portland cement ... 22
1.1.2. Calcium silicate hydrate ... 22
1.1.2.1. Chemical composition ... 23
1.1.2.2. Structure ... 23
1.1.3. Specific surfaces of CSH ... 25
1.1.3.1. Surface charge ... 29
1.1.4. Texturation ... 29
1.1.5. Different types of water ... 30
1.1.6. Modification of C-S-H with the C/S ratio ... 31
1.1.7. Uptake in C-S-H ... 32
1.1.8. Carbonation of C-S-H ... 33
1.1.9. Conclusion ... 33
1.2. INTERACTION OF RADIATIONS WITH MATTER ... 34
1.2.1. Type of radiation ... 34
1.2.2. Direct ionizing radiation and indirect ionizing radiation ... 35
1.2.3. Types of interactions with matter ... 36
1.2.3.1. Interaction of photons (X-rays, γ rays, Extreme UV) with matter ... 36
1.2.3.2. Interaction of charged particles (electron, heavy ions, α particles) with matter ... 39
1.2.4. Definition of LET ... 39
1.2.5. Definition of Radiolytic yield ... 40
1.2.6. Elastic or inelastic collisions ... 41
1.2.7. Radiolysis of Water ... 42
1.2.7.1. Liquid water ... 42
1.2.7.2. pH effect on G values ... 44
1.2.7.3. LET effects on G values ... 45
1.2.8. Irradiation in materials by types of water ... 46
1.2.8.1. Adsorbed water ... 46
7
1.2.8.3. Pore water in 3D network ... 50
1.2.8.4. Pore water in 2D network ... 52
1.2.8.5. Cement based materials ... 55
1.2.8.6. Radiation induced defect (RID) ... 57
1.2.8.6.1. Zeolites ... 57
1.2.8.6.2. Aluminosilicates glasses ... 58
1.2.8.6.3. Clays minerals... 59
1.2.8.6.4. Alkaline hydroxides ... 59
1.2.9. Conclusion of irradiation part ... 62
1.3. CONCLUSION ... 62
CHAPTER 2: MATERIALS AND METHODS ... 63
2.1 SAMPLES PREPARATION ... 63
2.1.1 C-S-H ... 63
2.1.2 Alkali uptake in C-S-H ... 65
2.1.3 C2S and C3S hydrates ... 66
2.1.4 Portlandite ... 66
2.2 FILTRATION AND CURING PROCEDURE ... 66
2.3 ANALYSIS OF FILTRATES... 68
2.3.1 ICP-AES analysis ... 68
2.3.2 Measurement of pH ... 68
2.3.3 Ion chromatography (IC) ... 68
2.4 CHARACTERIZATION BEFORE IRRADIATION ... 68
2.4.1 Purity ... 69
2.4.2 Water quantification ... 69
2.4.3 Porosity and specific surface area determination ... 70
2.5 IRRADIATION EXPERIMENTS ... 71
2.5.1 Gamma-rays irradiations ... 71
2.5.2 Swift Heavy ions irradiations ... 72
2.5.3 The linear accelerator LINAC ... 74
2.6 GAS ANALYSIS AND DETERMINATION OF RADIOLYTIC YIELDS... 76
2.7 CHARACTERIZATION AFTER IRRADIATION ... 76
2.7.1 Electron paramagnetic resonance spectrometry (EPR) ... 76
2.8 OTHER CHARACTERIZATIONS ... 78
2.8.1 Transmission electron microscopy ... 78
2.8.2 Wide and Small-Angle X-Ray Scattering (WAXS/ SAXS) ... 78
CHAPTER 3: MOLECULAR HYDROGEN PRODUCTION FROM C-S-H ... 80
8
3.1.1. Sample chemical composition... 80
3.1.2. The purity of C-S-H samples ... 82
3.1.3. Porosity and specific surface area ... 89
3.1.4. Wide and Small-Angle X-Ray Scattering (WAXS/ SAXS) ... 93
3.1.5. Effect of radiation on the structure ... 96
3.1.5.1. XRD ... 96
3.1.5.2. TGA ... 97
3.2. HYDROGEN PRODUCTION ... 98
3.2.1. Effect of the water amount and the nature of the C-S-H on gamma rays irradiation ... 98
3.2.2. Heavy ions irradiations ... 101
3.3. RADIATION-INDUCED DEFECTS ... 104
3.3.1. C/S ratio effect in C-S-H ... 104
3.3.2. Effect of water content ... 109
3.3.3. Effect of Temperature ... 110
CHAPTER 4: MOLECULAR HYDROGEN PRODUCTION FROM C2S/ C3S HYDRATES AND SYNTHETIC PORTLANDITE ... 116
4.1. CHARACTERIZATION ... 116
4.1.1. Sample chemical composition... 116
4.1.2. The purity of C2S/C3S hydrates and synthetic portlandite samples ... 116
4.1.3. Porosity and specific surface area ... 119
4.2. HYDROGEN PRODUCTION ... 120 4.3. RADIATION-INDUCED DEFECTS ... 122 4.3.1. C2S/ C3S hydrates ... 122 4.3.1.1. C3S hydrates ... 122 4.3.1.1.1. H signal ... 122 4.3.1.1.2. RID signal ... 125 4.3.1.2. C2S hydrates ... 126 4.3.1.3. Comparison C3S and C2S ... 127
CHAPTER 5: MOLECULAR HYDROGEN PRODUCTION FROM ALKALI SALT UPTAKE IN C-S-H ... 129
5.1. CHARACTERIZATION ... 129
5.1.1. Sample chemical composition... 129
5.1.2. The purity of C-S-H samples with alkali sorption ... 131
5.1.3. Porosity and specific surface area ... 134
5.2. H2 PRODUCTION FROM ALKALI-C-S-H ... 135
DISCUSSION ... 137
9 REFERENCES ... 152 ANNEX 1 ... 157 ANNEX 2 ... 158 ANNEX 3 ... 159 ANNEX 4 ... 162 ANNEX 5 ... 165 ANNEX 6 ... 168
10
List of Tables
Table 1. Surface area from BET theory of Analysed CSH samples measured from Nitrogen
adsorption volumetry [53] ... 27
Table 2. Surface area from BET theory of Analysed CSH samples measured from Water Vapour Isotherms [53]. ... 28
Table 3. Linear energy transfer (LET) in water for different types of radiation [69]. ... 40
Table 4. H2 radiolytic yields obtained as a function of the type of radiation and the pH. Gamma radiation and accelerated electrons have a LET value of 0.2-0.3 keV/ µm, whereas in the case of 5 MeV alpha particles, the LET value is 130 keV/ µm [74,75]. ... 44
Table 5. Molecular hydrogen radiolytic yields found in literature. ... 49
Table 6. Evolution of the dihydrogen radiolytic yield in hydrated glasses as a function of the pore size using 137Cs gamma rays [82]... 50
Table 7. Evolution of the dihydrogen radiolytic yield in dried glasses as a function of the pore size using gamma (137Cs) rays. Dried materials were baked at 140°C for 1 hour and then at 500°C for 6 hours [82]. ... 50
Table 8. Characteristic g-values of RID in irradiated materials. ... 61
Table 9. Notations of the C-S-H samples with different C/S ratio and cured at different relative humidity (RH). ... 64
Table 10. Ca/Si ratio and alkali concentrations used to prepare C-S-H at 20°C. ... 65
Table 11. Conditions of curing for samples. ... 67
Table 12. pH values and CaO and SiO2 concentrations of C-S-H synthetic solutions. ... 81
Table 13. Portlandite content determined by TG analysis between 410 and 500°C of C-S-H samples with different C/S ratio and cured at different relative humidity. The relative uncertainty is estimated to be 10%. ... 85
Table 14. Calcite content (550-750°C) calculated from thermogravimetry analysis between 550 and 750°C of C-S-H samples with different C/S ratio and cured at different relative humidity. The relative uncertainty is estimated to be 10%. ... 85
Table 15. Water content (ambient-300°C) calculated from thermogravimetry analysis of different C/S ratio samples cured at different relative humidity. The relative uncertainty is estimated to be 10%. ... 86
Table 16. Surface area from BET theory of C-S-H sample measured from Nitrogen and Water vapor isotherms. ... 93
11
Table 18. Hydrogen radiolytic yields (10-7 mol/J) (calculated with respect to the total energy received by the system) released from Gamma irradiated C-S-H samples with different C/S ratio hydrated at different RH at room temperature. Yields standard deviations are estimated to be 15% for all samples. ... 99 Table 19. Hydrogen radiolytic yields (10-7 mol/J) (calculated with respect to the energy received
solely by water) released from Gamma irradiated C-S-H samples with different C/S ratio hydrated at different RH at room temperature. Yields standard deviations are estimated to be 15% for all samples. ... 101 Table 20. Radiolytic yields of irradiated samples using heavy ions. ... 102 Table 21. Radiolytic yields of irradiated samples using gamma rays and heavy ions (calculated with respect to the total energy received by the system). ... 103 Table 22. The concentration of H atoms and RID and the corresponding radiation yields in different electron irradiated samples at doses 30 kGy (except 1.4 CSH, at dose 15kGy) at 77K, the experimental accuracy is estimated to be ±35%.. Hydrogen radiolytic yields released from Gamma irradiated CSH samples at room temperature are recalled, the experimental accuracy is estimated to be ±15%. ... 108 Table 23. Calcium concentrations and pH in solution of C2S and C3S samples. ... 116 Table 24. Summary of water content, portlandite, calcite, unreacted reactant and CSH content in the case of C2S/ C3S hydrates, synthetic/ commercial portlandite and 1.40 CSH at 85% RH. The relative uncertainty of water content, portlandite and calcite is estimated to be 10%. .. 118 Table 25. Surface area from BET theory of Analysed C2S/ C3S samples and synthetic portlandite measured from Nitrogen adsorption volumetry. ... 119 Table 26. Hydrogen radiolytic yields released from Gamma irradiated samples at room temperature. The error bars of samples are estimated to be 15%. Comparison with the literature. ... 120 Table 27. Experimental and theorical hydrogen radiolytic yields of C2S and C3S hydrates at room temperature. ... 121 Table 28. The concentration of centers in electron irradiated C2S/ C3S samples at doses 30 kGy at 100K. The error bar is 35%. ... 128 Table 29. Calculated composition of the synthesized phases. Measurement error: aqueous silicon, calcium, alkali ions and concentrations ±10%; pH ±0.1unit... 130 Table 30. Summary of the interlayer distance of 0.8 C-S-H with/ without alkali sorption. The error on the d001 value is estimated at 0.5 Å [121]. ... 132
12
Table 31. Summary of the amount of water content (from 25 to 300 ℃ , portlandite and calcite in the case of 0.8 C-S-H samples with/ without alkali sorption. The relative uncertainty of water content, portlandite and calcite is estimated to be 10%. ... 133 Table 32. Surface area from BET theory of 0.8 C-S-H sample measured from Nitrogen adsorption isotherms. ... 135 Table 33. Hydrogen radiolytic yields released from Gamma-rays irradiated alkali-C-S-H samples at room temperature. The experimental error on G(H2) are estimated to be 15%. .. 135
Table 34. The concentration of H atoms and RID and the corresponding radiation yields in different electron irradiated samples at doses 30 kGy (except 1.4 CSH, at dose 15kGy) at 77K, the experimental accuracy is estimated to be ±35%.. Hydrogen radiolytic yields released from Gamma irradiated CSH samples at room temperature are recalled, the experimental accuracy is estimated to be ±15%. ... 138 Table 35. Radiolytic yields G(H2) and G(O2) of irradiated CSH with and without NO3- using
gamma rays (calculated with respect to the total energy received by the system). ... 140 Table 36. Radiolytic yields of irradiated samples using gamma rays and heavy ions (calculated with respect to the total energy received by the system). ... 143 Table 37. Hydrogen radiolytic yields released from Gamma-rays irradiated alkali-C-S-H samples at room temperature. The experimental error on G(H2) is estimated to be 15%. .... 146 Table 38. The fraction of silicon atoms that belong to anhydrous phases containing silicon (alite, belite…), C-S-H and quartz, corrected from the relaxation effects. (Taken from [18]). ... 147 Table 39. Experimental and theoretical hydrogen radiolytic yields of cement paste at room temperature. ... 147
13
List of Figures
Figure 1. Simplified classification of radioactive waste according to its radioactivity and its
lifetime. Reproduced from [1]. ... 19
Figure 2. SEM images of the mortar specimens after 28 days of curing OPC [4] ... 20
Figure 3. 500-litre container for ILW [5] ... 20
Figure 1. 1. Evolution of the stoichiometry of C-S-H as a function of the hydroxide concentration ... 23
Figure 1. 2. X-ray powder diffraction of C-S-H with different Ca/Si ratio (circle indicates the presence of portlandite). Reproduced from [34]. ... 24
Figure 1. 3. Structure of 11Å tobermorite, Hamid [40], a/2=5.58 Å, b=7.39 Å, and c/2=11.389 Å, ... 25
Figure 1. 4. SEM micrograph of C-S-H, when C/S=1[41] ... 26
Figure 1. 5. Schematic representation of the stack of sheets for a C-S-H particle... 26
Figure 1. 6. Nitrogen and water vapor adsorption/desorption isotherms of C-S-H 0.6, 1.2 and 1.6 samples. [53] ... 28
Figure 1. 7. CM-II model. [56] Large gel pores (LGP), small gel pore (SGP), intraglobular pores are presented. ... 30
Figure 1. 8. Different forms of water in C-S-H. ... 31
Figure 1. 9. Curve of the C/S ratio of the hydrate versus the pH of the hydration solution [57]. ... 31
Figure 1. 10. Variation of the distance beween two calcium plans with the C/S ratio [57]. ... 32
Figure 1. 11. Ionizing and non-ionizing radiations [67]. ... 35
Figure 1. 12. Photoelectric effect [68]. ... 36
Figure 1. 13. Compton scattering by a weakly bound electron [68]. ... 37
Figure 1. 14. Electron-positron pair production [68]. ... 37
Figure 1. 15. The relative importance of various process of gamma radiation interaction with matter [67]. ... 38
Figure 1. 16. Main reactions occur in the three stages of water radiolysis. [71] ... 42
Figure 1. 17. Dependence of (primary radical and molecular yields) RMY in the 60Co y-irradiation of water on pH in the range 1.3 to 13. The accuracy of the yields was estimated to be 3%. ... 45
14
Figure 1. 18. Dihydrogen yield as a function of the oxide band gap in the γ-radiolysis of H2O
molecules absorbed on oxides. G (H2) is calculated with respect to the energy of γ rays directly
absorbed by the H2O molecules. (Reprinted from Ref. [80]) ... 47
Figure 1. 19. Hydrogen production from electron-irradiated AlOOH L and S (Large particle size and small particle size are denoted AlOOH L and AlOOH S respectively) with respect to water loading. Violet squares (AlOOH L). Cyan blue squares (AlOOH S). Black dotted line: primary radiolytic yield of liquid water [89]. ... 48
Figure 1. 20. Crystal structure of some clay minerals [96] ... 52
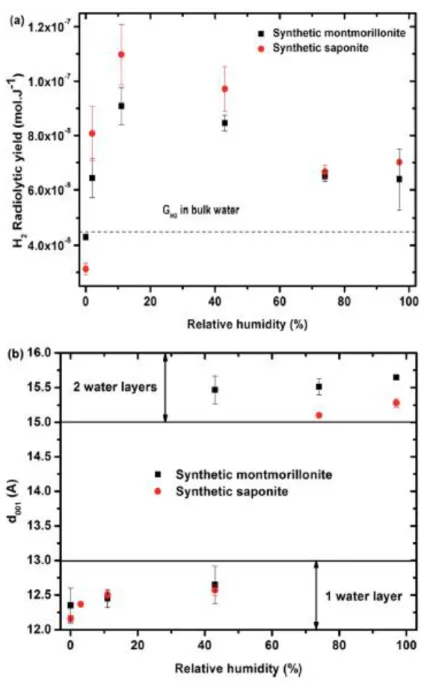
Figure 1. 21. H2 radiolytic yields as a function of the relative humidity for synthetic montmorillonite (black square) and saponite (red circle). The value obtained in liquid bulk water is given as a comparison (4.5 × 10⁻⁸ mol.J-1) to unravel the specific behaviour of confined water. (b) d001 distance as a function of the relative humidity obtained for synthetic montmorillonite (black square) and saponite (red circle). No value for montmorillonite at 3% RH is given here, as the assignment of the peaks was unlikely in this case. For the montmorillonite at 43% RH, two peaks were obtained that account for the simultaneous presence of 1 and 2 water layer(s) in the interlayer space [99]. ... 54
Figure 1. 22. Radiolytic hydrogen yields of Portland cement pastes as a function of the total amount of water. (Figure a: radiolytic yields of materials; Figure b: radiolytic yields nomarlized with regard to the amount of water of materials) [23] ... 56
Figure 1. 23. The structure of V-type centre (electron hole in a p oxygen orbital) [102]. ... 57
Figure 1. 24. Model representation of OHC1 and OHC2. The configuration of OHC2 changes with temperature. In the figure, the only low temperature configuration is presented [106]. . 59
Figure 2. 1. The evolution of temperature with time. ... 69
Figure 2. 2. 10ml glass ampoule after gamma irradiation. ... 71
Figure 2. 3. Sample holder for irradiation of ampoules. ... 72
Figure 2. 4. The bragg curve of 5 MeV α particles in C-S-H. ... 73
Figure 2. 5. IRRABAT device. ... 73
Figure 2. 6. 10ml ampoule after heavy ions irradiation. ... 74
Figure 2. 7. The EPR tube for electron beam irradiation. The yellow part is kapton tape that protects the name. The external diameter of tube is 4 mm. ... 75
Figure 2. 8. The formula of TEMPO ... 77
Figure 2. 9. Schematic view of a typical scattering experiment. ... 79
15
Figure 3. 2. Powder XRD patterns of the different C-S-H samples (From bottom to top: 0.80,
0.97, 1.14, 1.30 and 1.40 CSH RH=60%). ... 82
Figure 3. 3. Interlayer space of C-S-H samples deduced from XRD patterns as a function of the C/S ratio at different RH. The error on the d001 value is estimated at 0.5 Å. ... 83
Figure 3. 4. TG (solid line) and DTG (dash line) curves of 0.80, 0.97, 1.14, 1.30 and 1.40 C/S ratio CSH samples at RH 60%. DTG curves are given to illustrate the water loss and the detection of minor phases such as portlandite and calcium carbonate. ... 84
Figure 3. 5. TGA from 25 to 300 °C of 0.8 CSH according to relative humidity. ... 87
Figure 3. 6. TGA from 25 to 300 °C of CSH (C/S ratio=0.80, 0.97, 1.14, 1.30 and 1.40) cured at RH 75%. ... 87
Figure 3. 7. Mass percentage of water (free water, FW; and chemically bound water, CBW) as determined from TGA measurements in samples 0.80, 0.97, 1.14, 1.30 and 1.40 CSH as a function of relative humidity. ... 88
Figure 3. 8. Nitrogen adsorption/desorption isotherms of C/S ratio 0.97 CSH sample and the specific surface area as a function of the effective C/S ratio. ... 90
Figure 3. 9. Pore-size distribution curves of the CSH samples. ... 91
Figure 3. 10. Nitrogen (black solid line) and Water (blue dash line) vapor adsorption/desorption isotherm of 1.30 C-S-H. ... 92
Figure 3. 11. Model fitting result of SAXS data for 0.8 CSH RH 60%. ... 94
Figure 3. 12. C-S-H 0.8 RH 60% building block model. ... 94
Figure 3. 13. TEM image of CSH 1.40. ... 95
Figure 3. 14. X-ray diffraction patterns of 1.30 CSH RH 30% (blue line) and 0.80 CSH RH 85% (black line) before (solid line) and after (dash line) irradiation at 200 kGy. ... 96
Figure 3. 15. TG thermograms of synthetic portlandite samples RH 85% and freeze dried 10mM NaOH 0.8 CSH samples. ... 97
Figure 3. 16. Dose dependence of H2 production for hydrated 1.30 C-S-H equilibrated in different relative humidity at room temperature (freeze-dried, 30, 60, 75 and 85 % RH). ... 98
Figure 3. 17. Hydrogen production from C-S-H with respect to water loading. Black dotted line (primary radiolytic yield of liquid water). Yields standard deviations are estimated to be 15% for all samples. ... 100
Figure 3. 18. Hydrogen production at RT from C-S-H with different C/S at 85% RH irradiated with 36Ar18+ as a function of the dose, Yields standard deviations are estimated to be 20% for all samples. ... 102
16
Figure 3. 19. The normalized H2 radiolytic yields obtained by gamma irradiation (in solid pink
colour) and obtained by heavy ions irradiation (in black dash colour) (calculated with respect to the energy received solely by water) corrected different dose deposite in CSH and water at 85% RH as a function of the experimental C/S ratio. ... 104 Figure 3. 20. The EPR spectra of electron irradiated at 77 K C-S-H with different C/S ratio. ... 107 Figure 3. 21. The EPR spectra of electron irradiated at 77 K of 0.80 C-S-H with different relative humidity. ... 109 Figure 3. 22. EPR spectra of electron irradiated at 77 K of C-S-H with C/S=1.30 and annealed at different temperatures. All the spectra were recorded at 100 K. The dotted lines represent a zoom of the low field zone. For each curve, the factor of magnification is specified on the graph. ... 111 Figure 3. 23. Evolution with the temperature of the low field region of EPR spectra of electron irradiated at 77 K of C-S-H with C/S=1.30. ... 112 Figure 3. 24. Temperature evolution of the total intensity of the RID signal (blue points) and the height of the RID I signal (red points). ... 113 Figure 3. 25. A plot of ∆1𝐶𝑛𝑜𝑟𝑚. as a function of T-1 ... 114 Figure 3. 26. Comparison of the EPR spectra of 1.30 C-S-H (blue curve) and portlandite (red curve) irradiated at 77 K and annealed at 280 K. The spectra were recorded at 100 K. ... 115 Figure 4. 1. Powder XRD patterns of the synthetic/ commercial portlandite and C2S/ C3S hydrates at RH 85%. ... 117 Figure 4. 2. TG and DTG curve of C2S hydrates at RH 85%. ... 118 Figure 4. 3. Nitrogen adsorption/desorption isotherms of C3S hydrates sample. ... 119 Figure 4. 4. EPR spectra of H signal of electron irradiated C3S hydrates at 77K and 30kGy recorded at 100K (blue), 110 K (red) and 150K (green). ... 123 Figure 4. 5. The evolution of the intensity of the signal as a function of the temperature. .... 123 Figure 4. 6. Arrhenius plot of -∆ln(Cnorm. (T2)) and ∆(1⁄(Cnorm. (T2)). ... 124
Figure 4. 7. EPR spectrum of C3S irradiated at 77K and recorded at 100K. ... 126 Figure 4. 8. The EPR spectrum of C2S sample irradiated at 77 K and recorded at 100 K. .. 127 Figure 4. 9. Part of the EPR spectrum of C2S sample is displayed, showing the hyperfine peaks more clearly. ... 127 Figure 5. 1. Powder XRD patterns of C-S-H (C/S ratio =0.8) equilibrated with KOH solutions of increasing concentration (10Mm and 50mM) or with an alkali-free solution (C-S-H). .... 132
17
Figure 5. 2. TGA curves of C-S-H (C/S ratio =0.8) equilibrated with NaOH/ KOH solutions of increasing concentration (10mM and 50mM) or with an alkali-free solution (C-S-H). ... 133 Figure 6. 1. Hydrogen production from C-S-H with respect to water loading. Black dotted line (primary radiolytic yield of liquid water). Yields standard deviations are estimated to be 15% for all samples. ... 137 Figure 6. 2. Electronic configuration of Na+ and K+………... 139 Figure 6. 3. Comparison of radiolytic yields G(H2) in mol J-1 obtained for Portland cement,
calcium-aluminate cement(Cement Fondu) and Phospho-magnesium cement (taken from [15] ... 148 Figure 7. 1 The scheme summarize the different reactions possible in the materials studied in this work. ... 150
18
Glossary
Cement chemistry notations:
C=CaO S=SiO2 H=H2O
Hydrated phases:
C-S-H Calcium silicate hydrate
C2S hydrates Dicalcium silicate hydrate C3S hydrates Tricalcium silicate hydrate
Techniques:
ICP-AES Inductively coupled plasma atomic emission spectroscopy IC Ion chromatography
XRD X-Ray diffraction
TGA Thermogravimetric analysis DVS Dynamic vapor sorption
EPR Electron paramagnetic resonance TEM Transmission electron microscope
WAXS/ SAXS Wide and Small-Angle X-Ray Scattering
Divers:
OPC Ordinary Portland cement
BET Brunauer-Emmett-Teller LET Linear energy transfer
Micro-GC Micro-gas chromatography RID Radiation induced defect
19
INTRODUCTION
Radioactive waste can be classified according to a number of criteria: origin, physical and chemical nature, level and type of radioactivity, lifetime, etc. In France, radioactive waste is managed according to classification based on:
- Its radioactivity - Its lifetime
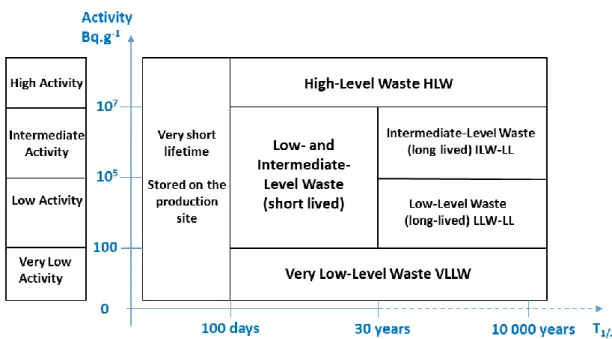
There are six categories of radioactive waste (Figure 1):
Figure 1. Simplified classification of radioactive waste according to its radioactivity and its lifetime. Reproduced from [1].
According to ANDRA’s National Inventory of Radioactive Materials and Waste 2012, as at the end of 2010, LILW-SL accounted for 63% of the total volume of radioactive waste
produced in France, or 830,000 m3 and 0.02% of the total radioactivity of radioactive waste in
France. Those low and intermediate level wastes issued from the dismantling of nuclear facilities are usually conditioned in calcium silicate cement to ensure the stability and the confinement of the radioactivity for disposal and future geological storage (see Figure 2).
The use of a cement matrix has been considered because it has many advantages. It is inexpensive, easy to produce and can be tailored to reach various different properties such as soundness, strength. In addition, the alkalinity of certain cements allows them to insolubilize a large number of radionuclides and thus limit their diffusion [2]. Cementitious matrices thus rank as reference materials for low and intermediate-level waste conditioning, whether for their storage or their surface or geological disposal.
20
However, the conditioning of radioactive waste in a cementitious matrix poses many problems when cement are submitted to ionizing radiation, from the interaction between cement and radioactive waste [3].
Concrete is a composite material composed of fine and coarse aggregates bonded by cement paste. The cement paste is an assembly of different anhydrous phases and hydrated phases or hydroxides (see Figure 3), containing a significant amount of water that is trapped in its porosity. Therefore, radiation effects are encountered when the cement paste is exposed under ionizing radiation. Numerous studies have therefore conducted to determine the impact of radiation [6-14].
Structure modifications and radiolytic gas production under ionizing radiation have been studied [15]. The results show that until very high dose (GGy), the hydrates exhibit a good structural resistance without amorphization under irradiation.
As a matter of fact, irradiation consequences mostly emerge as the residual water radiolysis and gaseous dihydrogen emanation, to consider long-term storage. Indeed these packages of waste need to meet the criteria defined by the ANDRA who requires the limitation
of H2 released. Therefore, in our study, we only focused on hydrogen production.
In reality, when cemented waste packages display a complex radiological inventory with fission (or activation) products and actinides (fuel clads, for example), there are different radiation field emitted, such as γ rays, β rays and α rays. Therefore, different radiation sources were used in our studies, such as gamma rays, electron and heavy ions beam radiations.
Figure 2. 500-litre container for ILW [4]
Figure 3. SEM images of the mortar specimens after 28 days of curing OPC [5]
21
Cement paste is mainly composed of calcium silicate hydrates (abbreviated C-S-H) and portlandite. It also contains residual clinker (that only partially reacted with water) such as alite, belite and ferrite. Since it is a material with various possible compositions and a complex nano- and micro- structure [16,17], the radiolytic process leading to hydrogen release in such material is challenging and not well understood. The behavior of cement paste [6,7] [17-21] under irradiation is usually described in the literature in terms of the radiolysis of pore water and therefore the radiolytic hydrogen emission. However, this is not completely understood and recent studies have shown that, besides the pore water, the water of hydration ("bound") of different hydrates contributes as well to the radiolytic hydrogen production [22,23]. In such hydrated compounds, radiolysis is not well described and the literature is quite limited.
The purpose of the present work is to understand the water radiolysis in the calcium silicate hydrates (C-S-H), which is the main hydration product of Portland cement and how the interface between solid and water can modify the radiolytic mechanisms.
We tried to take into account the fact that:
i) The irradiation could occur in different humidity
22
CHAPTER 1: Literature review
In this chapter, the hydration of Portland cement, the structure of Calcium Silicate Hydrates usually will be presented. Then the basics of the interaction of radiation with matter will be introduced. At the end of the chapter, state-of-the-art on the radiolysis of absorbed and confined water in solids will be presented.
1.1. Cement chemistry 1.1.1. Portland cement
Ordinary Portland cement (OPC) is made by heating limestone and clay in a kiln at about 1450°C, which chemically transforms into hard nodules called clinker. The typical oxides composition is about 67% CaO, 22% SiO2, 5% Al2O3, 3% Fe2O3 and 3% other components
constituting the four major phases, called alite (3CaO SiO2), belite (2CaO SiO2), aluminate and
ferrite. Several other phases, such as alkali sulfates and calcium oxide, are normally present in minor amounts.
The clinker is mixed with a few percents of calcium sulfate to be grinded and resulting in the finely ground powder named cement. The calcium sulfate hydrate, usually called gypsum, is actually added to control the hydration mechanism and to improve the strength development.
The hardening to form the well-known final material results from hydration reactions between the major phases contained in cement powder and water. This hydration process leads to the formation of hydrated calcium silicates (C-S-H) (50%), the main hydrate of OPC,
portlandite (Ca(OH)2) (20%), as well as hydrated calcium aluminates and sulfoaluminates
(ettringite and monosulfoaluminate) [24].
1.1.2. Calcium silicate hydrate
The calcium silicate hydrate, the main product of the reaction of Portland cement with
23 1.1.2.1. Chemical composition
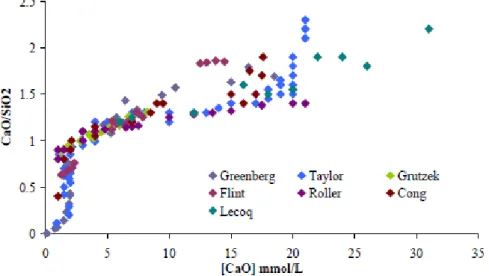
The chemical composition of calcium silicate hydrate (C-S-H) is thought to substantially affect many properties of concrete, and is primarily responsible for the strength in cement based materials [24]. The C-S-H composition evolution with C/S ratio were examined by many authors [25-31] (Figure 1. 1). Two main types of results are published and analysed: the first,
from C-S-H directly made from CaO and SiO2 diluted suspensions, the second are related to the
C-S-H formed in paste of Portland cement or C3S with or without mineral additions such as
silica fumes, slag or fly ashes. The first type of preparation limits the C/S ratio of C-S-H between about 0.6 to 1.5 [32]. The second types of studies devoted to C-S-H from cement pastes, reveals an higher C/S ratio of C-S-H, about 1.75 [32].
Figure 1. 1. Evolution of the stoichiometry of C-S-H as a function of the hydroxide concentration Calcium solution (Taylor, 1950) (Cong and Kirkpatrick, 1996) (Lecoq, 1993) (Grutzek,
1989) (Roller, 1940) (Flint and Wells, 1934) (Greenberg, 1965) from Courault [38].
1.1.2.2. Structure
Whatever was the C/S ratio between 0.7 and 1.5, X-ray diffraction patterns are very similar. Although C-S-H is poorly crystalline, some diffraction peaks can be observed, they are shown in Figure 1. 2. In XRD patterns, the maximum at 7.2-9.3 ̊ 2ʘ corresponds to (001) reflection using the structural model from [33][35][37][51]. It varies in position depending on the distance between two calcium plans in the structure of the C-S-H.
24
Figure 1. 2. X-ray powder diffraction of C-S-H with different Ca/Si ratio (circle indicates the presence of portlandite). Reproduced from [34].
The most accepted descriptions are based on the crystal structures of natural minerals: jennite [35,36] and tobermorite [37][51]. In tobermorite, a non-hydroxylated CaO layer is present, while in jennite, calcium in the main layer is hydroxylated. Three different types of tobermorite are generally distinguished: 14Å, 11Å or 9Å with different basal spacing structure and water content [39]. The most used model to characterize C-S-H is the 11Å tobermorite. It can be described as a calcium plan with silica chains on its both sides organized in a “drieierketten” structure. A repeated chain of three silica tetrahedral are shown below in Figure 1. 3. Two of these silica tetrahera are linked to the calcium planes and are called pairing tetrahedra, while the third tetrahedron, linking the two pairing tetrahedral, is called bridging tetrahedron. The layers are stacked together and are separated by an interlayer space, which may contain water molecules, calcium ions, alkalis and other ions [40].
25
Figure 1. 3. Structure of 11Å tobermorite, Hamid [40], a/2=5.58 Å, b=7.39 Å, and c/2=11.389 Å, 1.1.3. Specific surfaces of CSH
CSH exhibits layered or sheet-shape objects arranged in a dense and laminar pattern, as shown on Figure 1. 4.
26
Figure 1. 4. SEM micrograph of C-S-H, when C/S=1 [41]
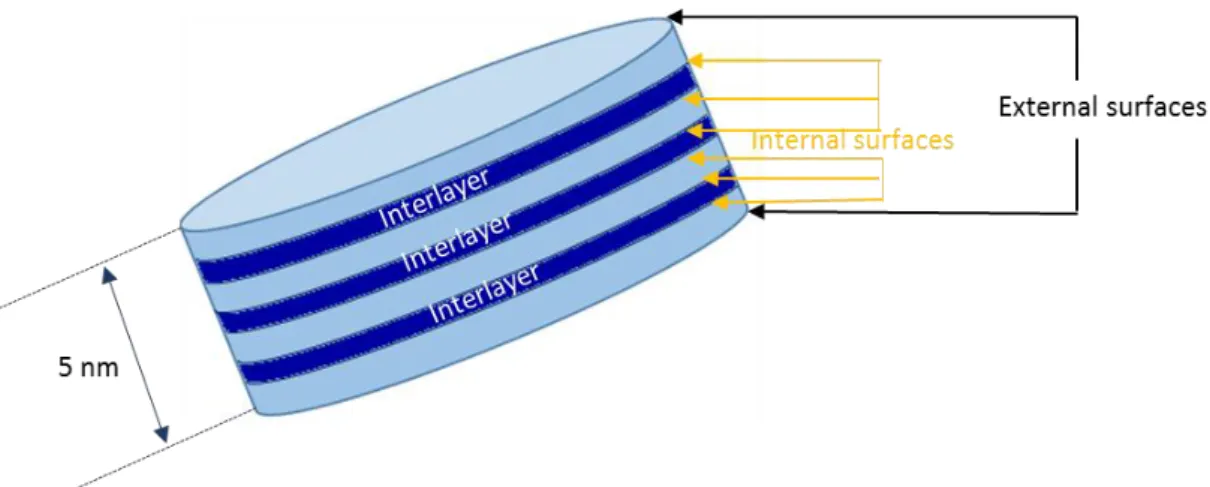
The morphology of the C-S-H gel at the nanoscale has also been investigated by small-angle X-ray [42-45] and neutron scattering [46-49]: the average number of stacking layers increases with the water content, from 4.5 (with 10% water content) to 11 (with 30% water content) [50], the total thickness of the globule is 4-10 nm. The observation with atomic force
microscope supposes those C-S-H nanoparticles are 60×30 nm2 and 5 nm thick [51]. The
crystallite size perpendicular to the layer plane is 4–5 nm [52].
Figure 1. 5. Schematic representation of the stack of sheets for a C-S-H particle.
As with many layered compounds, external and internal (interlayer) surfaces (see Figure 1. 5) of C-S-H enable multilayer water molecules adsorption to the hydrophilic surfaces. In order to investigate the changing of the developed surface depending on the C/S, the
specific surface area has been investigated with different gases or vapors, such as N2, H2O, and
27
Surface chemical theory;
The knowledge of the cross-section of one molecule of the gas used;
The number of molecules required to cover a surface completely.
Table 1. Surface area from BET theory of Analysed CSH samples measured from Nitrogen adsorption volumetry [53] Samples Effective C/S ratio SBET (m2/g)
CSH 0.6 0.69 408
CSH 0.8 0.82 356
CSH 1.0 1.06 271
CSH 1.2 1.23 194
CSH 1.6 1.42 231
In the work of C. Roosz and co-workers [53], the calculated BET specific surface areas
(SBET) decreased with increasing C/S ratio from 408 (C/S=0.6) to 194 m2/g (C/S=1.2) (see Table
1). The SBET evolution could be explained by considering an increase of the particle size from 4
(CSH 0.6) to 8 nm (C-S-H 1.2) [53], inducing a decrease of the particle external surface. At higher ratios, C-S-H with C/S=1.6 displays a higher value (231 m2/g) than C-S-H with C/S=1.2. This could be attributed to the precipitation of portlandite nanoparticles during the drying step, which tends to increase the surface area of the C-S-H with C/S=1.6 [53].
The water distribution in the C-S-H microstructure has been described by Water vapour
isotherms experiments [53]. The calculated BET specific surface areas (SBET) for the adsorption
branch decrease with increasing Ca/Si from 431 (CSH 0.6) down to 180 m2/g (CSH 1.6) (Table
28
Figure 1. 6. Nitrogen and water vapor adsorption/desorption isotherms of C-S-H 0.6, 1.2 and 1.6 samples. [53]
Table 2. Surface area from BET theory of Analysed CSH samples measured from Water Vapour Isotherms [53]. Samples Effective C/S ratio SBET (m2/g)
CSH 0.6 0.69 431
CSH 1.2 1.23 214
29 1.1.3.1. Surface charge
The bridging silicate tetrahedra and the tetrahedra at the ends of the chains possess unlinked oxygen atoms, forming Si-OH groups that are also called silanol sites. The increase of the pH induces a partial dissociation of silanol group according to the following equilibrium to give a negative charge [54]∶
≡ 𝑆𝑖𝑂𝐻 + 𝐻𝑂− → ≡ 𝑆𝑖𝑂−+ 𝐻 2𝑂
Since C-S-H are stable in alkaline solutions, the silanol sites are therefore carrying a
negative charge. This charge is compensated by the Ca2+ present in the interlayer or on the
surface to ensure electroneutrality.
1.1.4. Texturation
Based on the experimental data obtained about C-S-H, Jennings proposes a nanostructural model describing quantitatively the organisation of the elementary bricks and the porous network. The assembly of spheroidal elementary bricks flocculate to form larger and well-defined units is considered [55]. These elemental units are "disks" with a section transverse 5 nm described previously [56]. This textural pattern also defines distinct pores, interlayer spaces, which allows to model the density of C-S-H under different relative humidity conditions (Figure 1. 7). The globules are particles of nanometer dimension that assemble into statistically well-defined patterns. Water-filled spaces include:
- The interlayer spaces= 0.9-1.4 nm, refers to the porosity inside the globule, - The intraglobule spaces (IGP) < 1 nm, refers to the porosity inside the globule - The small gel pores (SGP) = 1-3 nm, refers to very small porosity trapped between
the globules ,
- The large gel pores (LGP) = 3-12 nm, refer to porosity trapped between the globules. In each type of pores, the water has a specific thermodynamic character. The most tightly bound water is absorbed on the surface of the globules and within the IGP [56].
30
Figure 1. 7. Large gel pores (LGP), small gel pore (SGP), intraglobular pores are presented in CM-II model [56].
This model also asserts the irreversible decrease in intercrystalline porosity due to drying, temperature variations and ageing.
1.1.5. Different types of water
Water, and more generally OH groups are the source of radiolytic H2. In hydrates like
C-S-H, different types of water can be found in the C-S-H and have to be discussed because of their different contribution under irradiation (see Figure 1. 8):
Water of crystallization: water located in the interlayer space which is not removed
when heating and/or drying sample under vacuum.
Structural water which exists as a hydroxyl groups from silanol (Si-OH) and Ca-OH in
the C-S-H structure.
Evaporable water. It can be divided into two subcategories depending on its physical
state:
o In a fully saturated pore volume, several layers of water molecules are adsorbed on the pore surfaces by attractive forces. This particular state of water is called
“bound water”. Which can be expelled from sample without alter its structure.
o The other water molecules fall into the second subcategory of evaporable water called “liquid water”. It is located in the middle of wide enough pores (> 2 nm).
31
Figure 1. 8. Different forms of water in C-S-H (adapted from [56]). 1.1.6. Modification of C-S-H with the C/S ratio
In addition to the structural variations observed previously (see chapter 1.1.1.2 and 1.1.3), the C/S ratio also affects the interlayer distance and the pH of the equilibrium solution (Figure 1. 9 and Figure 1. 10) [57][120]. The distance between two calcium planes decreases with increasing C/S ratio. This is highlighted with XRD analyses by the shift of the position of the lowest angles peak with the C/S ratio from 14 Å at C/S = 0.8 to 12 Å at C/S = 1.2. The distance between two calcium planes is decreasing brutally when the C/S ratio reach the 1.0 value. On the contrary, the pH increases with the increase of the C/S ratio. The transition of two types of C-S-H phases takes place in both cases around the C/S ratio equals to 1.
Figure 1. 9. Curve of the C/S ratio of the hydrate versus the pH of the hydration solution [57].
9.5 10.0 10.5 11.0 11.5 12.0 12.5 13.0 0.6 0.8 1.0 1.2 1.4 1.6 C/S ratio pH
32
Figure 1. 10. Variation of the distance between two calcium plans with the C/S ratio [120]. 1.1.7. Uptake in C-S-H
One of the interests of cementitious materials is that hydrates and in particular C-S-H are very flexible materials which can incorporate several species provided by the clinker, supplementary cementitious materials (SCMs) or radionuclide in case of conditioning applications, as for instance:
- Radionuclide: 90Sr substitutes the Ca2+ ions in C-S-H [58]. Cs retention was found to
decrease with increasing SiO2:CaO ratio [59]. Iwaida et al. [60] observed a
shortening of the silicate chains in C-S-H which had sorbed Cs, indicating breakage of the silicate chains had occurred.
- Aluminate, as a replacement of silicate in the chain.
- Alkali: as a substitution of a proton charge balancing the silanol group [61-63] or a calcium ion (Ca2+) in the interlayer [62,63], or (iii) by filling an empty site in the interlayer [63].
These incorporations lead to a modification of their structure and can also affect hydration kinetics, hydrated phase assemblage, pore solution chemistry and early-age properties of cements [64].
33
1.1.8. Carbonation of C-S-H
It is necessary to notice that the carbonation of C-S-H may happen during long storage
time. In storage environment, the C-S-H react with CO2 or CO32- ions in order to form different
polymorph of CaCO3. Wet or moist materials are especially susceptible to be attacked, but dry
ones are not immune [65]. Four polymorphs of calcium carbonate exist with increasing stability: amorphous calcium carbonate, vaterite, aragonite, and calcite [65].
Grove et al. [66] studies the changes of hydrated C3S pastes in a CO2 environment. XRD
results indicate calcite was the most dominant polymorph of calcium carbonate, with some vaterite.
1.1.9. Conclusion
This first part gives a quick overview of Portland cement chemistry with a specific focus on the composition and the structure of Calcium silicate hydrates (C-S-H). As the main hydrate of Portland cement, we assume that the improvement of the understanding of the behaviour of C-S-H under irradiation is of great interest: the structure of the hydrate, the nature of the water engaged and the composition of C-S-H can be easily modified and consequently change radiolytic gas production.
34
1.2. Interaction of radiations with matter
In the context of nuclear industry, it is important to control the two main effects of
irradiation on cementitious materials: on the one hand, the release of H2 issued from the
radiolysis of the water which can lead to reach the flammability threshold. On the other hand, structural modifications (crystal structure, porosity, dehydration), which can alter the
mechanical properties of the materials. But in our study, we only focus on the H2 production.
In this part, a general review of radiation interaction with matter will be presented. Then, it gives an overview of the parameters influencing the production of gas under irradiation and radiolysis data in analogous materials available in the literature in connection with our study.
1.2.1. Type of radiation
Radiation chemistry is a subject that deals with the chemical changes induced by high energy radiation. The radiations usually used in radiation chemical studies are high energy photon (X−rays, γ rays) or charged particles (electrons, α particles, heavy ions etc) [67]. All these particles can cause the ionizing of the medium in which they are absorbed, so they are also often named “ionizing radiation. Ionization means the removal of electrons from atoms of the medium. In order to remove an electron from an atom, a certain amount of energy must be transferred to the atom. According to the law of conservation of energy, this amount of energy is equal to the decrease in kinetic energy of the particle that causes ionization. (Figure 1. 11).
The most basic difference between photochemistry and radiation chemistry is that in the former the energy is lost selectively to a chosen molecule, while in the latter the energy is lost to each component in proportion to its electron density.
35
Figure 1. 11. Ionizing and non-ionizing radiations [67]. 1.2.2. Direct ionizing radiation and indirect ionizing radiation
The direct ionizing radiation is composed of high-energy charged particles, which ionize atoms of the material due to Coulomb interaction with their electrons. Such particles are, e.g.,
high-energy electrons and positrons (β-radiation), high-energy 4He nuclei (α-radiation), and
various other nuclei, e.g., accelerated ions (ion beams).
Indirectly ionizing radiation is composed of neutral particles that do not directly ionize atoms or do that very infrequently, but due to interactions of those particles with matter, high-energy free charged particles are occasionally emitted. The latter particles directly ionize atoms of the medium. Examples of indirectly ionizing radiation are high-energy photons (vacuum ultraviolet, X-ray, and gamma radiation) and neutrons of any energy (neutrons are special and interact only with nuclei to emit protons).
36
1.2.3. Types of interactions with matter
In the initial interaction of an incident particle with any molecules, there is an inelastic collision, where the kinetic energy of the particle is completely or partially transferred into the molecules. The way of radiation energy given to a molecule depends predominantly on the type of radiation [68].
1.2.3.1. Interaction of photons (X-rays, γ rays, Extreme UV) with matter
Photons are electromagnetic radiation with zero mass, zero charge, and a velocity that is always c, the speed of light. Because they are electrically neutral, they do not steadily lose energy via Coulomb interactions with atomic electrons, unlike charged particles. There are three energy loss mechanisms by photons interaction with matter.
(1) Photoelectric effect (at photon energy ˂ 0.1 MeV). In this case, one electron from an inner shell is ejected when it collides with a photon (Figure 1. 12).
37
(2) Compton scattering (at 0.1 MeV > photon energy > 1 MeV). The photon collides with an electron and gives up part of its energy to the electron (Figure 1. 13).
(3) Pair production (at photon energy > 1 MeV). It produces an electron and a positron (Figure 1. 14).
Figure 1. 14. Electron-positron pair production [68].
With increase in photon energy (Figure 1. 15), the dominant interaction changes from
photoelectric to Compton to pair production. For 60Co ɣ-rays, almost the entire interaction is
induced by the Compton effect [67], producing electrons of 1 MeV energy and below.
38
39
1.2.3.2. Interaction of charged particles (electron, heavy ions, α particles) with matter
The basic mechanism for the slowing down of a moving charged particle is Coulombic interactions between the particle and electrons in the medium. Electrons lose energy by exciting and ionizing atoms along trajectory.
However, heavy particles may act also in the medium through ballistic (or nuclear) collisions when their energy is low or intermediate. A nuclear collision occurs when heavy charged particles interact with atomic nuclei. The putative role of this regime in our experiments will be discussed later.
1.2.4. Definition of LET
An important factor that distinguishes different radiation types from one another is the linear energy transfer (LET), which is the rate at which the radiation loses energy with distance travelled through the absorber.
It describes how much energy an ionizing particle transfers to the material transverse
per unit distance. Therefore, it is also called stopping power. The unit is keV.μm-1. In
mathematic formula (Bethe Block), it is defined as [69]:
𝐿𝐸𝑇 = −(𝑑𝐸 𝑑𝑥) (1) − (𝑑𝐸 𝑑𝑥) = 4 𝜋 𝑧2 𝑒4 𝑛 𝑁 𝑚 𝑣𝑖2 𝑙𝑛( 2 𝑚 𝑣𝑖2 𝐼 ) (2)
z = atomic number of the heavy particle, e = magnitude of the electron charge,
n = number of electrons per unit volume in the medium, m = electron rest mass,
40 vi = speed of the incident particle,
I = mean excitation energy of the medium.
The stopping power is proportional to z2. It increases rapidly at low energies, reaches a
maximum and decreases gradually with increasing energy. Low LET species are usually low mass, either photons or electron mass species (β particles, positrons) and interact sparsely along their path through the absorber, leading to isolated regions of reactive radical species. High LET species are usually greater in mass than one electron, for example α particles, and lose energy rapidly resulting in a cluster of ionization events in close proximity to one another. Consequently, the heavy particle travels a relatively short distance from its origin and due to the dense geometry of track formed by radiation, the initial spurs reaction become much fast and probability of recombination reactions of each species is accelerated to be higher.
The LET increases in the following order:
y-rays and high energy electrons < protons < deuterons < particles < heavy ions (see Table 3)
Table 3. Linear energy transfer (LET) in water for different types of radiation [69].
Rays LET (keV/µm)
Gamma (photons) 1 MeV Gamma (photons) 100 keV
0.23 0.70 Beta (electrons) 1 MeV
Beta (electrons) 100 keV
0.23 0.70
Fast neutrons 2.5 MeV 40
Alpha (helium nucleus) 5 MeV 136
1.2.5. Definition of Radiolytic yield
Radiolytic yields present the results of quantitative research on the chemical effects of ionizing radiation. The formula is as followed:
𝐺 =𝑁𝑢𝑚𝑏𝑒𝑟 𝑜𝑓 𝑠𝑝𝑒𝑐𝑖𝑒𝑠 𝑓𝑜𝑟𝑚𝑒𝑑 𝑜𝑟 𝑑𝑖𝑠𝑝𝑝𝑒𝑎𝑟𝑒𝑑
41
The commonly used unit of radiolytic yield is mol.J−1, and in the early literature the unit
is molecules /100 eV. They could be transferred into each other by:
1 molecule (100 eV) −1 = 1.036 ×10⁻⁷ mol.J−1 (4)
1.2.6. Elastic or inelastic collisions
In practice, for some given irradiation conditions, it is important to determine what is the main process that is responsible for defects creation. Then the ratio of the number of defects created by inelastic collisions 𝑁𝑖𝑛𝑒𝑙𝑎𝑠. to the number of atoms displace d by elastic collisions 𝑁𝑒𝑙𝑎𝑠. can be evaluated:
(5)
Where (−dEdx)inelas is the stopping power for inelastic collisions (unity: MeV.cm2.g-1), 𝐺 is
the yield of formation of defects and 𝑁0 is the number of atoms/cm2 and 𝜎𝑑 defect formation
cross section cm2.
It is estimated that if electron energy exceeded 1 MeV and G exceeds 10-10 mol/J, the
42
1.2.7. Radiolysis of Water
1.2.7.1. Liquid water
The radiolysis of water has been studied extensively since the beginning of radiation chemistry. In this section, the radiolysis of liquid water phenomena is described, which may help us to understand the radiolysis of different types of water. The value of radiolytic yield of
H2 formed in liquid water is a reference for us to compare with our future results.
Figure 1. 16. Main reactions occur in the three stages of water radiolysis [71] [72].
Typically, water radiolysis follows two main stages: the non-homogenous and homogenous stages. The non-homogenous stages contains three steps depending on the time scales [71][72]: the physical step, the physico-chemical step and the chemical step. (see Figure 1. 16).
(1) In the physical step, the initial event is the transfer of a sufficient energy in order to excite and ionize water molecules:
𝐻2𝑂 𝐼𝑜𝑛𝑖𝑧𝑖𝑛𝑔 𝑟𝑎𝑑𝑖𝑎𝑡𝑖𝑜𝑛 → 𝐻2𝑂+°+ 𝑒− (6) 𝐻2𝑂 𝐼𝑜𝑛𝑖𝑧𝑖𝑛𝑔 𝑟𝑎𝑑𝑖𝑎𝑡𝑖𝑜𝑛 → 𝐻2𝑂∗ (7)
43
(2) In the physico-chemical step (10-15 - 10-12), these first three initial species ( H
2O+°, 𝑒−,
H2O*) begin to diffuse in the medium and eventually react with each other.
The excited and ionized molecules relax by dissociative relaxation:
𝐻2𝑂∗ → 𝐻𝑂° + 𝐻° (8)
Or according to an ion-molecule reaction:
𝐻2𝑂+°+ 𝐻
2𝑂 → 𝐻3𝑂++ 𝐻𝑂° (9)
After H2O ionization, two events can take place: the recombination of electron-hole or
the electron thermalization:
𝑒− → 𝑒
ℎ𝑦𝑑− (10)
In chemical stage (10-12 - 10-6), the species, produced in the spurs, begin to diffuse randomly by reacting with each other in the regions of high local concentrations. However, some of these species escape from the reactions in the tracks and become homogeneously distributed in the medium. The escaped species can react with each other or alternatively with the solute.
Finally, water radiolysis can be written as follows: 𝐻2𝑂 𝐼𝑜𝑛𝑖𝑧𝑖𝑛𝑔
𝑟𝑎𝑑𝑖𝑎𝑡𝑖𝑜𝑛
→ 𝑒𝑎𝑞− , 𝐻𝑂°, 𝐻°, 𝐻𝑂2°, 𝐻3𝑂+, 𝑂𝐻−, 𝐻2𝑂2, 𝐻2 (11)
It is important to point out that the dioxygen O2 is not a primary species in the radiolysis of
water.
According to the time stages, the radiolytic yield is often classified as three type: (1) Initial radiolytic yield, which is noted as G°(X). This radiolytic yield refers to the yield
of ions or excited states (X) in the end of physicochemical stage ~ 10−12 s. It is very difficult to
44
(2) Primary radiolytic yield which is noted as g(X). g(X) corresponds to the transient species, radicals or molecules measured at the time when the homogenous distribution is
achieved ~ 10−7 s after the passage of ionizing radiation. The value of g(X) is normally lower
than G°(X) due to the spurs reactions.
(3) Global or apparent radiolytic yield which is noted as G(X). This yield represent some stable molecules which is measured using steady state method at relative longer time.
In our study, only the global radiolytic yields are considered. 1.2.7.2. pH effect on G values
However, the escape yields (see Table 4) depend on several parameters, such as LET of the radiation and the pH (see Figure 1. 17) [73][75].
Table 4. H2 radiolytic yields obtained as a function of the type of radiation and the pH. Gamma radiation and
accelerated electrons have a LET value of 0.2-0.3 keV/ µm, whereas in the case of 5 MeV alpha particles, the LET value is 130 keV/ µm [74,75].
Radiations G(H2) × 10-6 (mol/J)
Gamma electrons (0.1-10 MeV)
pH = 3-11 0.045
Gamma electrons (0.1-10 MeV)
pH = 0.5 0.041
5 MeV Alpha particles (LET=130 keV/µm)
pH = 13
45
Figure 1. 17. Dependence of (primary radical and molecular yields) RMY in the 60Co y-irradiation of water on pH in
the range 1.3 to 13. The accuracy of the yields was estimated to be 3%.
1.2.7.3. LET effects on G values
The radiolytic yields of the molecular products (H2 and H2O2) increase with LET while
those of the radicals (𝑒𝑎𝑞− , H°, HO°) decrease as a result of an increase of the density of ionizations in the tracks. Thus, radicals recombine more efficiently with high LET particles (Intratrack radical processes becoming increasingly important) favoring the formation of molecular species [73].
Continuous irradiation by low-LET radiation is known to lead to very low steady-state concentrations of dihydrogen and hydrogen peroxide (and the values presented in Table 4 are maximum values) whereas high LET radiation can form significant amounts of these products. The mechanism accounting for this behaviour has been proposed by Allen [76,77]. Reactions (12) and (13) make up a chain reaction in which water molecules are formed again; the rate of
destruction of H2 and H2O2 is equal to their production rate in water. This chain reaction is
propagated by the H° atom and the HO°radical. Therefore, the higher their concentration, the
46
𝐻𝑂°+ 𝐻
2→ 𝐻2𝑂 + 𝐻° (12)
𝐻°+ 𝐻
2𝑂2→ 𝐻2𝑂 +𝐻𝑂° (13)
1.2.8. Irradiation in materials by types of water
C-S-H are complex material that can present different types of water. As it’s well known, water, and more generally OH groups are the source of dihydrogen, each type of water has a different behaviour with respect to radiolysis:
-adsorbed water, on the surface of the spheroidal elementary bricks -water of the hydrates
-pore water
Even if bulk water radiolysis is well known, many questions remain about the radiolysis of adsorbed and confined water.
1.2.8.1. Adsorbed water
The radiolysis of water can be strongly affected at interfaces between solid and liquid. In the case of the radiolysis of water at the interfaces between oxide and water, it was found
that the type of oxide greatly impacts the H2 production [78-82]. This is illustrated in the work
of Petrik et al. [80], who studied the H2 yield as a function of the band gap of the different
oxides (see Figure 1. 18 below) submitted to γ radiation with adsorbed water molecules at
their surface. The comparison between calculated yield and bulk water yield enables to sort
oxides in three groups [84]:
Oxides lowering the H2 yield as compared to bulk water (CuO, MnO2…);
Oxides that do not seem to affect the H2 yield (SiO2, CeO2, Al2O3, TiO2…);
47
Figure 1. 18. Dihydrogen yield as a function of the oxide band gap in the γ-radiolysis of H2O molecules absorbed on
oxides. G (H2) is calculated with respect to the energy of γ rays directly absorbed by the H2O molecules. (Reprinted
from Ref. [80])
According to Le Caër [84], many parameters related to solid can affect the dihydrogen yield at the oxide/water interface:
The band gap of the oxide (see Figure 1. 18) [80];
The doping of the oxide [80];
The crystal phase [90];
The exciton migration distance [83];
The water adsorption form (physisorbed/chemisorbed water) [86];
The surface density of hydroxyl groups [83][86].
The lack of studies dealing with the behaviour of cements and their hydrates under irradiation, especially C-S-H, requires finding analogue materials to be compared with.
48
However, recent results [15][87] suggest that hydrates, like oxides can facilitate energy
transfer to adsorbed water, with energy transfer as efficient as in ZrO2, but depending on the
nanostructuration (see Table 5).
1.2.8.2. Trapped water: hydrates and hydroxides
Hydroxides contain different types of water such as free water, bond water, which is
similar in the case of C-S-H. Therefore, the value of radiolytic yield of H2 formed in water would
serve as a reference to compare our results. Table 5 summarizes G(H2) in different hydroxides.
H2 formation differs with various radiation source. Some hydroxides may have a substantial H2
releasing.
The radiolysis of nanoparticulate Al(OH)3 and AlOOH under γ irradiation was studied
and hydrogen production from dry samples was quantified [88]. The studies surprisingly
indicate the common oxyhydroxide, boehmite, produces significant hydrogen when exposed to gamma irradiation.
Figure 1. 19. Hydrogen production from electron-irradiated AlOOH L and S (Large particle size and small particle size are denoted AlOOH L and AlOOH S respectively) with respect to water loading. Violet squares (AlOOH L). Cyan


![Figure 1. 10. Variation of the distance between two calcium plans with the C/S ratio [120]](https://thumb-eu.123doks.com/thumbv2/123doknet/12718302.356545/33.892.219.586.101.451/figure-variation-distance-calcium-plans-c-s-ratio.webp)
![Figure 1. 15. The relative importance of various process of gamma radiation interaction with matter [68]](https://thumb-eu.123doks.com/thumbv2/123doknet/12718302.356545/39.892.210.682.125.433/figure-relative-importance-various-process-radiation-interaction-matter.webp)
![Figure 1. 16. Main reactions occur in the three stages of water radiolysis [71] [72].](https://thumb-eu.123doks.com/thumbv2/123doknet/12718302.356545/43.892.173.731.315.736/figure-main-reactions-occur-stages-water-radiolysis.webp)