HAL Id: hal-00903824
https://hal.archives-ouvertes.fr/hal-00903824
Submitted on 5 Apr 2017
HAL is a multi-disciplinary open access
archive for the deposit and dissemination of
sci-entific research documents, whether they are
pub-lished or not. The documents may come from
teaching and research institutions in France or
abroad, or from public or private research centers.
L’archive ouverte pluridisciplinaire HAL, est
destinée au dépôt et à la diffusion de documents
scientifiques de niveau recherche, publiés ou non,
émanant des établissements d’enseignement et de
recherche français ou étrangers, des laboratoires
publics ou privés.
Public Domain
Effect of Sample Size on the Behavior of Granular
Materials
Wei Hu, Christophe Dano, Pierre-Yves Hicher, Jean-Yves Le Touzo, François
Derkx, Erick Merliot
To cite this version:
Wei Hu, Christophe Dano, Pierre-Yves Hicher, Jean-Yves Le Touzo, François Derkx, et al.. Effect of
Sample Size on the Behavior of Granular Materials. Geotechnical Testing Journal, ASTM
Interna-tional, 2011, 34 (3), pp.186-197. �10.1520/GTJ103095�. �hal-00903824�
Wei Hu,
1Christophe Dano,
2Pierre-Yves Hicher,
3Jean-Yves Le Touzo,
3François Derkx,
4and Erick Merliot
4Effect of Sample Size on the Behavior of
Granular Materials
ABSTRACT:Natural soils or coarse granular materials containing large particles such as rockfill or ballast are often an issue for geotechnical projects. However, since it is usually complicated or impossible to set up a big enough experimental apparatus to test these materials, their mechani-cal behavior remains poorly known. To circumvent this difficulty, we have developed a set of triaxial cells of various sizes to study the experimental behavior of granular soils containing particle sizes of up to 160 mm. This paper presents the first results of a two-part experimental study. The first part consists of triaxial tests on sand samples of different sizes in order to examine specimen scale effects. Pre-peak behavior is not affected by the specimen size, whereas post-peak behavior depends on the test conditions that control the development of strain localizations. In the second part, we present drained triaxial compression tests on large samples of calcareous rockfill materials that have parallel grain size distributions. The results show a nonstandard evolution of the friction angle in relationship to grain size if compared to similar studies on coarse granular materials. Although grain crushing occurs during compression, the strain-stress curves of the different materials with different grain sizes do remain close. We explain this phenomenon by the strength evolution of the individual grains with respect to their sizes.
KEYWORDS:triaxial cell, granular materials, rockfill behavior, coarse soil, size effect
Introduction
The study of granular materials containing large particles such as rockfills, ballasts, etc, requires suitable laboratory facilities whose dimensions must be in proportion to the maximum size of the grains. In order to satisfy the concept of Representative Elementary Volume, a current assumption in the geotechnical community is to test specimens six to ten times bigger than the particle maximum size (Holtz and Gibbs 1956). Under this condition, the physical and mechanical properties do not depend on the specimen size. Be-sides, the sample height is usually twice its diameter in triaxial tests in order to lessen the effects of cap and base friction (Bishop and Green 1965; Bishop 1971).
In recent years, the construction all over the world of new and sometimes very high rockfill dams (200 m and more) using natural and local fill materials corresponds to the need for sustainable en-ergy and water resources. The optimum design of such dams in-volves a better understanding of the behavior of the used materials in order to guarantee the safety of its structural behavior during its
lifetime. Other engineering issues (stone columns, ballasts, stone beds above rigid inclusions, etc,) justify the creation of new re-search programs on the currently ill-determined behavior of coarse granular materials.
The pioneering work on the behavior of coarse soils was done at the University of California, Berkeley (Marachi et al. 1969; Mara-chi et al. 1972; Becker et al. 1972) and at the University of Mexico (Marsal et al. 1965; Marsal 1967; Marsal et al. 1967) in the 1960s and 1970s. The construction of large facilities then accompanied the scientific objective to extrapolate the behavior of natural rock-fills used in dam construction from triaxial tests on finer fractions of the same material. Those experimental programs clearly high-lighted the effect of grain crushing on the value of the shear resis-tance and more particularly on the peak friction angle (Marsal 1967; Marachi et al. 1969; Leps 1970; Marachi et al. 1972; Becker et al. 1972). Extensive triaxial testing programs were completed with either one dimensional compression tests (Marsal 1967) or plane strain compression tests (Marsal et al. 1967; Becker et al. 1972) on the same rockfill granular materials, and all of the test results led to the conclusion that (1) grain breakage is enhanced when stress level, grain size, and sample dimension are increased; and (2) the peak friction angle value decreases if the amount of grain crushing increases, accompanying a more compressible be-havior. Such large experimental facilities are still very scarce around the world, although some new devices, among which is the cell described in this paper and others (Verdugo and de la Hoz 2006), attempt to reproduce and extend the previous research pro-grams in light of the present knowledge and technology. Neverthe-less, some smaller but still unusual cells have provided interesting results about the behavior of unsaturated gravels and rockfill mate-rials (Chávez and Alonso 2003; Chávez 2004), about the dynamic behavior of ballasts (Indraratna et al. 1998; Lackenby et al. 2007), or about the pseudo-static behavior of rockfills (Charles and Watts 1980; Barton and Kjaernsli 1981; Indraratna et al. 1993; Varadara-jan et al. 2006).
In this paper, we present the results of an experimental study based on the development of a set of triaxial cells with different
1
Formerly Research Fellow, Research Institute in Civil and Mechanical En-gineering, Ecole Centrale Nantes–Univ. of Nantes–CNRS UMR 6183, 1 rue de la Noë, BP92101, Nantes 44321 cedex 3, France; Presently, Associate Professor, State Key Laboratory of Geohazard Prevention and Geoenvironment Protec-tion, Chengdu Univ. of Technology, Chengdu 610059, People’s Republic of China.
2
Research Institute in Civil and Mechanical Engineering, Ecole Centrale Nantes–Univ. of Nantes–CNRS UMR 6183, 1 rue de la Noë, BP92101, Nantes 44321 cedex 3, France (Corresponding author), e-mail: [email protected]
3
Research Institute in Civil and Mechanical Engineering, Ecole Centrale Nantes–Univ. of Nantes–CNRS UMR 6183, 1 rue de la Noë, BP92101, Nantes 44321 cedex 3, France.
4
Département Mesure Auscultation et Calcul Scientifique (MACS), Institut Français des Sciences et Technologies des Transports, de l’Aménagement et des Réseaux, 58 boulevard Lefebvre, Paris 75732 cedex 15, France.
dimensions, which allowed us to address the issue of the maximum grain size effect on the behavior of rockfill material. This set of triaxial cells comprises a conventional triaxial cell for samples of 70 or 100 mm in diameter, a second cell allowing testing samples of 250 mm in diameter, and a very large triaxial cell for samples with a diameter between 500 and 1000 mm.
Experimental Devices
The small and intermediate triaxial cells, designed to accommodate samples whose diameter is either 70 or 100 mm for the small one or 250 mm for the intermediate one, are not so different from many commercial devices, so that they are not described here. Experi-ments on relatively coarse soils merely imply that the testing pro-cedure must be adapted as presented below. The description of the very large triaxial cell will be emphasized. Contrary to the peculiar design of Marsal’s spherical cell, the principle of the new large ap-paratus resembles a smaller conventional cylindrical triaxial cell
similar to the large test facility at the University of California, Ber-keley.
Initially, the cell was designed to support vertical loading up to 1000 kN (first configuration). All the test results on sand samples presented herein refer to this first configuration. Some elements (base of the cell, sample platens, top cover, pre-tension tie rods, piston, and ball joint) were subsequently reinforced to sustain ver-tical loading up to 2000 kN. The driving hydraulic and electronic system was also simultaneously upgraded; this second configura-tion was used to carry out triaxial tests on the rockfill material pre-sented in the last section. General sketches of the two configura-tions are shown in Fig. 1.
The confining chamber (Fig. 2) stands on a pre-stressed con-crete slab that can support its total weight (about 150 kN) without any significant deformation. It is placed under a 100 kN travelling crane high enough to pass over the 4.5 m high triaxial device. The cell is composed of a very stiff and fixed steel base 1.60⫻1.60 m large, on which all the cell elements are assembled.
Depending on the sample size and nature, a suitable inner load cell (among three submersible load cells of respective capacities 500, 1000, or 2000 kN and for all of them a linearity lower than ±0.5 % of the measure scale) is chosen and installed on the cell base, just below the sample bottom platen directly screwed on the load cell. The use of an inner load cell gives a more accurate mea-surement of the shear force applied to the sample; it particularly does not integrate the frictional force between the cell cap or the cover plate and the loading piston.
At the present time, the cell may host samples either 1 m in di-ameter and 1.5 m high (height-to-didi-ameter ratio: 1.5) or 0.5 m in diameter and 1 m high (height-to-diameter ratio: 2). Very stiff distance-pieces are used to adjust the position of the sample inside the cell according to its original height. Of course, the different slenderness of the largest samples imposed by the available total height within the cell may have an effect on the stress-strain re-sponses of the tested material. It has been largely shown that the peak friction angle and the tangent initial stiffness are greater in case the slenderness is reduced or no lubrication techniques are
FIG. 1—Design draughts of the two configurations of the large triaxial cell.
used (Lam and Tatsuoka 1988; Darve et al. 1995; El Bied 2000) because shear stresses are generated due to friction between the platens and the soil sample. Such an effect must be taken into ac-count when comparing the subsequent test results on sand. On the contrary, comparative triaxial tests on rockfill samples were con-ducted on samples with the same slenderness and the comparison is therefore assumed to be straightforward.
The bottom and top platens are made of steel circular elements 120 mm thick and 1100 mm in diameter for samples 1 m in diam-eter, and 100 mm thick and 600 mm in diameter for samples 0.5 m in diameter. The inside faces of the platens contain concentric grooves in order to allow drainage. They were also fitted with a metallic screen protected by two fine layers of a textile geo-membrane that act as a porous stone and a filter in order to avoid any intrusion of fine particles into the drainage network. No lubri-cation is used to prevent boundary effects on the platens; experi-mental observations, however, show that sliding along the end platen is not prevented.
The lateral cylindrical envelope, commonly transparent in most standard triaxial cells, is here replaced by a 2 m high steel double-wall chamber and two heightening elements on both sides of this chamber (Fig. 2). All electrical cables for transducers or nylon hy-draulic hosepipes pass through those heightening elements.
The double-wall chamber is composed of
• a steel outer cylinder 12 mm thick and 1256 mm in diameter and
• a high density polyethylene (HDPE) inner cylinder 8 mm thick and 1200 mm in diameter clamped at its tips.
The outer and inner volumes are both filled simultaneously with water and can withstand a confining pressure of 1.5 MPa (it is prac-tically limited to a serviceability pressure of 1 MPa). The driving system continuously controls the equality of the pressures in the two chambers so that the inner HDPE cylinder remains unde-formed during the test. Therefore, the inner compartment contain-ing the sample can be assumed to be at constant volume durcontain-ing the test, which enhances the accuracy of the volume change measure-ments. Two 1 MPa pressure transducers located at the base of the double-wall chamber are connected to the inner and outer volumes, respectively. In case of a difference of pressure on both sides of the HDPE envelope, a servo-valve is automatically opened by the driv-ing system to balance the pressures.
Water volume changes are detected by an electromagnetic flow-meter with an accuracy of ±0.2 %, coupled to an electronic counter inserted in the cell pressure line. During shearing at constant cell pressure, the water volume changes are mainly due to the penetra-tion of the loading ram into the inner volume, to the water com-pressibility, to the membrane penetration effects, and to the sample volume changes (Georgopoulos and Vardoulakis 2005).
Although assumed to be an incompressible fluid, water contracts or dilates whenever a pressure or temperature variation is applied. At temperatures of 0 and 20° C, the coefficient of compressibility of water cw is, respectively, 5.01⫻10−7 kPa−1 and 4.57 ⫻10−7 kPa−1. The water volume change can be evaluated as
(Geor-gopoulos and Vardoulakis 2005)
⌬Vw= cw·⌬c· Vw (1)
where:
⌬c= variation in the cell pressure and
Vw= current water volume in the cell (1.24 m3for a 1 m large sample and 2.35 m3for a 0.5 m large sample).
A variation in the cell pressure value of 2 kPa (because of a
de-layed response of the hydraulic control system for instance) in-duces a water volume change of 1.13 cm3 for a 1 m sample or
2.15 cm3 for a 0.5 m sample at a temperature of 20° C, i.e., a
sample volumetric strain of about 10−5in the extreme case. Volume
changes due to a variation of several Celsius degrees are of the same order of magnitude.
The membrane penetration effects can be assessed following two different approaches: First, by assuming that large samples of coarse soils represent a rigorously homothetic picture of small samples with small particles, the approach by Baldi and Nova (1984) based on triaxial tests on fine sands共d50ⱕ0.5 mm兲 can be
considered. According to their study, the volume change due to membrane penetration, which mainly occurs during the drained consolidation phase, depends on the mean diameter d50 of the
grains, of the sample size (diameter dsample= 1000 mm and volume Vsample), of the effective cell pressure ⬘c, and of the membrane properties (Young’s modulus Emembrane⬃10 MPa; thickness emembrane= 1.4 mm) and can be expressed by the following relation
Vm= d50 2 · dsample· Vsample·
冑
3 ⬘ c· d50 Emembrane· emembrane (2) An alternative approach was developed by Frydman et al. (1973), Ramana and Raju (1982), and Nicholson et al. (1989). They sug-gested that the volumetric membrane compliance per unit mem-brane area is proportional to the log cycle of the effective confining pressure by a constant S called normalized membrane penetration. Various correlations have been established between S and a charac-teristic grain size, either d50or d20. Based on a large collection oftest results, Nicholson et al. (1989) proposed a relationship be-tween S and d20 that tends towards a limiting value of S
= 0.4 共cm3/ cm2兲/⌬ log ⬘
3when d20increases up to values higher
than 50 mm. This value has been used to correct the initial void ratios of the 1000 mm samples. For the 250 mm samples, according to the relationship proposed by Nicholson et al. (1989), a value of S = 0.1 共cm3/ cm2兲/⌬ log ⬘
3has been assumed. No correction has
been applied in the case of sand samples.
The approach of Baldi and Nova (1984) is suitable for small samples (70 mm) but leads to an overestimated value of the mem-brane correction (some percent for the volumetric strain) inconsis-tent with the experimental observations of the volumetric contrac-tancy during isotropic compression for large samples. The second
approach considering a value of S = 0.1 or
0.4 共cm3/ cm2兲/⌬ log ⬘
3gives a more realistic value of the
volu-metric strain during consolidation, close to 1 %, and is therefore used for samples of 250 and 1000 mm in diameter.
Let us now consider a drained shearing phase of a coarse sample at a constant confining pressure. Volume changes due to membrane penetration effects are assumed to be negligible even if the key pa-rameter, namely the characteristic grain size, evolves slightly due to grain crushing. Therefore, the sample volume changes are calcu-lated in the following way
⌬Vsample=⌬VFM−⌬Vpiston (3)
where:
⌬VFM= water volume–entering or exiting the cell–measured by the flow meter installed in the console,
⌬Vsample= sample volume change, and
⌬Vpiston= variation of the cell water volume corresponding to the
penetration of the loading piston into the cell (⌬Vpiston=.⌬H.r2
cell determined at the hydraulic jack level, r = 40 mm is the piston radius in the first cell configuration, and r = 50 mm in the second one).
12 steel tie rods 60 and 1560 mm in diameter and height, respec-tively, are pre-stressed at a value of 10 MPa to ensure the complete water tightness of the cell once it is finally mounted. They also fa-cilitate the placement of the cover plate by guiding it. The steel cir-cular cover plate, 145 mm thick and 1600 mm large, which closes the cell (Fig. 2), is fitted with a vent valve so that the air can flow out the chamber when it is filled by water and also supports the loading frame, as shown in Fig. 1.
The first configuration of the cell uses a one-way hydraulic jack whose capacity is 1000 kN and displacement course 250 mm. More recently, a new hydraulic jack was acquired in order to apply load-ing up to 2000 kN statically (from 0 to 50 mm/h) and cyclically with frequencies in the range 0–5 Hz for a course of 300 mm. The hydraulic jack applies a vertical load (in compression or in exten-sion) on the loading steel piston, which slides through the cover plate. The lower tip of the loading piston consists of a ball joint (Fig. 2) attached to the top platen of the sample. Note that the ver-tical shortening of the sample is measured by an external LVDT bound to the hydraulic jack. The maximum axial strain is limited to 13 % using the 1000 kN configuration of the cell and to 20 % with the 2000 kN configuration.
A critical issue involves the manufacture of the membranes. In order to prevent prohibitive costs and sudden leakage due to mem-brane tears, a 1.5 mm thick and nonreinforced PVC memmem-brane, usually used as a swimming-pool liner, was chosen. A perfectly rectangular piece slightly greater than the necessary size is care-fully cut. For a sample 1 and 1.5 m in diameter and height, respec-tively, the rectangular piece is 2 m high and 3.19 m long. The ends of the membrane are then thermally glued using a heating tool at a temperature of about 200° C. The membrane, which can be slightly warmed up in order to facilitate its installation, is finally placed on a four-quarter aluminum cylindrical mold and the whole set up is installed on the bottom platen of the cell. Steel rings encircle the membrane on the platens beforehand coated with silicone grease. Because the grain angularity may cause membrane tear, a second PVC membrane and a 0.5 mm thick layer of geo-membrane whose dimensions coincide with the sample dimensions are usually super-imposed when coarse soils are tested; the inner membrane is free to slide against the outer membrane, itself fixed on the sample pedes-tals. The cumulative thickness of the protecting membrane is thus about 3 mm, which is relatively small compared to prior experi-ments by Marsal (1967) or Marachi et al. (1969).
Before filling the mold, the membrane is pushed against the mold by a vacuum of 50 kPa by using a vacuum pump and a vacuum transducer.
Experiments on Sand Samples
In order to evaluate the performance of the cell, to improve the ex-perimental procedure and to prove that no material size effects can subsequently affect test results on coarse soils, a series of drained consolidated triaxial compression tests using the 1000 kN configu-ration of the cell was conducted on dry Loire River sand. It has been previously studied in the laboratory (Dano et al. 2003) and huge and uniform quantities are available. A similar approach prelimi-nary to extensive programs on coarse materials was previously car-ried out by Marachi et al. (1969) and Becker et al. (1972), for in-stance.
The Loire River sand consists of recent alluvial deposits of the Loire River, close to its mouth in the west of France. It is composed of sub-rounded silica particles and elongated shell fragments. The mean grain size d50is 520 µm. The coefficient of uniformity Cuis equal to 3.5. Therefore, Loire River sand is poorly graded sand (ASTM D2487-93). The specific weight ␥s of the grains is 26.2 kN/ m3(ASTM D854-92). The minimum unit weight ␥
min
(ASTM D4254-91) and the maximum unit weight␥max (ASTM
D4253-93) are equal to 15.1 kN/ m3 共e
max= 0.735兲 and
18.5 kN/ m3共e
min= 0.416兲, respectively.
Triaxial tests on samples 100, 500, and 1000 mm in diameter were carried out with nearly the same dry unit weight ␥ = 17.10 kN/ m3. Tests on 100 mm samples were carried out using a
50 kN loading device. It is worth noting that calibration tests in the largest samples, in which small aluminum boxes were randomly placed before filling, show a scattering of the unit weight of about 0.3 kN/ m3from one point to another, in spite of all the precautions
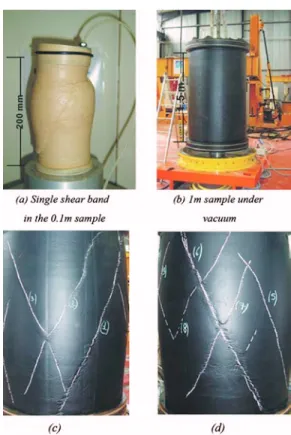
taken to obtain a homogeneous sample. Sample reconstitution for all the configurations follows a quite similar procedure to achieve the same density state. A given mass of sand (0.6, 40, and 110 kg for the 100, 500, and 1000 mm samples, respectively) is poured into the mold then laid out and finally compacted by using a rammer. The process is repeated nine, eight, and nine times for the 100, 500, and 1000 mm samples, respectively. Such a process involves a clear anisotropy, particularly apparent in the largest sample, even through the PVC membrane. The top surface is carefully leveled and protected by a double layer of geo-membrane. The top platen is finally installed and the membrane fixed on it. A vacuum of maxi-mum value 80 kPa is then applied inside the sample whereas the vacuum between the mold and the membrane is simultaneously re-leased. The mold is then removed after slightly lifting the top platen. The appearance of the samples is shown in Fig. 3. The sample is of a cylindrical shape. Moreover, due to the relatively small grain size, surface defaults caused by membrane penetration are negligible.
The cell is then completely mounted and filled with water by simultaneously controlling the level of water on both sides of the inner HDPE envelope. At the end of the filling phase, the cell pres-surec is gradually increased up to 100 kPa by using a pump, whereas the vacuum ua inside the sample is simultaneously re-leased so that the sum共c+ ua兲 remains always lower than the test confining effective pressure. At this stage, fully drained conditions are imposed. The cell pressure is finally increased up to the test confining effective pressure. Note that the confining pressures given in this paper are determined at the pressure transducer level, 1 m below the mid height of the samples. The shearing phase is con-ducted at a velocity of 25 mm/h (1.66 %/h for a sample 1500 mm high; 2.5 %/h for a sample 1000 mm high) at a constant cell pres-sure (among the following values: 100, 200, 300, and 350 kPa). Repeatability is assessed by carrying out two tests in the same con-ditions on samples 0.5 m in diameter at a confining pressure of 300 kPa. As the jack is a one-way device, the final unloading phase can-not be recorded. Therefore, at the end of the shearing phase, a vacuum is applied inside the sample, the hydraulic jack is stopped, and the cell pressure is slowly decreased.
The change of the cross section area of the specimen cannot be neglected during the triaxial test. The following formula (NF P 94-074 10/94) has been used for the correction of the cross section area
S = V0−⌬Vs−⌬Vi H0−⌬Hs−⌬Hi ⫻
冋
1 + ⌬Hi 2共H0−⌬Hs兲册
(4) where:V0, H0= volume and height of the specimen under the initial
vacuum respectively,
⌬Vi and ⌬Hi= change of volume and height during the shear-ing phase, respectively, and
⌬Vs and ⌬Hs= change of volume and height of the specimen during the consolidation.
Because the consolidation of dry granular material can induce very small volume changes, the variations⌬Vs and⌬Hsare ne-glected in the calculation.
The triaxial test results are presented in Fig. 4 for each of the four confining pressures. The test result on the 1000 mm sample and at a confining pressure of 100 kPa is not relevant because of a poor control of the cell pressure, due to inappropriate proportional-integral-derivative regulation factors.
As expected (Habib 1972) and also previously shown by Mara-chi et al. (1969) on Monterey⫽20 sand, because the tests are con-ducted on representative volumes, the soil response does not sig-nificantly change with the sample size in the pre-peak domain. No grain breakage is involved in the present case; the grain size distri-butions were measured before and after the triaxial tests on the 0.5 and 1 m large sand samples. Only a representative mass of sand was sampled in different points of the specimens. The results are pre-sented in Fig. 5 for the 1000 mm samples. Changes in the gradation are not significant and probably due to the sampling itself, even if some random breakages were observed on elongated shell frag-ments. However, the post-peak behavior exhibits clearly a depen-dence on the sample size. Only tests conducted at a cell pressure of 200 kPa are analyzed for this purpose. The rate of softening
in-creases with the sample size. However, it is worth reminding that the height-to-diameter ratio is 1.5 for the 1 m sample and 2 for the other sample sizes. Observation of localization patterns reveals that a single shear band appears in the small sample 0.1 m in diameter, whereas in the 1 m sample, a set of parallel and cross shear bands are visible through the membrane, as shown in Fig. 3.
Figure 6 presents the evolution of the ratio max=共q/p⬘兲max
where q is the deviatoric stress and p⬘is the mean effective stress at peak, respectively. The variation ofmaxfor the 350 kPa cell
pres-sure, for instance, corresponds to a variation in the value of the peak friction angle of 2°. In a first approximation, one can observe a decrease of the maximum stress ratio with the stress level, which indicates a curvature of the maximum shear strength envelope. However, the test results are quite inconsistent since samples with a slenderness of 2 show a greater maximum stress ratio and samples with a lower density (500 mm samples) show a bigger maximum stress ratio. The effect of the density heterogeneity and of the strain localization is assumed to explain the observed differences.
The parameters of the linear elastic Mohr–Coulomb perfectly plastic material are given in Tables 1–3, where E is the secant elas-tic modulus at an axial strain of 0.2 %, is the Poisson’s ratio, is the peak friction angle determined from the tangent curve to the Mohr’s circles, which can be seen as an average peak friction angle, ␥dis the dry unit weight,⬘3is the confining pressure, e0is the void
ratio, and is the dilation angle. The cohesion is null. The peak friction angle value for samples 100 mm in diameter has been vali-dated by another study (Benazzouz 2005), which gives a value of the peak friction angle equal to 39.2° for similar unit weights. The comparison of test data on samples 100 and 500 mm in diameter, for which the slenderness is identical, does not reveal any differ-ence in the peak friction angle. Therefore, we can conclude that there is no obvious sample size effect in the pre-peak behavior.
Triaxial Tests on Calcareous Rockfill Samples
Even if the triaxial cell could be used as a calibration chamber, its main objective is to test coarse granular materials. This type of granular soil exhibits peculiar behaviors under compression and shearing that have been related to grain crushing more likely to ap-pear in coarse granular materials. Statistically, large particles can undergo a more intense crushing than smaller particles at stress lev-els (some hundreds of kilopascals) currently encountered in civil engineering for the same mineralogy. The amount of crushing de-pends on many key factors such as stress levels, stress paths (com-pression or shearing), density, moisture (Chávez and Alonso 2003), grain morphology and mineralogy, and grain size distribution (Har-din 1985; Biarez and Hicher 1997). At the grain scale, many frac-ture patterns can be created depending not only on the individual strength of the grains but also on the coordination number and the way local forces are applied to the grains (Guimaraes et al. 2007). For instance, loose assemblies have smaller coordination numbers; splitting mode fracture is then enhanced. On the contrary, in dense granular assemblies, loads at the particle scale are statistically more uniformly distributed on the grains, which therefore flake (Guima-raes et al. 2007). However, this may not always be the case since it is well known that external loads are mainly transmitted through strong force chains into the granular materials, thus enhancing the splitting mode fractures (See, for instance, Richefeu et al. 2009).
Other parameters can also affect the material behavior. Using the large triaxial facility at Idiem, University of Santiago (Chile), De La Hoz (2007) tested different coarse soils with different
age capabilities under drained triaxial conditions. He chose to test parallel grain size distributions of the same mineral stock, as previ-ously done by Marachi et al. (1972). The diameter of the particles reached 100 mm. At a given stress level for some granular materi-als, the peak friction angle decreased when the mean grain size
in-creased and grain crushing was relatively intense. On the other hand, the peak friction angle would increase when the grain size distributions were not perfectly parallel. The increase was found to be related to the quantity of fine particles in the initial grain size distribution as well as to a dependence of the angularity with the
mean diameter. An ultimate case for which the peak friction angle as well as the initial tangent stiffness did not depend on the mean grain size was obtained with strictly parallel grain size distribu-tions, a low proportion of fines, the same density (no variation in the minimum and maximum dry densities), a similar angularity of the grains for all dimensions, and mainly the absence of grain crushing. Except the last one, these conditions are those of the sub-sequent tests on the calcareous rockfills carried out with the three triaxial cells.
In this section, another condition for an almost constant maxi-mum stress ratio at the same stress level and at a same strain level but with different mean grain sizes was obtained. Triaxial test re-sults on samples of a calcareous granular material 100 (Fig. 7(a)), 250 (Fig. 7(b)), and 1000 mm (Fig. 7(c)) in diameter, respectively, are compared. The height-to-diameter ratio is 1.5 for all configura-tions. The tested material is a calcareous rockfill from a quarry lo-cated in Préfontaines (center of France). Initial gradations for the three samples size are parallel, as suggested by Lowe (1964), with a uniformity coefficient Ucclose to 2 (Fig. 8). Grain sizes are in the range (1.25–12.5) mm for the 70 mm samples, (5–40) mm for the 250 mm samples, and (25–160) mm for the 1000 mm samples. The angularity of the particles, classified as sub-angular (ASTM D2488-10), is shown in Fig. 9. The specific unit weight measured on small particles is 26.8 kN/ m3. The material is first dried by
natural evaporation in a covered hall; the water content initially equal to 11 % decreases until a value of 0.3 % is reached. Equilib-rium between atmospheric conditions in the hall and within the ma-terial is assumed.
Minimum and maximum void ratios cannot be experimentally determined on the coarse fraction because of the grain size. There-fore, a relative density cannot be defined and we chose to conduct the tests at a same density rather than at a same relative density. This choice was also corroborated by the fact that the grains present a similar angularity at each scale. Becker et al. (1972) indicated that the reduction of the friction angle value was lower for tests at a fixed relative index than for tests at the same initial void ratio.
FIG. 5—Comparison of gradations before and after triaxial tests for sample
1000 mm.
FIG. 6—Evolution of the maximum ratiomax=共q / p⬘兲maxfor sand samples.
TABLE 1—Parameters of the linear elastic perfectly plastic model for Loire river sand specimens of 100 mm. ⬘3 kPa ␥d kN/ m3 e 0 Esec(0.2 %) MPa degree degree 100 17.13 0.53 65 0.322 11.5 39.6 200 17.35 0.51 94 0.273 9.3 300 17.31 0.51 85 0.258 13.3 350 17.01 0.54 75 0.25 8.2
TABLE 2—Parameters of the linear elastic perfectly plastic model for Loire river sand specimens of 500 mm. ⬘3 kPa ␥d kN/ m3 e 0 Esec(0.2 %) MPa degree degree 100 17.10 0.53 55 0.10 15.1 39.5 200 17.06 0.54 65 0.22 13.3 300 17.08 0.53 72 0.30 9.8 350 17.02 0.54 63 0.21 11.3
TABLE 3—Parameters of the linear elastic perfectly plastic model for Loire river sand specimens of 1000 mm. ⬘3 kPa ␥d kN/ m3 e 0 Esec(0.2 %) MPa degree degree 200 17.09 0.53 63 0.36 8.2 36.9 350 17.00 0.54 70 0.28 8.5
Test characteristics are indicated in Table 4. The rockfill material for the 1000 mm samples is deposited by 15 or 17 successive layers of 100 kg. Each of them is then compacted using a hand-held vibra-tory needle inserted at different locations into the rockfill layer dur-ing 60 s for the unit weight of 11.9 kN/ m3(estimated relative
den-sity: 52 %) and more than 5 min to obtain a unit weight of about
14.3 kN/ m3 (estimated relative density: 85 %). Note that Test
1000-200B was conducted at a lower unit weight of 14.05 kN/ m3.
The relative densities have been estimated from eminand emax
mea-surements on the small grain size fraction. The height of each layer is controlled so that homogeneity through the sample can be as-sumed. Two layers of PVC membrane and one layer of geo-membrane surround the rockfill material. A similar procedure was adopted for the 70 and 250 mm samples. The 70 mm specimens were surrounded by two layers of 0.5 mm latex or 1 mm neoprene membrane while the 250 mm samples, tested under a 500 kN load-ing system, were surrounded by two 1 mm thick neoprene mem-branes.
The shearing rate was 1.67 %/h for the loosest sample (using the 1000 kN configuration) and 2 %/h for the densest samples (using the 2000 kN configuration). In order to compare grain size evolu-tions, the shearing phase was stopped at the same maximum axial strain of 20 % for all the tests carried out on the 2000 kN
configu-FIG. 7—Triaxial test results on rockfill specimens.
ration. At the end of the test, the membrane was cut at its base and gradually opened over a height of about 0.6 m. Contrary to an un-cemented sand mass, which would immediately flow, the rockfill mass did not collapse and photos of the final structure could be taken (Fig. 10). The observations show intact grains even of large diameters, some grains deeply crushed, and some grains that split into two parts. It was not possible to distinguish specific zones of strong crushing or zones not affected by grain breakage. In other words, crushing seems to be uniformly distributed within the sample volume. Accumulation of fine particles at the base of the sample was observed and associated with a possible surface degra-dation of the grains due to frictional attrition.
The deviatoric stress versus axial strain curves and the volumet-ric strain versus axial strain curves are presented in Fig. 7. The comparison between the 70, 250, and 1000 mm samples does not show any significant change in the shear strength, contrary to prior experimental observations by Marsal (1967) or Marachi et al. (1969). This conclusion cannot be strictly extended to the peak fric-tion angle since the maximum deviator stress was not reached in all of the tests. Comparing the stress ratiomax=共q/p⬘兲maxat the same axial strain of 20 % shows a decrease of the stress ratio with con-fining pressure (Fig. 11). At any given concon-fining pressure, the dif-ferences in the stress ratio values can be mainly attributed to differ-ences in initial densities, the 250 mm samples being slightly denser than the 70 and 1000 mm ones.
Grain size distributions carried out after the triaxial compres-sions are presented in Fig. 8. They clearly show that for a given grain size distribution, the amount of grain crushing increases with the confining stress (Fig. 8(b)), and that at a given confining stress, the 1000 mm samples present a slightly greater amount of particle breakage related to a lower maximum stress ratio. Even if nonsig-nificant, the lower amount of grain crushing for denser samples, namely samples of 250 mm in diameter, can be correlated with greater shear strength.
To understand why no size effect appeared in the present tests, a series of crushing tests on individual particles placed between two stiff plates was carried out, as previously done by Marsal (1967). The average diameter daveof the crushed particles was in the range
10–100 mm. All the crushing tests exhibited an elastic-fragile be-havior so that it was easy to measure the maximum force Fmaxas a
function of the average diameter (Fig. 12). The fitting curve gives a power law with a power coefficient of 1.90 (Fig. 12). This means that the failure stressf= Fmax/ dave
2decreases only slightly with dave. Consequently, there is no longer an obvious size effect in
par-ticle individual strength. It will be demonstrated in another paper (Frossard et al. 2010; Frossard 1979), from a micro-macro analysis, that the decrease of the maximum stress ratio is directly related to the individual strength properties of the grains. Previous experi-mental observations by De La Hoz (2007), Marsal et al. (1965), Marsal (1967), Marachi et al. (1969), and Marachi et al. (1972) confirm this finding. Several numerical models (Daouadji et al. 2001; Muir Wood and Maeda 2008) assume a relationship between micromechanical properties, grain crushing, and macroscopic be-havior.
Conclusions
This paper presents triaxial test results by using a set of triaxial devices among which is a large triaxial cell designed for investigat-ing coarse soil behavior. The main characteristics of the cell as well as the main difficulties in the use of this facility have also been evoked. At least two sample configurations can be tested. The most recent evolutions allow the users to apply confining pressures in the range 100–1000 kPa and axial loading up to 2000 kN. The original features of the cell beyond its dimensions can be attributed to the different possible sample sizes and the double-walled cylindrical
TABLE 4—Calcareous samples characteristics for triaxial tests.
Name Diametera (mm) Height (mm) Mass (kg) Unit Weight 共kN/m3兲 Void Ratiob 70-100A 66.2 105.0 0.527 14.30 0.86 70-100B 66.0 105.9 0.530 14.35 0.86 70-100C 65.7 105.6 0.529 14.49 0.84 70-200A 65.5 105.9 0.522 14.34 0.85 70-200B 65.9 106.0 0.529 14.37 0.85 70-400A 66.1 106.0 0.544 14.70 0.80 70-400B 65.4 103.8 0.521 14.63 0.80 70-400C 65.8 105.4 0.531 14.55 0.81 250-100A 245.2 379.8 26.61 14.56 0.83 250-100B 244.9 380.1 26.51 14.52 0.84 250-200A 245.9 377.0 26.45 14.49 0.83 250-200B 245.9 381.0 26.40 14.31 0.85 250-200C 245.9 379.0 26.55 14.47 0.83 250-400A 246.0 377.5 26.55 14.51 0.82 250-400B 246.0 382.8 26.51 14.29 0.85 1000-100 1003 1496 1707 14.34 0.86 1000-200A 997 1503 1526 12.91 1.06 1000-200B 1006 1500 1687 14.05 0.89 1000-400 1004 1506 1709 14.23 0.86 a
Corrected diameter= external diameter minus four times the membrane thickness. b
Corrected value including membrane penetration effect based on S = 0.4 cm3/ cm2per log cycle of⬘
cfor 1000
mm samples and S = 0.03 cm3/ cm2per log cycle of⬘
cfor 70 mm samples (Nicholson et al. 1989), assuming no
envelope designed to accurately measure the volume changes of the samples during testing.
The first set of tests carried out on sand samples attempt to show that size effects cannot affect the results of drained triaxial com-pression tests before peak. Test results on samples 100, 500, and 1000 mm in diameter were compared. The pre-peak behavior is not
significantly dependent on the sample size, as assumed by the Rep-resentative Elementary Volume concept. Drained triaxial tests on a calcareous rockfill show that with the large triaxial cell we are ca-pable of carrying out experiments on coarse soils and quantify the amount of grain crushing. In the specific case of the calcareous ma-terial, a nonstandard behavior was highlighted: The shear strength at a given axial strain level does not decrease as samples with larger particles are tested. It is the correlation with the individual strength of the grains that explains such a peculiar behavior.
Acknowledgments
The writers wish to thank all the persons who contributed to the development of this experimental apparatus. The writers appreciate the aid of their corporate partners (Tractebel Engineering, Electric-ité de France, Eiffage Travaux Publics, CETE Sud-Est, LMS-Armines) as well as the financial grant to the ECHO project by the French National Agency for Research (ANR). Last but not least, the writers thank P. Denain and M. Schaba, technicians, and I.-K. Benazzouz and M. Khemakhem, graduate students, of the labora-tory GeM at Ecole Centrale de Nantes for their conscientious work.
References
ASTM D2488-93, 1995, “Standard Practice for Description and Identification of Soils (Visual-Manual Procedure),” Annual Book of ASTM Standards, Vol. 04.08, ASTM International, West Conshohocken, PA, pp. 218–228.
ASTM D2487-93, 1995, “Standard Test Method for Classification of Soils for Engineering Purposes,” Annual Book of ASTM Stan-dards, Vol. 04.08, ASTM International, West Conshohocken, PA, pp. 207–217.
ASTM D854-92, 1995, “Standard Test Methods for Specific Grav-ity of Soil Solids by Water Pycnometer,” Annual Book of ASTM Standards, Vol. 04.08, ASTM International, West Consho-hocken, PA, pp. 80–83.
ASTM D4253-93, 1995, “Standard Test Method for Maximum Index Density and Unit Weight of Soils Using a Vibratory Table,” Annual Book of ASTM Standards, Vol. 04.08, ASTM In-ternational, West Conshohocken, PA, pp. 533–545.
ASTM D4254-91, 1995, “Standard Test Method for Minimum
FIG. 10—Final granular structure showing grain crushing.
FIG. 11—Evolution of the maximum ratio max=共q / p⬘兲max for calcareous
samples.
Index Density and Unit Weight of Soils and Calculation of Rela-tive Density,” Annual Book of ASTM Standards, Vol. 04.08, ASTM International, West Conshohocken, PA, pp. 546–553. Baldi, G. and Nova, R., 1984, “Membrane Penetration Effects in
Triaxial Testing,” J. Geotech. Engrg., Vol. 110, No. 3, pp. 403– 420.
Barton, N. and Kjaernsli, B., 1981, “Shear Strength of Rockfill,” J. Geotech. Engrg., Vol. 107, No. 7, pp. 873–891.
Becker, E., Chan, C. K., and Bolton Seed, H., 1972, “Strength and Deformation Characteristics of Rockfill Materials in Plane Strain and Triaxial Compression Tests,” Report No. TE 72-3, Department of Civil and Environmental Engineering, Univer-sity of California, Berkeley, Berkeley, CA.
Bennazzouz, I. K., 2005, “Validation d’une grande cellule triaxiale—Essais sur sable de Loire [Validation of a large tri-axial cell—Tests on Loire sand specimens],” M.S. thesis, Ecole Centrale Nantes, Nantes, France (in French).
Biarez, J. and Hicher, P. Y., 1997, “Influence de la granulométrie et de son évolution par ruptures de grains sur le comportement mé-canique de matériaux granulaires [Effect of the grain size distri-bution and its evolution due to grain crushing on the mechanical behaviour of granular materials],” Revue Francaise Genie Civil, Vol. 1, No. 4, pp. 607–631.
Bishop, A. W., 1971, “Shear Strength Parameters for Undistubed and Remoulded Soil Specimens,” Stress-Strain Behaviours of Soils, Cambridge University Press, Cambridge, U.K., pp. 3–58. Bishop, A. W. and Green, G. E., 1965, “The Influence of End Re-straint on the Compression Strength of a Cohesionless Soil,” Geotechnique, Vol. 15, No. 3, pp. 243–266.
Charles, J. A. and Watts, K. S., 1980, “The Influence of Confining Pressure on the Shear Strength of Compacted Rockfill,” Geo-technique, Vol. 30, No. 4, pp. 353–367.
Chávez, C., 2004, “Estudio del comportamiento triaxial de materi-ales granulares de tamaño medio; con énfasis en la influencia de la succión [Study of the triaxial behaviour of granular materials of intermediate sizes, with emphasis to the influence of suc-tion],” Ph.D. thesis, Universidad Politécnica de Cataluña, Barce-lona, Catalonia, Spain (in Spanish).
Chávez, C. and Alonso, E. E., 2003, “A Constitutive Model for Crushed Granular Aggregates Which Include Suction Effects,” Soils Found., Vol. 43, No. 4, pp. 215–227.
Dano, C., Hareb, H., and Hicher, P.-Y., 2003, “Characterization of Loire River Sand in the Small Strain Domain Using New Bender-Extender Elements,” Proceedings 16th ASCE Engineer-ing Mechanics Conference, Seattle, WA, ASCE, Reston, VA (CD-ROM).
Daouadji, A., Hicher, P.-Y., and Rahma, A., 2001, “An Elastoplas-tic Model for Granular Materials Taking into Account Grain Breakage,” Eur. J. Mech. A/Solids, Vol. 20, pp. 113–137. Darve, F., Hicher, P.-Y., and Reynouard, J.-M., 1995, “Les
géomatériaux: theories, experiences et modèles [Geomaterials: Theory, Experiment and Modelling,” Etudes en mécanique des matériaux et des structures [Studies in Mechanics of Materials and Structures], Hermès, Paris, France.
De La Hoz, K., 2007, “Estimacion de los parametros de resistencia al corte en suelos granulares gruesos [Assessment of shear strength properties of coarse granular soils],” Magister thesis, University of Chile (Santiago), Chile (in Spanish).
El Bied, A., 2000, “Etude expérimentale et modélisation du com-portement des roches granulaires: écrouissage, radoucissement et rupture en mode localize [Experimental Study and Modeling of the Behavior of Granular Rocks: Hardening, Softening and
Failure in a Localized Mode],” Ph.D. thesis, l’Ecole Nationale des Ponts et Chaussées, Paris, France (in French).
Frossard, E., 1979, “Effect of Sand Grain Shape on Interparticle Friction: Indirect Measurements by Rowe’s Stress-Dilatancy Theory,” Geotechnique, Vol. 29, No. 3, pp. 341–350.
Frossard, E., Hu, W., Dano, C., and Hicher, P.-Y., 2010, “Evaluation of Rockfill Shear Strength Including Size Effect Within Granu-lar Materials,” Geotechnique (unpublished).
Frydman, S., Zeitlen, J. G., and Alpan, I., 1973, “The Membrane Effect in Triaxial Testing of Granular Soils,” J. Test. Eval., Vol.
1, No. 1, pp. 37–41.
Georgopoulos, I. O. and Vardoulakis, I., 2005, “Corrections on the Specimen Volume Changes and Axial Force in the Wykeham Farrance Triaxial Cell,” Internal Report, NTU, Athens, Greece. Guimaraes, M. S., Valdes, J. R., Palomino, A. M., and Santamarina, J. C., 2007, “Aggregate Production: Fines Generation During Rock Crushing,” Int. J. Min. Process., Vol. 81, No. 4, pp. 237– 247.
Habib, P., 1972, “Effet d’Echelle sur les Sables Denses [Scale Ef-fect in Dense Sands],” Séminaire Plasticité et Viscoplasticité [Plasticity and Viscoplasticity Workshop], Ecole Polytechnique Palaiseau, France.
Hardin, B. O., 1985, “Crushing of Soil Particles,” J. Geotech. Engrg., Vol. 111, No. 10, pp. 1177–1192.
Holtz, W.G. and Gibbs, H.J., 1956, “Triaxial Shear Tests On Pervi-ous Gravelly Soils,” J. Soil Mech. and Found. Div., Vol. 82, No. SMI, pp. 1–22.
Indraratna, B., Ionescu, D., and Christie, H. D., 1998, “Shear Be-haviours of Railway Ballast Based on Large-Scale Triaxial Tests,” J. Geotech. Geoenviron. Eng., Vol. 124, No. 5, pp. 439– 449.
Indraratna, B., Wijewardena, L. S. S., and Balasubramaniam, A. S., 1993, “Large-Scale Triaxial Testing of Grey Wacke Rockfill,” Geotechnique, Vol. 43, No. 1, pp. 37–51.
Lackenby, J., Indraratna, B., McDowell, G., and Christie, D., 2007, “Effect of Confining Pressure on Ballast Degradation and De-formation Under Cyclic Triaxial Loading,” Geotechnique, Vol.
57, No. 6, pp. 527–536.
Lam, W.-K. and Tatsuoka, F., 1988, “Triaxial Compressive and Ex-tension Strength of Sand Affected by Strength Anisotropy and Sample Slenderness,” ASTM Spec. Tech. Publ., Vol. 977, pp. 655–666.
Leps, T. M., 1970, “Review of Shearing Strength of Rockfill,” J. Soil Mech. and Found. Div., Vol. 96, No. 4, pp. 1159–1170. Lowe, J., 1964, “Shear Strength of Coarse Embankment Dam
Ma-terials,” Proceedings of the Eighth Congress on Large Dams, Edinburgh, Transactions, Vol. III, pp. 745–761.
Marachi, N. D., Chan, C. K., and Seed, H. B., 1972, “Valuation of Properties of Rockfill Materials,” J. Soil Mech. and Found. Div., Vol. 98, No. SMI, pp. 95–114.
Marachi, N. D., Chan, C. K., Seed, H. B., and Duncan, J. M., 1969, “Strength and Deformation Characteristics of Rockfill Materi-als,” Report No. TE-69-5, Dept. of Civil Engineering, Univ. of California, Berkeley, Berkeley, CA.
Marsal, R. J., 1967, “Large-Scale Testing of Rockfill Materials,” J. Soil Mech. and Found. Div., Vol. 93, No. SM2, pp. 27–44. Marsal, R. J., Arellano, L. R., and Nunez, A. G., 1967, “Plane
Strain Testing of Rockfill Materials,” Proceedings of the Third Panamerican Conference on Soil Mechanics and Foundation Engineering, Caracas, Venezuela, Vol. 1, pp. 249–271. Marsal, R. J., Moreno Gomez, E., Nunez, A., Cuellar, R., and
Granular Materials and Rockfill Samples,” Internal Report, Comision Federal de Electricidad, Mexico.
Muir Wood, D. and Maeda, K., 2008, “Changing Grading of Soil: Effect on Critical State,” Acta Geotech. Vol. 3, No. 1, pp. 3–14. NF P 94-074 10/94, “Sols: Reconnaissance et Essais—Essai à l’appareil triaxial de révolution—Appareillage—Préparation des éprouvettes—Essais (UU) non consolidé non drainé—Essai (CU+u) consolidé non drainé avec mesure de pression interstitielle—Essai (CD) consolidé drainé [Soil Testing: Axi-Symmetric Triaxial Test—Setup—Test Preparation—UU Test—CU+u Test—CD Test,” AFNOR, France.
Nicholson, P. G., Seed, R. B., and Anwar, H., 1989, Measurement and Elimination of Membrane Compliance Effects in Un-drained Triaxial Testing,” Report No. UCB/EERC-89/10, Earth-quake Engineering Research Center, University of California (Berkeley), Berkeley, CA.
Ramana, K. V. and Raju, V. S., 1982, “Membrane Penetration in Triaxial Tests,” J. Geotech. Engrg. Div., Vol. 108, No. GT2, pp. 305–310.
Richefeu, V., El Youssoufi, M. S., Azema, E., and Radjai, F., 2009, “Force Transmission in Dry and Wet Granular Media,” Powder Technol., Vol. 190, pp. 258–263.
Varadarajan, A., Sharma, K. G., Abbas, S. M., and Dhawan, A. K., 2006, “The Role of Nature of Particles on the Behaviour of Rockfill Materials,” Soils Found., Vol. 46, No. 5, pp. 569–584. Verdugo, R. and de la Hoz, K., 2006, “Strength and Stiffness of
Coarse Granular Soils,” Geotechnical Symposium “Soil Stress-Strain Behaviour: Measurement, Modelling and Analysis, Rome, March 16–17, H. I. Ling, L. Callisto, D. Leshchinsky, and J. Koseki, Eds., Springer, Dordrecht, The Netherlands, pp. 243–252.