HAL Id: hal-03082012
https://hal.archives-ouvertes.fr/hal-03082012
Submitted on 13 Jan 2021
HAL is a multi-disciplinary open access
archive for the deposit and dissemination of
sci-entific research documents, whether they are
pub-lished or not. The documents may come from
teaching and research institutions in France or
abroad, or from public or private research centers.
L’archive ouverte pluridisciplinaire HAL, est
destinée au dépôt et à la diffusion de documents
scientifiques de niveau recherche, publiés ou non,
émanant des établissements d’enseignement et de
recherche français ou étrangers, des laboratoires
publics ou privés.
Fast carbonylation reaction from CO 2 using plasma
gas/liquid microreactors for radiolabeling applications
Marion Gaudeau, Mengxue Zhang, Michaël Tatoulian, Camille Lescot,
Stéphanie Ognier
To cite this version:
Marion Gaudeau, Mengxue Zhang, Michaël Tatoulian, Camille Lescot, Stéphanie Ognier.
Fast
carbonylation reaction from CO 2 using plasma gas/liquid microreactors for radiolabeling
applica-tions. Reaction Chemistry & Engineering, Royal Society of Chemistry, 2020, 5 (10), pp.1981-1991.
�10.1039/D0RE00289E�. �hal-03082012�
Fast carbonylation reaction from CO
2using plasma gas/liquid
microreactors for radiolabeling applications
†Marion Gaudeaua, Mengxue Zhanga, Michael Tatouliana, Camille Lescotb*, Stéphanie Ogniera*
Carbon-11 is undoubtedly an attractive PET radiolabeling synthon because carbon is present in all biological molecules. It is mainly found under 11CO2, but the latter being not very reactive, it is necessary to convert it into a secondary precursor. 11CO
is an attractive precursor for labeling the carbonyl position through transition-metal mediated carbonylation because of its access to a wide range of functional groups (e.g., amides, ureas, ketones, esters, and carboxylic acids) present in most PET tracer molecules. However, the main limitations of 11CO labeling are the very short half-life of the radioisotope carbon-11
and its low concentration, and the low reactivity and poor solubility of 11CO in commonly used organic solvents. In this work,
we show that a possible solution to these limitations is to use microfluidic reactor technology to perform carbonylation reactions, whilst a novel approach to generate CO from CO2 by plasma is described. The methodology consists of the
decomposition of CO2 into CO by non-thermal DBD plasma at room temperature and atmospheric pressure, followed by the
total incorporation of CO thus formed in the gas phase by carbonylation reaction, in less than 2 min of residence time. This “proof of principle’’ developed in carbon-12 would be further applied in carbon-11. Although considerable advances in 11CO
chemistry have been reported in recent years, its application in PET tracer development is still an area of work in progress, because of the lack of commercially available synthesis instruments designed for 11C-carbonylations. To the best of our
knowledge, such an innovative and efficient process, combining microfluidics and plasma, allowing the very fast organic synthesis of carbonyl molecules from CO2 with high yield, in mild conditions, has never been studied.
Introduction
Positron emission tomography (PET) is a powerful non-invasive imaging technique that uses radiolabeled compounds as molecular probes to image biological processes in vivo, for research and clinical diagnostic1. These imaging probes are
labeled with short-lived radioisotopes (e.g., 18F, 11C, 13N, 15O). Its
rising use in recent years has increased the demand for the development of new PET tracers and that of new synthetic methods for these tracers.
Carbon-11 is a valuable positron-emitting radionuclide, because carbon is the main constituent of all biological molecules2.
However, due to the very short half-life time of 11C (t
1/2 = 20.4
min), the synthesis of 11C-labeled radiotracers is not without
challenge: chemists must find rapid synthesis routes so that the labeled molecule can be produced and isolated within two half-lives, i.e. 40 min for 11C.
As carbon-11 mainly comes from 11CO
2 generated in biomedical
cyclotrons3, it is crucial to have a method allowing the rapid
radiolabeling of molecules directly from 11CO
2. However,
considering the high stability of CO2, it is necessary to envisage
the transformation in situ of 11CO
2 into a more reactive species.
Among the existing carbon-11 radiolabeling methods, carbonylation reactions with 11CO are of great interest since it
leads to a wide range of functional groups (amides, ketones, ureas, esters, lactones, carboxylic acids, …) having interesting pharmaceutical properties4–12. These functional groups are thus
present in many biologically interesting compounds, and more specifically the amide function obtained by aminocarbonylation13–16.
Our objective is to develop an original process of introducing a carbon atom through aminocarbonylation using CO2 as carbon
source. The development will be performed with carbon-12 with the vision of future use in radiolabeling with carbon-11, so taking into account the time constraint and the security issues related to the radioactive nature of carbon-11.
Considering these parameters, carbonylation reactions usually require the use of intensified processes to ensure a high reaction rate. As for the gas-liquid reaction, high pressure autoclave reactors generating high partial pressures of CO have proven to be effective for 11C radiolabeling17, but these devices
are expensive and require special safety precautions. Another way to intensify the process is to use microreactors18–31. Indeed,
the large surface area to volume ratio of microfluidic systems improves the gas-liquid mass transfer between the flow of gas containing CO and the liquid phase reagent, leading to efficient carbonylation reactions with a short residence time32. Improved
transfer in microreactors also induces milder reaction conditions compared to conventional methods, and their small volume is perfectly suited to the manipulation of sub-micromolar amounts of radioactive reagents.
Concerning the reduction of CO2 to CO, carbon dioxide is
kinetically and thermodynamically stable33, and therefore
requires significant energy or powerful catalysts for its chemical transformation. Several methods can be used for the splitting of CO2 into CO (chemical, electrochemical, photochemical)10–15,34– 45 but plasma has been demonstrated as an effective and clean
species (excited neutrals, radicals, metastables, photons…) and electrons generated (with energy of [1-10] eV48) in the plasma
can break the C-O bond (2.9 eV/molecule at 300 K) and transform CO2 molecules. Compared to classical routes, the
conversion of CO2 by plasma does not generate waste and is an
“atom-economical” approach without the use of catalysts and reducing agents.16,49–51
Despite the complex plasma chemistry of the reaction, the splitting of CO2 can be summarized as follows:
𝐶𝑂2 → 𝐶𝑂 + 1 2𝑂2 (1)
∆𝐻𝑅= 2.9 𝑒𝑉 𝑚𝑜𝑙𝑒𝑐𝑢𝑙𝑒⁄ 𝑎𝑡 300𝐾 = 280 𝑘𝐽/𝑚𝑜𝑙
Among the different plasma systems, non-thermal (or cold) atmospheric plasma appears as a convenient and innovative method, since it is easy-to-handle and is operated under mild conditions (room temperature, atmospheric pressures)52. One
of the most exploited non-thermal plasma configurations for CO2 splitting is the dielectric barrier discharge (DBD), for which
one or two dielectric layers are inserted between the electrodes. It prevents the formation of electric arcs detrimental to the device integrity and allows homogenous discharges in the discharge gap. Simple to use and to scale up, the DBD configuration is a promising technique for the CO2
conversion to CO at industrial scales53.
Thus, the combination of microfluidics and plasma seems to be an ideal solution for carrying out the rapid carbonylation reactions required for 11C radiolabeling for PET.
Here we propose a new method to synthesize carbonylated molecules starting from CO2 directly, associating microfluidics
and plasma, within a very short residence time (several minutes) and under mild conditions. The proposed system is composed of two microreactors in a continuous 2-step process for the carbonylation reaction starting from CO2: a first plasma
microreactor for the CO2 splitting and a second gas-liquid
microreactor for the carbonylation reaction. To evaluate the efficiency of this innovative process combining plasma and microfluidics, aminocarbonylation of p-iodoanisole and
n-hexylamine in the presence of a palladium catalyst to form
N-hexyl-4-methoxybenzamide (1) has been chosen as proof-of-concept because of its high selectivity and efficiency to trap CO. Furthermore the reaction mixture is easy to analyse by 1H
NMR16. This process would subsequently be applied to
radiolabeling with carbon-11. To the best of our knowledge, such a fast and efficient process, starting from CO2 leading to
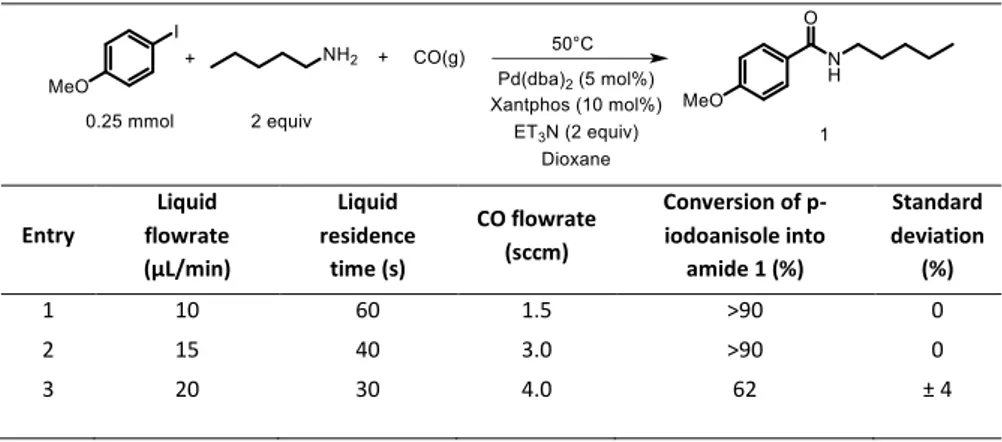
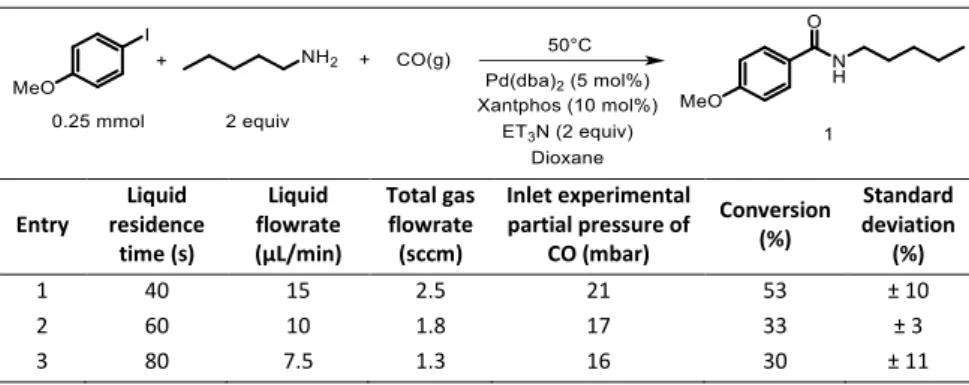
amide in mild conditions, has never been studied. Scheme 1 presents the general reaction scheme.
Scheme 1: General reaction scheme
Experimental
The study of the decomposition of CO2 into CO by plasma and
the study of aminocarbonylation reaction have firstly been carried out separately in two separate microreactors, then the two microreactors were coupled in line for the 2 steps synthesis.
Microreactors
Two glass microreactors with identical geometry have been used in this study: one with metallic electrodes for the plasma reactor and the other without electrodes for the carbonylation reaction. The patented reactor geometry has been previously developed in our group54 and demonstrated efficient for
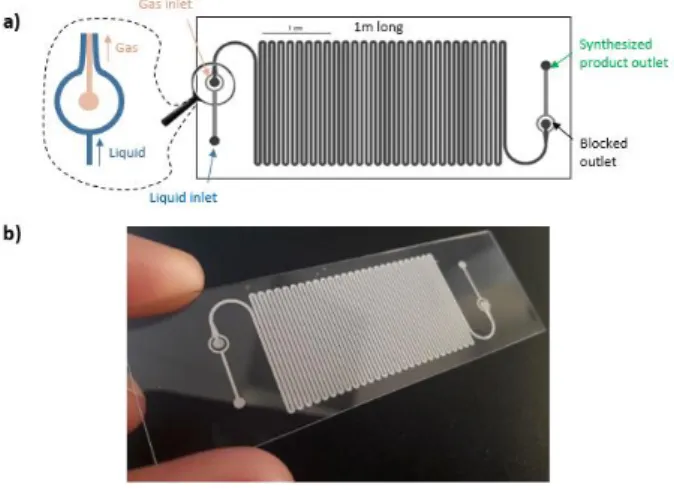
gas-liquid reactions55–57. The reactor has been designed to provide
a stabilized gas-liquid parallel flow in 1-m long channel. The gas flows in the central channel, while the liquid phase flows in the two side channels along the gas phase (Figure 1a and Figure 3). The internal volume of the gas phase is 10 µL and that of the liquid phase is 25 µL.
Figure 1: a) Top-view of the channel. b) Picture of the glass microreactor
Aminocarbonylation Material
The liquid phase was prepared by mixing in the following order: 0.0125 mmol of Pd(dba)2
[Bis(dibenzylideneacetone)palladium(0)] (5 mol%), 0.025 mmol of Xantphos [4,5-bis(diphenylphosphino)-9,9-dimethylxanthene] (10 mol%), 0.25 mmol of p-iodoanisole (1 eq), 3 mL of Dioxane, 0.5 mmol of n-hexylamine (2 eq), 0.5 mmol of trimethylamine (2 eq).
Fluidic set up
A biflow reactor was used for the aminocarbonylation reaction (Figure 1b). Details about the connectors assembling are given in Electronic Supplementary Information (ESI). Pure CO from commercial CO cylinder has been used for this part and was managed by means of mass flow controller (Bronkhorst EL-FLOW PRESTIGE FG-201CV) in the range of 0.014 – 4 sccm. The liquid flows were controlled by a syringe pump (kdScientific Legato 180) in the range of 7.5 – 20 µL/min. The liquid phase was introduced through the liquid inlet and the gas phase through the gas inlet. In both cases, the respective flowrate of
each phase determines its residence time in the chip. One of the reactor outlets was sealed while the other outlet of the microreactor was connected to a vial for liquid collection.
TEMPERATURE CONTROL
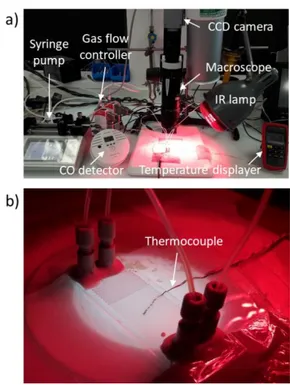
An infrared lamp (Bioseb Lab Instruments) was used to heat the microreactor, and the temperature was controlled by two thermocouples: one was fixed below the microreactor (Figure 2b), and the other above. The temperature inside the microreactor was determined supposing that the temperature changes linearly between the top and the bottom of the reactor. During the experiments, the typical temperature difference between the bottom and the top of the reactor was about 10 °C. The operating temperature was controlled in the range of 20 – 80 °C by adapting the distance from the IR lamp.
Flow characterisation
The chip was placed under a macroscope (Leica Z16 APO, Germany) onto which was mounted a CCD camera (PixeLINK PL-B781U) for flow visualisation, with the chip being back-illuminated by a diffuse LED lamp. Figure 3 shows the gas-liquid flow inside microchannel through the CCD camera. A stable gas-liquid flow was observed in all the tested conditions.
Liquid analysis
The liquid was collected at the outlet in a vial during 45 min. Conversion of p-iodoanisole into the amide 1 was determined by crude 1H NMR analysis (CDCl3) without internal standard, by
comparing to the remained p-iodoanisole quantity* (see also
ESI).
Each experiment was conducted at least twice, and the presented results correspond to the average of the measured substrate conversions. An error of 5% is appreciated on NMR results. The limit of detection of NMR spectroscopy is 5-10%, that is why the result >90% was given when no more trace of starting material was detected.
Cleaning
Prior to the reaction, the reactor was initially rinsed by a stable dioxane-CO flow during 30 min with the reactor temperature well controlled. Then, the dioxane syringe was replaced by a syringe containing the reaction liquid phase, and the reaction was carried out, collecting the solution from the outlet of the microreactor in a new vial (synthesized product vial). After the reaction, the reactor was thoroughly rinsed again with a stable dioxane-CO flow for 15 minutes.
Figure 2: a) Picture of the entire installation; b) Microreactor being back-illuminated by a diffuse LED lamp, with thermocouple below (thermocouple above does not appear on
this picture)
Figure 4: Experimental set-up used for aminocarbonylation reaction
Decomposition of CO2 into CO by DBD plasma
Microreactor & Fluidic set up
A biflow reactor with combed-shaped copper electrodes was used for the CO2 splitting. The microreactor was coated of
PDMS (PolyDiMethylSiloxane) to avoid parasite discharges outside of the reactor. Details about electrodes deposition and reactor assembly are given in Electronic Supplementary Information (ESI). A such configuration corresponds to a double-DBD configuration, with two dielectric layers (glass) protecting the electrodes from direct contact with the plasma. This configuration prevents electrodes degradation which could shorten electrodes’ lifetime and may introduce metallic nanoparticles into the reactive system. A mixture of CO2 and Ar
has been used in our experiments, since the addition of argon leads to a higher conversion of CO2 to CO 58,59, due to a
reduction in the plasma breakdown voltage, and a charge exchange with Ar+ argon ions increasing the CO2+ population.
The mixture of Ar and CO2 via a T-mixer was managed by mass
flow controllers (Bronkhorst EL-FLOW PRESTIGE FG-201CV) in the range of 0.125 – 0.25 sccm for CO2 and 2.25 – 2.375 sccm
for Ar, to one of the inlets of the reactor, while the other was sealed. One of the reactor outlets was sealed while the other outlet was connected to a gas sampling bulb. The outlet of the bulb was connected to a bubble flowmeter for a regular flowrate control during the experiment, ensuring the absence of leakage.
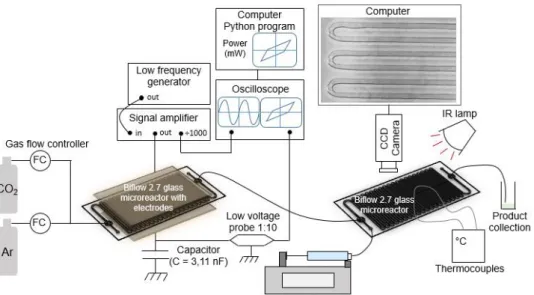
Electrical set up
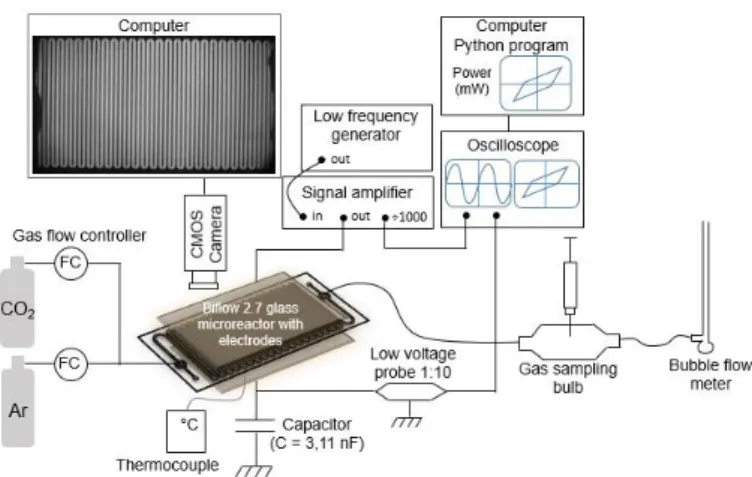
A sine wave signal (AC) was sent from a function generator (ELC, GF467F, 5MHz) to a voltage amplifier (TREK 10/40A high voltage amplifier ×1000) which multiplies the input voltage by 1000. This high voltage was applied to the microreactor and a 3.11 nF capacitor in series and was monitored with an oscilloscope (PicoScope 5000 Series) through the 1000:1 outlet of the amplifier. The capacitor was used to obtain discharge electric charge necessary to calculate the discharge power, and the capacitance voltage was measured via a low voltage proble (Teledyne LeCroy PP024 500 MHz 10:1). The frequency used was between 1000 and 3000 Hz, and the high voltage was between 9 and 18 kVpp. Figure 5 shows the diagram of the experimental setup.
Power assessment
The measurement of the discharge power supplied to
the microreactor was determined using the Lissajous
method and is described in ESI. The corresponding
standard deviation of the calculated power lies below
3%.
Gas analysis
After 20 minutes’ reaction (necessary time for the system to achieve the steady state), the gas leaving the microreactor was collected from the bulb with a syringe and was injected into an
Agilent Technologies 490 Micro GC equipped with two columns (column PoraPLOT U, 10 meters long with heated injector, and column Molesieve 5A with backflush capability and heated injector) and micro-machined Thermal Conductivity Detector (TCD). Calibrations were made for CO/Ar and CO2/Ar mixtures distinctly with mixtures of known compositions. Each experiment was conducted three times.
Temperature measurement
A thermocouple was positioned under the reactor (blue cable on Figure 6) to measure the temperature at the surface of the bottom PDMS layer. The temperature inside microchannels was supposed to be equal to this temperature, thus neglecting the thermal resistances of the PDMS coating and the glass slide relatively to the convection boundary layer. The temperature was recorded once stabilized.
Figure 5: Experimental set-up for CO2 splitting reactions
Figure 6: Picture of the plasma microreactor with fluidic connections and electrical connections, and thermocouple in contact with the bottom PDMS layer surface
Coupling
The two microreactors previously described were set in line to carry out the aminocarbonylation from CO2. In the first
microreactor, the decomposition of CO2 into CO by plasma was
achieved as explained above, and the outlet gas mixture was introduced directly into the second microreactor along with the liquid phase for aminocarbonylation reaction.
The second microreactor was heated to the appropriate temperature with IR lamp and thermocouples, and the gas-liquid flow was observed by the CCD camera, as explained before. The cleaning protocol was similar to that used for aminocarbonylation reaction prior and after the reaction. The liquid was collected at the outlet of the second reactor during 45 min. The collected liquid was analysed by 1H NMR
spectroscopy.
Results & discussion
Aminocarbonylation from commercial CO
Aminocarbonylation reaction was first studied using commercially available CO in order to find the optimized conditions leading to a maximum conversion of substrate into amide 1.
Optimization of the temperature
In a first time, the reaction temperature was optimized, starting from 80°C which was the reaction temperature in batch process according to C. Lescot et al 16. All the reactions were performed
with a liquid flowrate of 10 µL/min, corresponding to a liquid residence time of 60 seconds, and a CO flowrate of 1.5 sccm. Under these conditions, the CO was in excess, the molar ratio between CO and the substrate being 80. Results are shown in Table 1. A full conversion was obtained for temperatures above 50°C (Table 1, entries 1 - 4). Reducing the reaction temperature to 40°C and 30 °C resulted in conversions of 81% and 76% respectively (Table 1, entries 5 and 6). Finally, 56% conversion was obtained at room temperature (Table 1, entry 7).
The optimized temperature was then found to be 50°C with a full conversion after 60 s residence time (Table 1, entry 4). To compare with the batch process (details in ESI), only 41% conversion was obtained for a reaction time of 45 min at 50°C. The better result obtained in microfluidic conditions can be explained by the intensified gas/liquid transfer thanks to the very large surface area to volume ratio. In all that follows, the temperature was set to 50°C.
Optimization of the liquid residence time
The liquid residence time is a key parameter in this study, as the aminocarbonylation reaction takes place in the liquid phase. The liquid residence time is calculated by dividing the volume of the liquid phase in the microreactor by the liquid flowrate. The residence time of the liquid was varied by changing the liquid flowrate. The CO flowrate was adjusted to keep the stable gas/liquid flow inside microchannels.
Starting from previously optimized parameters (Table 2, entry 1), the liquid residence time was reduced to 40 s by increasing the liquid flowrate to 15 µL/min, and a full conversion was still obtained (Table 2, entry 2). Reducing further the liquid residence time to 30 s resulted in a 62% conversion (Table 2, entry 3). This low conversion may be explained by the residence time which is too short to allow the reaction to reach completion. Hence, the optimized liquid residence time was 40
s corresponding to a liquid flowrate of 15 µL/min, and has been kept thereafter.
The CO flowrate was slightly reduced to 2.5 sccm, leading to full conversion. With these conditions, a 95% isolated yield of amide
1 was obtained.
Study of the CO volume concentration in the gas phase
Then, the influence of CO volume concentration in the gas phase was studied in order to be both in conditions close to the actual coupling conditions where the conversion of CO2 to CO
by plasma is low, but also close to radiolabeling conditions where 11CO2 is diluted in low concentration in a carrier gas.
Ar/CO mixtures of various CO volume concentrations in the gas phase (100%, 5.6%, 1.1%, and 0.6%) were injected while the total gas flowrate was maintained at 2.5 sccm and the liquid flowrate was 15 µL/min. These CO volume concentrations corresponded to CO to substrate molar flow ratio FCO/FSUBSTRATE
of 89, 5, 1 and 0.5 respectively. Calculation details are given in ESI. The results are shown in Table 3. The reaction with previous optimized parameters corresponds to a CO volume concentration of 100% and a CO to substrate molar flow ratio FCO/FSUBSTRATE of 89 (Table 3, entry 1). The results indicate that
the conversion decreases by decreasing the CO volume concentration, because of the decreasing quantity of CO entering the liquid phase. Despite the CO excess, the conversion for FCO/FSUBSTRATE = 5 was not complete, and can be explained by
slower kinetics, either because the mass transfer is slower or because the intrinsic kinetics of the reaction are slower. On the other hand, the result at 1.1% CO volume concentration (Table 3, entry 3) was very promising for the future, because despite the low conversion of CO2 into CO by plasma, a good conversion
of the substrate into the amide 1 can be expected for coupling.
Influence of the liquid residence time in equimolar conditions
Keeping a CO volume concentration of 1.1% (FCO/FSUBSTRATE = 1),
the influence of the liquid residence time on the substrate conversion was studied by varying the liquid flowrate (3rd
column, Table 4). The total gas flowrate was also adjusted in order to ensure a stable gas-liquid flow (4th column, Table 4),
while the CO volume concentration was fixed at 1.1% in the CO/Ar mixture. CO was supplemented with argon (6th column,
Table 4) to reach the total gas flowrate. Calculation details about flowrates, and the estimation of pressure drop (5th
column, Table 4) and CO partial pressure (6th column, Table 4)
are given in ESI.
Contrary to what we could expect, conversion decreases with the liquid residence time. This unexpected result can be explained by the decrease, even moderate, of the CO partial pressure. Indeed, to increase the liquid residence time from 40 to 80 seconds, the gas and liquid flowrates were decreased, leading to a decrease of the inlet pressure, and therefore the CO partial pressure at the reactor inlet. For example, the partial pressure of CO at the reactor inlet decreases by roughly 25% when the liquid residence time was multiplied by a factor 2. Hence, this decrease of CO partial pressure could explain the decrease of substrate conversion, as less CO was transferred to
the liquid phase. Those results suggest that the CO diffusion at the gas/liquid interface can be a hindering step for reactions under low pressure conditions, contrary to the work of Jensen et al 60 where reactions are conducted with high CO pressures
(2.8 – 13.8 bars) that suggest that the oxidative addition was the rate-limiting step below 120°C.
Entry Temperature (°C) [error +/- 1°C] Conversion of p-iodoanisole into amide 1 (%) Standard deviation (%)† 1 80 >90 0 2 70 >90 0 3 60 >90 0 4 50 >90 0 5 40 81 ± 14 6 30 76 ± 8 7 20 56 ± 8
Table 1: Optimization of temperature, for a 10 µL/min liquid flowrate and 1.5 sccm CO flowrate
† Standard deviation calculated from the different measured substrate conversions obtained for the same experimental conditions
Entry Liquid flowrate (µL/min) Liquid residence time (s) CO flowrate (sccm) Conversion of p-iodoanisole into amide 1 (%) Standard deviation (%) 1 10 60 1.5 >90 0 2 15 40 3.0 >90 0 3 20 30 4.0 62 ± 4
Table 2: Optimization of the liquid residence time, at 50°C
Entry CO volume concentration (%) Conversion (%) Standard deviation (%) 1 100 89 90 ± 7 2 5.6 5 61 ± 7 3 1.1 1 53 ± 10 4 0.6 0.5 14 ± 3
Entry Liquid residence time (s) Liquid flowrate (µL/min) Total gas flowrate (sccm) Inlet experimental partial pressure of CO (mbar) Conversion (%) Standard deviation (%) 1 40 15 2.5 21 53 ± 10 2 60 10 1.8 17 33 ± 3 3 80 7.5 1.3 16 30 ± 11
Table 4: Influence of the liquid residence time in equimolar conditions at 50°C, CO volume concentration = 1.1%
Comparing Table 2 and Table 4, it can be concluded that the influence of the liquid residence time on the substrate conversion depends on the percentage of CO in the gas mixture: if the CO is in excess in regard to the substrate, the conversion increases with the residence time (Table 12), on the other hand, if the CO is not abundant supply, the increase of the residence time can negatively affect the conversion because of the influence of the gas flowrate on the CO inlet partial pressure (Table 4).
Aminocarbonylation from CO resulting from the splitting of CO2 by
DBD plasma
Determination of plasma parameters
In the previous part, it has been shown that, using a gas-liquid microreactor, it is possible to obtain good conversions with CO volume concentrations in the gas phase as low as 1%. The objective of this second part is to find operating conditions allowing the production of such CO volume concentrations from CO2 splitting using a plasma DBD microreactor. In this part, the
liquid and gas flowrates are fixed at 15 µL/min and 2.5 sccm respectively.
The decomposition of CO2 into CO by DBD plasma was studied
with CO2/Ar mixtures of 10/90 and 5/95 volume ratios. Indeed,
Ramakers and al. showed that addition of Ar led to higher CO2
conversions, and the effect was more pronounced for Ar fractions above 70% 58.
For each gas mixture, various plasma parameters (voltage, frequency) were used to vary Specific Energy Input (SEI), defined as the ratio of the discharge power to the gas flow rate:
𝑆𝐸𝐼(𝐽 𝑚𝐿) = 𝑃𝑜𝑤𝑒𝑟 (𝑊) 𝑡𝑜𝑡𝑎𝑙 𝑓𝑙𝑜𝑤𝑟𝑎𝑡𝑒 (𝑚𝐿 𝑚𝑖𝑛) × 60( 𝑠 𝑚𝑖𝑛)
The specific energy input is generally considered as the characteristic parameter of the plasma discharge.
The influence of the SEI on the reactor temperature, the CO volume concentrations at the outlet and the CO2 conversion
were studied for each gas composition.
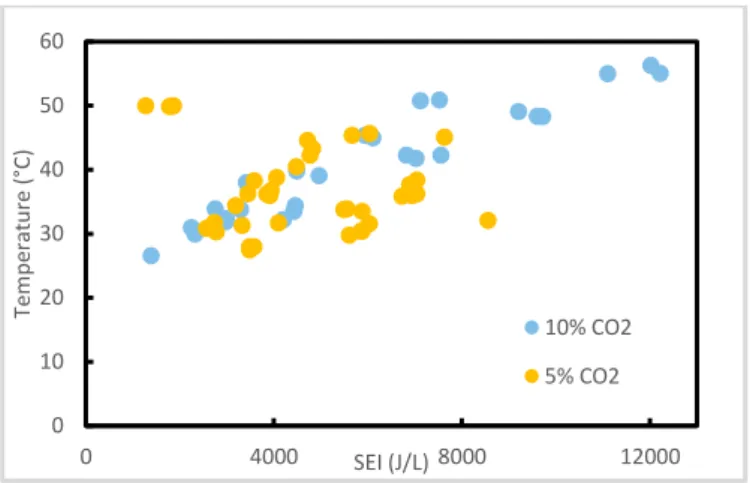
Temperature
The reactor temperature was monitored with the thermocouple. It can be observed that the reactor temperature increased linearly with SEI for a given gas composition, while the temperature never exceeded 60 °C. The temperature is moderate because of fast dissipation of the low amount of heat generated by the plasma thanks to the high surface to volume ratio of the microreactor.
CO2 conversion
The CO2 conversion is defined as the change in CO2
concentration over the initial CO2 concentration.
𝑋𝐶𝑂2 𝑎𝑏𝑠(%) =
%𝐶𝑂2 𝐼𝑁𝐿𝐸𝑇− %𝐶𝑂2 𝑂𝑈𝑇𝐿𝐸𝑇
%𝐶𝑂2 𝐼𝑁𝐿𝐸𝑇
× 100 Where %CO2 INLET and %CO2 OUTLET represent the volume
concentration of CO2(in %) before applying plasma discharge
and the volume concentration of CO2(in %) at the outlet of the
reactor after 20 min run, respectively. %CO OUTLET represents the
volume concentration (in %) of COproduced at the outlet of the reactor.
In Figure 8, CO2 conversion is plotted according to SEI. For both
gas mixtures, increasing SEI led to an increase in the conversion of CO2. Increasing input power could effectively enhance the
electrical field, electron temperature, electron density and gas temperature in the discharge, which contributes to the improvement of CO2conversion. However, the CO2 conversion
with SEI was higher for the 5% CO2 mixture in comparison with
the 10% CO2 mixture. This is what is generally reported in the
literature. 58 There are 2 possible explanations: firstly, the more
argon there is, the more the dielectric strength of the gas mixture decreases, which makes it possible to benefit a greater amount of energy available for the dissociation of CO2;
secondly, the charge and energy transferred from excited Ar species to CO2molecules increase with a higher Ar content and
there was a higher chance for the CO2 molecule to collide with
radicals or excited Ar.
CO volume concentration
In Figure 9, the CO volume concentration (in %) produced by the decomposition of CO2 is plotted as a function of the SEI. We can
observe that the CO volume concentration increased when SEI increased for the gas mixture with 10% CO2 in Ar, but remained
almost constant for the gas mixture with 5% CO2 in Ar. Although
the increase of the Ar ratio has a positive impact on the conversion of CO2 as we observed previously, it can also have a
limiting effect as we can see here. Indeed, we can suppose that the charge transfer process between the Ar+ or Ar2+ ions and
CO2 (Ar+ + CO2 → Ar + CO2+), followed by the dissociative
electron-ion recombination of the CO2+ ions (CO2+ + e- → CO +
O), is limited if the amount of CO2 decreases, and so Ar+ or Ar2+
ions are less likely to meet CO2 molecules to produce CO. A
maximum percentage of CO of 1.6% ±0.4%, corresponding to a CO yield of 16%, was obtained for 10% CO2 in Ar with a
frequency of 3 kHz and a voltage of 12 kVpp. In these conditions, the conversion of CO2 was equal to 17.0% ±5.7%, that is
approximately equal to the CO yield and assume that the production of other carbon containing products is negligible. The temperature was around 42°C, and the discharge power was around 300 mW.
The CO volume concentration was determined by means of a calibration previously done on the µGC using very low CO flowrates to have a wide range of CO volume concentrations, which can imply uncertainties on the flowrates. This could explain the high uncertainties of the results here.
In the previous study of aminocarbonylation from commercial CO, we obtained 53% conversion for a CO volume concentration of 1.1%. So, the maximum CO volume concentration of 1.6% ±0.4% obtained from the decomposition of CO2 by plasma
should be enough to carry out successfully the aminocarbonylation reaction in line.
Figure 7: Graph of the temperature as a function of the SEI
Figure 8: Graph of the CO2 conversion as a function of the SEI
Figure 9: Graph of the CO volume concentration at the outlet as a function of the SEI
Splitting of CO2 by DBD plasma coupled with aminocarbonylation
in line
The two microreactors were assembled (Figure 10) to carry out the aminocarbonylation reaction with CO synthesized in situ from decomposition of CO2 by plasma. The first microreactor
was dedicated to the decomposition of CO2 into CO by plasma,
and the experimental conditions were a total gas flowrate of 2.5 sccm composed by CO2/Ar mixture of 10/90 volume ratio, 3 kHz
and 12 kVpp. The out-flowing gas moved into the second microreactor, in which the aminocarbonylation takes place, with a liquid flowrate of 15 µL/min at 50°C. This reaction was performed twice, and 70% conversion of the substrate into amide 1 was obtained each time. This result is closed to conversions obtained using commercial CO at similar low CO concentrations (Table 3, entry 2 & 3), the liquid residence time being 40 s for both cases. For the first time, aminocarbonylation was performed from CO2 using a 2-step microfluidic synthesis,
within a total residence time shorter than 1 min.
0 10 20 30 40 50 60 0 4000 8000 12000 Te m pe rat ur e ( °C) SEI (J/L) 10% CO2 5% CO2 0 10 20 30 40 0 5000 10000 C O 2 co nv er si o n (%) SEI (J/L) 10% CO2 5% CO2 0,0 0,4 0,8 1,2 1,6 2,0 0 2000 4000 6000 8000 10000 12000 C O v o lum e c o nc ent rat io n (%) SEI (J/L) 10% CO2 5% CO2
Figure 10: Experimental set-up for coupling synthesis Entry Liquid flowrate (µL/min) Liquid residence time (s) Gas flowrate (sccm) CO2 flowrate (sccm) Ar flowrate (sccm) Conversion of p-iodoanisole into amide 1 (%) Standard deviation (%) 1 15 40 2.5 0.25 2.25 70 0
Table 5: Results of aminocarbonylation from CO produced by the splitting of CO2
Conclusion and outlooks
In this work, amide 1 was synthesized from CO2 with high yield,
under mild conditions, thanks to an innovative process combining microfluidics and plasma. This innovative process could also be used to carry out other carbonylation reactions, and could be transferred in carbon-11 chemistry for carbon-11 radiolabeling for PET. The combination of plasma and microfluidics allows to reach a very short total process time and the radiolabeling process is no longer limited by the very short half-life of carbon 11, while keeping milder conditions compared to conventional methods. The 11
C-labeled-carbonylative molecules could be synthesized, purified and analysed in less than 40 min without making any compromise
between radiochemical yield (RCY) and radioactive decay. Such a process of carbonylation starting from CO2, leading to this high
substrate conversion with such mild conditions, is unprecedented in the literature and exceeds the limitations encountered so far. In addition to the radiolabeling application, the synthesis in-situ of CO is a real advantage for safety constraints since the CO is not being directly handled.
Conflicts of interest
There are no conflicts to declare.
This work has received the support of "Institut Pierre-Gilles de Gennes" (laboratoire d’excellence, “Investissements d’avenir” program ANR-10-IDEX-0001-02 PSL and ANR-10-LABX-31; équipement d’excellence, “Investissements d’avenir” program ANR-10- EQPX-34).
Notes and references
1 Substrate conversion (%) = AB
where A is the area of the peak of methoxy group of amide 1 (at 3.81 ppm) and B is the area of the peak of methoxy group of amide 1 (at 3.81 ppm) + the area of the peak of methoxy group of p-iodoanisole (at 3.75 ppm)
1 P. W. Miller, N. J. Long, R. Vilar and A. D. Gee, Angew. Chem. Int.
Ed., 2008, 47, 8998–9033.
2 G. Antoni, T. Kihlberg and B. Långström, in Handbook of
Radiopharmaceuticals, John Wiley & Sons, Ltd, 2005, pp. 141–
194.
3 B. H. Rotstein, S. H. Liang, M. S. Placzek, J. M. Hooker, A. D. Gee, F. Dollé, A. A. Wilson and N. Vasdev, Chem. Soc. Rev., 2016, 45, 4708–4726.
4 O. Itsenko and B. Långström, J. Org. Chem., 2005, 70, 2244– 2249.
5 B. Långström, O. Itsenko and O. Rahman, J. Label. Compd.
Radiopharm., 2007, 50, 794–810.
6 C. Taddei and V. W. Pike, EJNMMI Radiopharm. Chem., 2019, 4, 25.
7 O. Rahman, J. Label. Compd. Radiopharm., 2015, 58, 86–98. 8 S. Kealey, A. Gee and P. W. Miller, J. Label. Compd. Radiopharm.,
2014, 57, 195–201.
9 J. Eriksson, G. Antoni, B. Långström and O. Itsenko, Nucl. Med.
Biol., , DOI:10.1016/j.nucmedbio.2020.02.005.
10 G. Buscemi, P. W. Miller, S. Kealey, A. D. Gee, N. J. Long, J. Passchier and R. Vilar, Org. Biomol. Chem., 2011, 9, 3499. 11 P. J. Riss, S. Lu, S. Telu, F. I. Aigbirhio and V. W. Pike, Angew.
Chem. Int. Ed., 2012, 51, 2698–2702.
12 C. Taddei and A. D. Gee, J. Label. Compd. Radiopharm., 2018, 61, 237–251.
13 X.-F. Wu, H. Neumann and M. Beller, Chem. Rev., 2013, 113, 1– 35.
14 A. Brennführer, H. Neumann and M. Beller, Angew. Chem. Int.
Ed., 2009, 48, 4114–4133.
15 J. Magano and J. R. Dunetz, Chem. Rev., 2011, 111, 2177–2250. 16 C. Lescot, D. U. Nielsen, I. S. Makarov, A. T. Lindhardt, K.
Daasbjerg and T. Skrydstrup, J. Am. Chem. Soc., 2014, 136, 6142–6147.
17 E. D. Hostetler and H. D. Burns, Nucl. Med. Biol., 2002, 29, 845– 848.
18 M.-W. Wang, W.-Y. Lin, K. Liu, M. Masterman-Smith and C. K.-F. Shen, Mol. Imaging, 2010, 9, 175–191.
19 K. Dahl, C. Halldin and M. Schou, Clin. Transl. Imaging, 2017, 5, 275–289.
20 C.-C. Lee, Science, 2005, 310, 1793–1796.
21 G. Pascali, P. Watts and P. A. Salvadori, Nucl. Med. Biol., 2013,
40, 776–787.
22 J. M. Gillies, C. Prenant, G. N. Chimon, G. J. Smethurst, W. Perrie, I. Hamblett, B. Dekker and J. Zweit, Appl. Radiat. Isot., 2006, 64, 325–332.
23 C. J. Steel, A. T. O’Brien, S. K. Luthra and F. Brady, J. Label.
Compd. Radiopharm., 2007, 50, 308–311.
24 P. W. Miller, J. Chem. Technol. Biotechnol., 2009, 84, 309–315.
25 P. Watts, G. Pascali and P. A. Salvadori, J. Flow Chem., 2012, 2, 37–42.
26 H. Audrain, Angew. Chem. Int. Ed., 2007, 46, 1772–1775. 27 P. W. Miller, N. J. Long, A. J. de Mello, R. Vilar, H. Audrain, D.
Bender, J. Passchier and A. Gee, Angew. Chem. Int. Ed., 2007,
46, 2875–2878.
28 S. Kealey, C. Plisson, T. L. Collier, N. J. Long, S. M. Husbands, L. Martarello and A. D. Gee, Org. Biomol. Chem., 2011, 9, 3313. 29 P. W. Miller, H. Audrain, D. Bender, A. J. deMello, A. D. Gee, N. J.
Long and R. Vilar, Chem. - Eur. J., 2011, 17, 460–463.
30 K. Dahl, M. Schou, J. Ulin, C.-O. Sjöberg, L. Farde and C. Halldin,
RSC Adv., 2015, 5, 88886–88889.
31 M. Ferrat, K. Dahl, C. Halldin and M. Schou, J. Label. Compd.
Radiopharm., , DOI:10.1002/jlcr.3805.
32 T. Fukuyama, T. Totoki and I. Ryu, Green Chem., 2014, 16, 2042– 2050.
33 Chemical Bonds and Bonds Energy - 2nd Edition,
https://www.elsevier.com/books/chemical-bonds-and-bonds-energy/sanderson/978-0-12-618060-2, (accessed May 19, 2020).
34 J. C. Clark and P. D. Buckingham, Int. J. Appl. Radiat. Isot., 1971,
22, 639–646.
35 Y. Andersson and B. Langstrom, J. Chem. Soc.-PERKIN Trans. 1. 36 P. Lidström, T. Kihlberg and B. Långström, J. Chem. Soc. Perkin 1,
1997, 2701–2706.
37 An evaluation of a high‐pressure 11CO carbonylation apparatus - Dahl - 2015 - Journal of Labelled Compounds and
Radiopharmaceuticals - Wiley Online Library,
https://onlinelibrary.wiley.com/doi/full/10.1002/jlcr.3280, (accessed June 29, 2020).
38 S. K. Zeisler, M. Nader, A. Theobald and F. Oberdorfer, Appl.
Radiat. Isot., 1997, 48, 1091–1095.
39 Reduction of [11C]CO2 to [11C]CO using solid supported zinc - Dahl - 2017 - Journal of Labelled Compounds and
Radiopharmaceuticals - Wiley Online Library,
https://onlinelibrary.wiley.com/doi/full/10.1002/jlcr.3561, (accessed June 29, 2020).
40 W. Zhang, Y. Hu, L. Ma, G. Zhu, Y. Wang, X. Xue, R. Chen, S. Yang and Z. Jin, Adv. Sci., 2018, 5, 1700275.
41 K. Li, X. An, K. H. Park, M. Khraisheh and J. Tang, Catal. Today, 2014, 224, 3–12.
42 D. U. Nielsen, X.-M. Hu, K. Daasbjerg and T. Skrydstrup, Nat.
Catal., 2018, 1, 244–254.
43 G. Zhao, X. Huang, X. Wang and X. Wang, J Mater Chem A, 2017,
5, 21625–21649.
44 B. Kumar, M. Llorente, J. Froehlich, T. Dang, A. Sathrum and C. P. Kubiak, Annu. Rev. Phys. Chem., 2012, 63, 541–569.
45 B. Endrődi, G. Bencsik, F. Darvas, R. Jones, K. Rajeshwar and C. Janáky, Prog. Energy Combust. Sci., 2017, 62, 133–154. 46 A. Fridman, Plasma Chemistry, Cambridge University Press,
Cambridge, 2008.
47 R. Aerts, W. Somers and A. Bogaerts, ChemSusChem, 2015, 8, 702–716.
48 H. V. Boenig, Fundamentals of plasma chemistry and
technology, Technomic Pub. Co., Lancaster, 1988.
49 D. S. Laitar, P. Müller and J. P. Sadighi, J. Am. Chem. Soc., 2005,
127, 17196–17197.
50 C. Kleeberg, M. S. Cheung, Z. Lin and T. B. Marder, J. Am. Chem.
Soc., 2011, 133, 19060–19063.
51 M. Flinker, S. Lopez, D. Nielsen, K. Daasbjerg, F. Jensen and T. Skrydstrup, Synlett, 2017, 28, 2439–2444.
52 M. S. Moss, K. Yanallah, R. W. K. Allen and F. Pontiga, Plasma
53 U. Kogelschatz, B. Eliasson and W. Egli, J. Phys. IV, 1997, 07, C4-47-C4-66.
54 Wengler J, Ognier S, Al Ayoubi S, Tatoulian M (2019) Biphasic Plasma Microreactor and Method of Using the
Same, WO/2019/166570
55 J. Wengler, S. Ognier, M. Zhang, E. Levernier, C. Guyon, C. Ollivier, L. Fensterbank and M. Tatoulian, React. Chem. Eng., 2018, 3, 930–941.
56 M. Zhang, S. Ognier, N. Touati, I. Hauner, C. Guyon, L. Binet and M. Tatoulian, Plasma Process. Polym., 2018, 15, 1700188.
57 A. Lepoetre, S. Ognier, M. Zhang, J. Wengler, S. Al Ayoubi, C. Ollivier, L. Fensterbank, X. Duten, and M. Tatoulian, Plasma
Processes And Polymers, 2020, under review
58 M. Ramakers, I. Michielsen, R. Aerts, V. Meynen and A. Bogaerts, Plasma Process. Polym., 2015, 12, 755–763. 59 M. A. Lindon and E. E. Scime, Front. Phys., ,
DOI:10.3389/fphy.2014.00055.
60 J. S. Moore, C. D. Smith and K. F. Jensen, React. Chem. Eng., 2016, 1, 272–279.