HAL Id: hal-00111376
https://hal.archives-ouvertes.fr/hal-00111376
Submitted on 20 Sep 2019
HAL is a multi-disciplinary open access
archive for the deposit and dissemination of
sci-entific research documents, whether they are
pub-lished or not. The documents may come from
teaching and research institutions in France or
abroad, or from public or private research centers.
L’archive ouverte pluridisciplinaire HAL, est
destinée au dépôt et à la diffusion de documents
scientifiques de niveau recherche, publiés ou non,
émanant des établissements d’enseignement et de
recherche français ou étrangers, des laboratoires
publics ou privés.
Mechanical constraints on the chronology of fracture
activation in folded Devonian sandstone of the western
Moroccan Anti-Atlas
M. L. E. Guiton, W. Sassi, Y. M. Leroy, B. D. M. Gauthier
To cite this version:
M. L. E. Guiton, W. Sassi, Y. M. Leroy, B. D. M. Gauthier. Mechanical constraints on the
chronol-ogy of fracture activation in folded Devonian sandstone of the western Moroccan Anti-Atlas.
Jour-nal of Structural Geology, Elsevier, 2003, 25, pp.1317-1330. �10.1016/S0191-8141(02)00155-4�.
�hal-00111376�
Mechanical constraints on the chronology of fracture activation
in folded Devonian sandstone of the western Moroccan Anti-Atlas
Martin L.E. Guiton
a, William Sassi
a, Yves M. Leroy
b,*, Bertrand D. M. Gauthier
ca
Institut Franc¸ais du Pe´trole, Division de Ge´ologie et Ge´ochimie, 92852 Rueil-Malmaison Cedex, France b
Laboratoire de Me´canique des Solides, CNRS UMR 7649, Ecole polytechnique, 91128 Palaiseau Cedex, France cTotalFinaElf, Exploration-Production, 92078 La De´fense, France
The three-dimensional meter-scale fracture networks, observed on exposed folds between the towns of Tata and Akka, western Moroccan Anti-Atlas, consist mostly of planar discontinuities, which are sub-perpendicular to the bedding and partitioned in three main sets. The chronology of their activation is proposed in five stages since the Hercynian orogeny. Stage 1 predates folding and involves the horizontal compression of the Emsian sandstone. It involves fracture set I, composed of systematic joints parallel to the direction of compression. Stages 2 – 4 correspond to the folding and are marked in the outer-arc by the activation of fracture set II, composed mainly of joints parallel to the fold axial plane. Stage 5 is a regional shear event during which sets I and III, separated by an angle close to 608, are activated in a conjugate manner. To throw light on the recurrent difficulty in discriminating between activation of inherited and new fractures, an elasto-plastic model is used to construct a stress path in the pervasively fractured medium idealized as a continuum. Each fracture set obeys the Mohr–Coulomb criterion truncated in tension to describe both sliding and opening activations. Finite-element simulations of a simple buckling event accounting for the field fracture sets are presented. It is shown that set I cannot be generated by folding and thus does belong to stage 1. Set II is activated at a later stage of folding than expected from the field interpretation. Set III cannot be activated during stage 2, confirming its role in stage 5. The advantages and limitations of the proposed modeling are finally discussed.
Keywords: Anti-Atlas; Fractures; Joints; Folding; Finite-elements; Elasto-plasticity
1. Introduction
The first objective of this paper is to illustrate the recurrent difficulty of discriminating between various scenarios of fracture development during folding, in the absence of a well-constrained stress history. The second objective is to show how an elasto-plastic model, tailored for fractured media, can contribute to a better understanding of this stress evolution.
The permeability of a fractured reservoir depends largely on the geometry of its fracture network, which was partly determined by tectonic events (Stearns and Friedman, 1972; Nelson, 1985). Such networks include fractures at bedding thickness scale, which have an offset too small to be detected seismically and may not be accounted for by
statistical extrapolation from accessible data such as cores and image logs (Belfield, 1992; Gauthier et al., 2000). The fracture networks required for fluid-flow modeling in reservoirs have to be consistent with the interpretation of seismic data. For that purpose, it has been proposed, for example, to relate the density of fractures to the inferred curvature of the stratified beds (Lisle, 1994). This method assumes that fracturing is controlled by the deformation in extension and in compression in the outer- and inner-arc of the curved strata, respectively, and disregards the role of the in-situ stress prior to bending. This limitation is of concern since there are numerous field examples where geometri-cally-similar folded structures have sustained different stress histories (Stearns, 1964; Price, 1966). These histories are identified by pervasive markers such as faults or joints, which are either syn-folding or predate folding, but could have contributed nevertheless to the overall deformation (Hancock, 1985; Lewis and Couples, 1993).
*
Corresponding author. Tel.: þ 3358; fax: þ 33-1-69-33-3026.
Understanding the kinematics of folded structures in sedimentary basins from 2D cross-sections based on the area balance assumption (Suppe, 1985; Mercier et al., 1997), has been a prerequisite for the improvement of predicted fracture networks despite the complete absence of any stress prediction. A fundamentally different approach consists of proposing a mechanical model of the folding and of using a numerical scheme such as the finite-element method ( Nieuw-land and Walters, 1993; Sassi and Faure, 1997). The advantages of the kinematic and the mechanical approaches can be combined as follows. The fold geometry is well constrained with the help of the former method and should not necessarily be reconstructed independently as the solution of a complex boundary-value problem with the latter approach. However, rheological information has to be accounted for during the development of the imposed kinematics to simulate the activation or the genesis of pervasive discontinuities. Attempts have been made in that direction for major faults revealed by seismic, which are described as discontinuities generating a singular stress field, according to the linear elastic fracture mechanics theory (Pollard and Segall, 1987; Bourne et al., 2000). Setting aside
the role of these major faults, it is proposed here to investigate the relationship between meter-scale fractures and the stress state during tectonic folding by means of an elasto-plastic model proposed byLeroy and Sassi (2000)and extended by Guiton (2001). This model accounts for the presence of pervasive discontinuities having known orientations in the representative volume element and contributing to the overall irreversible deformation.
The contents of this paper are as follows. In the second section, an anticline composed of Devonian sandstone from the southern Anti-Atlas of Morocco is described to illustrate the relations between meter-scale fractures and folding. Particular attention is given to the fracture pattern variation over the anticline, to justify a discussion on the difference between genesis and reactivation of fractures. Evidence for both slip and opening accommodation is found on discontinuities having the same orientation, and a chrono-logical scenario of the fracture activation is proposed. In the third section, the elasto-plastic model of Leroy and Sassi (2000) is summarized. The boundary-value problem of a buckling fold is then presented. Three simulations, corre-sponding to different hypotheses on the mechanical proper-ties of the fracture sets, are considered to gain an insight into the chronology of the fracture activation prior to and during folding.
2. Systematic joints and syn-folding fractures in the Emsian sandstone beds of western Moroccan Anti-Atlas
The field example is a fractured reservoir analog whose geological context is first summarized. The orientation and the pattern of the meter-scale discontinuities on the anticline are then described, leading to a discussion on the differences in activation between the three main families of fractures. Finally, a chronology of the folding and of the fracture sliding and opening is tentatively proposed.
2.1. Geological setting
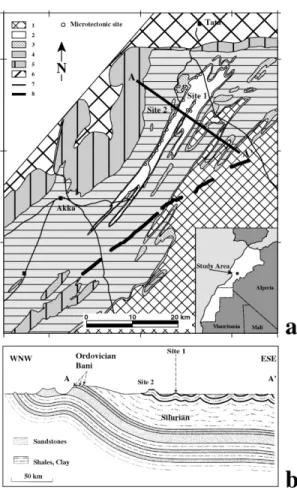
The sedimentary and tectonic histories of western Moroccan Anti-Atlas are discussed inHassenforder (1987) and Pique´ et al. (1990). The field study covers a 15 £ 30 km area oriented SW – NE between the cities of Akka and Tata. In this area, Silurian and Lower to Upper Devonian sediments are affected by a gentle fold system having a kilometer-scale wavelength with sub-vertical axial planes striking N0308. These units disappear toward the SE beneath Carboniferous deposits and to the NW against SE-dipping Ordovician sediments (Fig. 1a). The timing of this folding phase has, from geochemical constraints, been associated with the Hercynian orogeny since the Upper Devonian (Pique´, 2001). Anticlines have a length of the order of 10 km and are arranged en-e´chelon in the study area (Fig. 1a).Fig. 1bshows a WNW – ESE cross-section, afterCortes (2000)through the two sites labeled 1 and 2 inFig. 1a. The
Fig. 1. Geological setting of Tata and Akka areas, South Western Anti-Atlas of Morocco. (a) Structural map modified fromChoubert et al. (1981)with 1: Carboniferous, 2: Upper Devonian, 3: Middle Devonian, 4: Silurian – Lower Devonian, 5: Ordovician, 6: Cambrian, 7: road, 8: dyke. Measurement sites 1 and 2 are an anticline closure and a steeply dipping bar. (b) The A – A0cross-section modified fromCortes (2000).
wavelength of the folded Devonian beds is small compared with that of the Ordovician to Cambrian beds, suggesting an uncoupling due to the presence of thick Silurian shale units. The folds stop in the north against the Tata fault zone which strikes N1008 – N1108 and is inherited from Lower Paleozoic extensions. A right-lateral reactivation of this fault zone with small reverse movement is also invoked by Hassenforder (1987). The marked deviation of the fold axes, toward SSW – NNE in the vicinity of this fault (Fig. 1a) suggests that this reactivation is coeval with folding (Hassenforder, 1987).
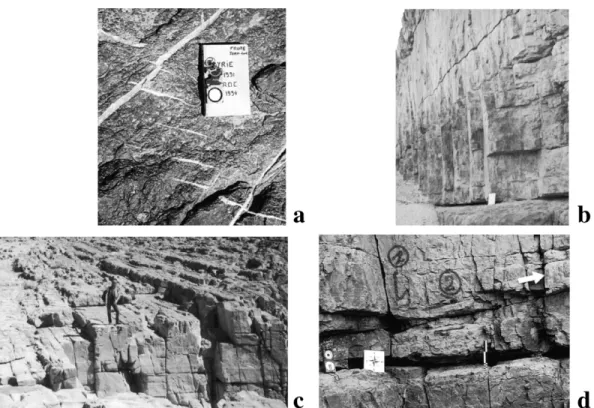
The Lower Devonian outcrops in the south of the Tata province are mainly composed of limestone and sandstone. A cyclic sedimentary deposition alternating these two lithologies with embedded shales and silts characterizes the Rich1 group (Hollard, 1981). Three sandstone beds (denoted A, B and C) were identified as belonging to the top of the third Rich called ‘El Ansar’ and corresponding to the Emsian (Lower Devonian). These beds can reach a total thickness of up to 20 m in the study area and are overlain by a thin richly fossiliferous (orthoceratite) calcareous bed. These sandstone beds give rise to a low relief on the landscape, displaying emerging fold limbs (site 2 in Fig. 2b), or gentle anticline terminations (Fig. 2a).
Microtectonic measurements were collected along the beds A, B and C and from two key locations: the first site is the termination of an anticline and the second is a fold limb affected by a shear deformation (sites 1 and 2 inFigs. 1a and 2). The observed meter-scale fractures include systematic joints, tension gashes, shear joints and faults with minor displacements. These fractures bear evidence of mechanical interaction with the folding process as discussed below. 2.2. Fractures in the Emsian sandstone
The most frequently encountered fractures in the
Emsian sandstone of the area are planar discontinuities that are sub-perpendicular to the bedding. Their classi-fication in terms of orientation leads us to distinguish three or, in a few locations, four sets of fractures, which strike N1358 (set I), N0358 (set II), N0708 (set III) and N1008 (set IV), respectively.
Each set is also characterized by a distinct fracture spacing, which is larger than a meter for set I, of the order of a meter for set II, and smaller for sets III and IV, wherever these last two sets are observable. The length along the bedding, although measurable at a few locations only, appears to follow a similar distribution with decreasing sizes from set I to IV. It is common to find fractures with length larger than 10 m for set I, and length of a few meters for set II (Fig. 3). The other sets are characterized by more closely spaced fractures of smaller size. The spacing and length of the fractures varies smoothly according to the location in the fold, as often recognized (Lewis and Couples, 1993; Petit et al., 2000). The thickness of the bed is also recognized by many authors as a fracture controlling factor (Ladeira and Price, 1981; Narr and Suppe, 1991). No systematic relation between bed thickness and fracture density or fracture extent has been obtained here. However, it seems that planar
Fig. 2. Studied outcrops from the third Rich (Emsian). (a) View to the North of the anticline closure of site 1. Note the wadi cross-cutting the anticline. Ordovician Bani and Tata fault zone are in the background. (b) View to the N2108 from the anticline top. The central part of the anticline is eroded and surrounded by highly dipping fold limbs. To the right, the eroded planar surface corresponds to a syncline and, along the Tata to Akka road, the dipping fold limb of site 2 is outlined. Ordovician Bani relief is in the background on the right.
Fig. 3. Structural surface displaying the triangular fracture network in the North of site 1.
fractures of set I generally cut the entire sequence A, B and C, while fractures of set II can be sorted into two classes (Fig. 4). The first class is made up of large fractures cross-cutting the A, B and C beds. Fractures of the second class are closely spaced (less than 1 m) and are confined between major bedding boundaries.
As often mentioned in the literature cited above and well illustrated in Hegelson and Aydin (1991), the lithology and the mechanical properties at the time of deformation are crucial in controlling fracture develop-ment. An observation pointing to this is that fractures of set III, which are well expressed in the Emsian competent sandstone, are not seen in the overlying limestone and that fractures of set I are replaced by en-e´chelon tension cracks (Fig. 5a). This last mechanism contrasts with the supposedly dynamic initiation and propagation suggested in the sandstone by the imprints of plumes on the fracture surfaces. The second observation in favor of lithology control is that fractures of set I extend downward from the bottom of sandstone bed C into the less competent siltstone to form typical twist-hackles (Fig. 5b), similar to those reported as dynamic features across bed interfaces (Engelder, 1987; Hegelson and Aydin, 1991). Also, these lithology contrasts highlight the activation of set II major fractures, defined as the first class above, as normal faults. This activation is recorded between sandstone and siltstone (see Fig. 13 in Leroy and Sassi, 2000).
Fig. 4. Fractures of set II in the NW – SE wadi cross-section with a 17-m-thick exposure of the three sandstone beds denoted A, B and C, which are alternating with siltstone beds.
Fig. 5. Fracture activation chronology. (a) Left-lateral activation of a set I fracture suggested by en e´chelon gashes in top limestone. The gashes are shifted by a right-lateral strike-slip of a set II fracture filled with quartzitic mineral. (b) Twist-hackles extend set I fractures from layer C to the bottom siltstone layers. (c) Minor reverse movement of set II fractures in the sandstone layer A shown by step-like structure in the western limb of site 1. (d) Sub-horizontal reverse fault cross-cutting set II major fractures in the western limb of site 1.
Strike-slip activations of set I and II are shown by offsets of quartz filled fractures in the sandstone bed A. Multiple lines of evidence of fracture activation with varied slip components are recognized in the third Rich of the site 1 anticline (Figs. 1a and 2). En-e´chelon cracks in the limestone, on top of set I fractures in the sandstone (Fig. 5a), demonstrate that these planes were reactivated with a left-lateral strike-slip motion. In addition, set II also bears evidence of reactivation with both a right-lateral (Fig. 5a) and a reverse (Fig. 5c) sense of motion in the western limb. Evidence of shortening is also associated with a unique flat-lying reverse fault, which cross-cuts set II major fractures and ends within the eastern fold limb (Fig. 5d). This observation suggests that this event occurred at a late stage of the folding evolution. Slickenlines have been measured on this fault indicating a NW – SE movement. In the western limb, where fractures of set II are reactivated as reverse faults, shortening is also marked by fluid circulations, particularly indicated along the fracture planes by quartzitic mineral filling (Fig. 5a). Thin sections from a few fractured sandstone samples of site 1, when observed under cathodoluminescence, reveal a fracture-free crystal growth perpendicular to the fracture wall. This observation points to a probably unique fluid circulation event post-dating the fracture genesis.
2.3. Fractures and folding
Of interest here is the relation between fractures and overall deformation. For that purpose, the present section documents the fracture patterns at different locations on anticlines of sites 1 and 2.
2.3.1. Fractures at the anticline termination
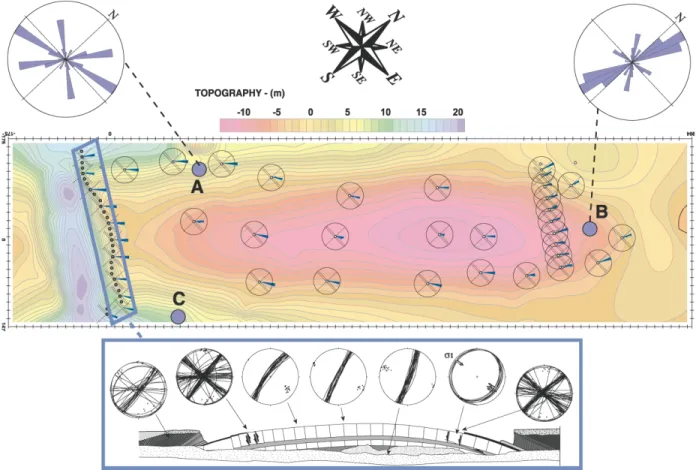
The first site is a bedding surface marking the termination of the anticline (Fig. 2a). Distribution of measurements of fractures and fault on this anticline termination are reported on the topographic map ofFig. 6, which corresponds to the top structural surface of the third Rich.
At location A (Fig. 6), the fracture network is sub-perpendicular to the bedding and mainly consists of two regular sets that are perpendicular (set I) and parallel (set II) to the fold axis, striking approximately N1258 and N0308, respectively. A third set striking N0758 is observed with an irregular distribution in a swarm shape and with fractures of smaller size. A few fractures also strike N1658. In the eastern limb at location C, set I planes strike N1308 while set II and set III strikes are shifted by an anti-clockwise angle of 208 to N0508 and N0958, respectively. A fourth system of fractures is trending NS at this location C. In the northern closure, at location B, there is a first fracture set striking
Fig. 6. Topographic map of site 1 anticline. The schematic cross-section shows stereograms for fault and fractures orientation along a natural cross-section of a wadi. Set II fracture strikes are given in the small rose diagrams distributed over the anticline while large rose diagrams group all the orientations. The strikes were estimated within rectangular areas of 5 £ 10 m at the western limb (point A) and 9 £ 11 m at the northern part (point B) for the two large rose diagrams.
N1458 with a very small scatter, as opposed to a second set with azimuths spanning between N0008 and N0308. A third set is oriented N0808 and a fourth direction is slightly expressed along N1658.
Description of the variation of the sets of fractures over the whole anticline requires additional data, which are available for set II in the form of small rose diagrams distributed between locations A, B and C. The first of two remarkable features of this set is its fan dispersion in strike, particularly clear in the northern part of the anticline: the NW – SE series of rose diagrams south of point B shows a smooth change of this strike from N0108 to N0408. The second feature is the change in dip angle of set II fractures on each limb side of the fold, as shown by the schematic cross-section. Note also that many of the planes of discontinuity defined by these fractures are not exactly perpendicular to the bedding, but are rather oriented toward a point located above the center of curvature.Cortes (2000) explains this as the result of shear parallel to bedding planes. However, no observation of bedding planes slip has been made in the anticline studied here.
2.3.2. Fractures in fold limbs
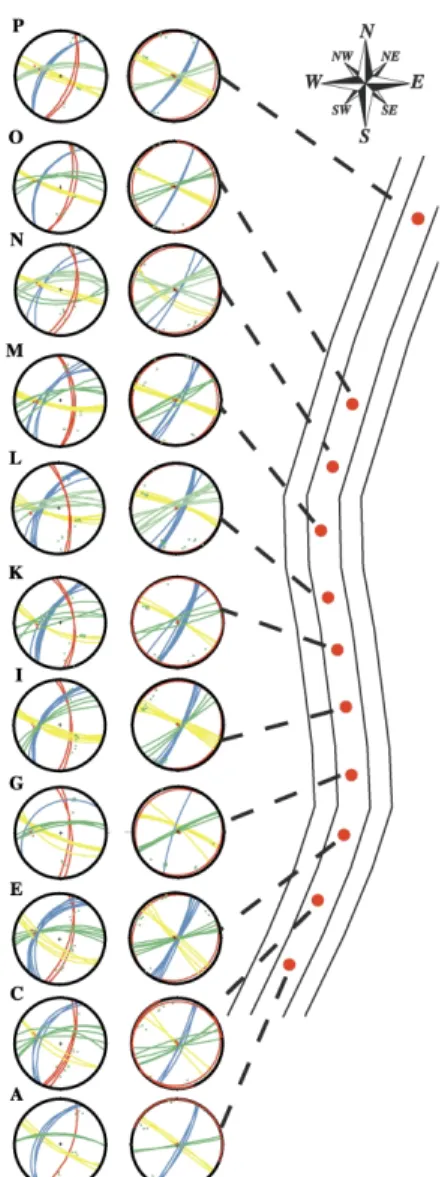
The second site of interest is located in the northern part of a steeply dipping fold limb (Figs. 1a and 2). Fig. 7 presents the results of a series of 11 micro-tectonic sites over 200 m at the top of the third Rich bed A. They are labeled by the letters A – P as one moves from south to north. At each site, two stereograms are represented. The red curves define the present orientation of the bedding. With a rotation around the bedding plane strike, this orientation is brought back to the horizontal plane and the fracture sets are thus oriented with respect to this new horizon in the right column. The left and right stereograms are referred to as the current and the horizontal configurations in what follows.
InFig. 7, it is seen that the sandstone bar is affected by a left-lateral shear along a SE – NW direction. The variation in orientation of a given fracture set in the horizontal configuration can be used to infer whether this family was formed before, during or after this shear deformation event, as discussed below. Set I (yellow curves) is constituted of planes with negligible scatter in azimuth varying from N1408 in the south to N1158 in the north. Set II (blue curves) contains fractures that are regularly striking N0258 – N0308. The regularity of these two sets in the horizontal configuration supports the interpretation of their genesis before or at an early stage of the folding, but certainly before the shear event. This conclusion is confirmed by the slight counter-clockwise rotation of these planes in the deviation zone, which is apparent in the current configuration diagram. Set III (green curves) shows a regular trend N0708 – N0808 in the zones undisturbed by shear (diagrams A – E, O and P) and a more scattered pattern in the deviation zones (diagrams I – N). This observation proves that new fractures have been created in set III during the shear event.
2.4. Structural significance of fracture sets
The interpretation of the fracture development described above is now conducted in two steps outlined in the next two sections. Attention is first focused on the mechanism responsible for the genesis of the three main fracture sets. Then, a discussion on the role of the fractures in the fold development is provided.
2.4.1. Set I: a family of systematic joints
Over the whole region between Tata and Akka, the regularity of set I, which is composed of planar fractures with length and vertical extent often greater than 10 m, is characteristic of systematic joints as defined in Engelder (1987) and Hegelson and Aydin (1991). The question of the
Fig. 7. Wulff lower hemisphere stereograms from various locations along the fold limb at site 2. The 200-m-long bar sustains a NW – SE left-lateral deviation from the fold axis, explaining the S shape of its schematic representation. Yellow, blue and green curves are for sets I, II and III fracture sets, respectively. The red curves in the left column of stereograms provide the orientation of the bedding plane. The right column is obtained from the left, after a rotation around the bedding strike to bring back the bedding to the horizontal plane.
mechanical origin of systematic joints is complex and is still debated (Pollard and Aydin, 1988; Lorenz et al., 1991). Nevertheless, most of the proposed models rely on the assumption that a mode I opening prevailed. In the present field example, indications for opening propagation, such as plume structures on set I have been reported above. It seems that this genesis was strongly controlled by lithology contrasts, as indicated by twist-hackles in the silt beds underlying the sandstone bed C (Fig. 5b). In the limestone, on top of the third Rich sequence, set I orientation of discontinuities is not represented by systematic joints as in the sandstone, but by left lateral potential shear joints marked by aligned en e´chelon tension cracks (Fig. 5a). The genesis of set I systematic joints may thus have occurred at an early stage of the Emsian sedimentary history, before the consolidation of the overlying limestone, as supported by the hypothesis of a single mineralization event post-dating the genesis of set I fractures.
2.4.2. Set II: fractures parallel to the fold axial plane The dip and the strike of this set of fractures varies with the location in the fold. The strike is approximately coaxial with the fold in its limbs, with a slight variation in a fan shape, which is particularly clear in the fold northern closure. The dip angles, visible on the vertical cross-section described previously (cliff of site 1), are sub-perpendicular to the folded bedding. Tension in the outer-arc may have contributed to the development of this set as pure mode I fractures, to accommodate the bed lengthening due to fold curvature. However, it seems difficult to conclude that every fracture of set II is due to outer-arc tension. Indeed, the fractures of set II have been classified depending on their penetration through the beds, i.e. either through the individual beds A, B and C or through the whole sandstone sequence. In the latter case, evidence has been presented for both normal and reverse slip displacements that cannot be linked to and should postdate the opening of outer-arc joints. Also, these fractures extending through the whole sequence have a slight convex curvature with respect to the fold axis (Fig. 4). This curvature is a classical feature of fault linkage controlled by lithology (Mandl, 1988; Pollard and Aydin, 1988). However, the density of set II fractures increases strongly in the vicinity of the large fracture planes extending through the whole sequence, thus suggesting their reactivation.
2.4.3. Set III: shear fractures
Set III is characterized by an irregular spatial distribution (localized swarms) and a scattering in strike, in contrast with the two previous sets. This scattering is observed in particular where the fold axis deviates from N0308 (Fig. 7), indicating that the regional shear event has generated new fractures. Similarly, at site 1, set III is well expressed where left-lateral strike-slip motion has often been observed on set I. The interpretation proposed is that set III fractures are activated in a conjugate manner with the reactivation of
set I in left-lateral slip, although no evidence of strike-slip on set III fractures has been observed. This shear movement is linked to a rotation of the regional direction of compression from the initial N1308. Several factors could be responsible for such a rotation. It could either be of regional tectonic origin or due to the right-handed reactiva-tion of the major east-trending fault of Tata. It should also be added that the presence of inherited planar weakness
trending to N0708 cannot be excluded (Emran and
Chorowicz, 1992; Cortes, 2000). The activation of such an orientation could lead to an anisotropic material response, responsible for a local stress change. No field evidence has been found by the authors to distinguish between these various factors.
2.5. The role of fractures in a chronological scenario of folding
We are now in a position to discuss the chronology of the fracture development or reactivation during folding. As a preliminary, the formation of discontinuities between the Emsian and the Hercynian folding should be considered. These discontinuities could include set III fractures due to the reactivation of major faults (Emran and Chorowicz, 1992; Cortes, 2000) or set II normal faults resulting from Devonian extension (Emran and Chorowicz, 1992).
On the basis of the previously detailed observations, we consider five major stages for the fracture activation and folding development from the beginning of the Hercynian orogeny. The first stage is concerned with the quasi-homogeneous bed-parallel shortening that took place before folding. Our observations point to a genesis of set I fractures in systematic joints parallel to the regional direction of compression. From Hollard (1981) and Pique´ (2001), the third Rich sandstone sequence is supposed to have been 20 – 30 My old and buried at shallow depths at the beginning of the Hercynian orogeny.
The second stage is marked by the onset of periodic folding. As previously mentioned, fold disharmony has been noted between the Upper Silurian – Devonian and the Cambrian – Ordovician series, due to a thick bed of intervening Silurian shales. Within the third Rich sequence, each sandstone bed A, B and C has played the role of a mechanical entity that needed, if competent, to develop set II joints in the outer-arc to accommodate the extension.
The third stage of the folding involves a minor collapse of the structure due to outer-arc extension and is marked by the activation of normal faults in set II.
The fourth stage of our interpretation is concerned with a locking of the fold suggested by reverse slip activation on faults of set II, in the western limb of the fold. A flat-lying reverse fault in the outer-arc zone (Fig. 5d) cuts through the faults of set II in the eastern limb and indicates that this stage post-dates the second one. The interplay of this flat-lying fault and the folding is not clear, because the fault offset remains quite small. However, field observations in
Cortes (2000)point to the presence of similar faults in the area, which have evolved in thrust, accommodating a horizontal compression simultaneously with the fold development. A horizontal shortening is also locally expressed in the fold limbs, where fractures of set II are activated as reverse faults, by manifestations of a single event of fluid circulation.
It is proposed that the final chronological stage consists of a regional shear event that has been recorded at both sites, and which is possibly linked to a counterclockwise rotation of the direction of compression. This shear event is locally accommodated by left-lateral strike-slip on set I with the synchronous development of set III striking around N0708. The chronology of fracture activation that has just been proposed is confronted in the next section to the solution of a boundary value problem to gain further insight into the stress histories.
3. A mechanical model for pervasively fractured rock and folding
One of the reasons for the difficulty in analyzing the fracture chronology is the complex evolution in time of the stress tensor that controls their activation. The link between stress-state, activation of local fractures and overall deformation has been discussed at length in the literature and a summary is found in Guiton (2001). It is proposed here to employ a constitutive model that accounts for the presence of inherited fracture sets or the genesis of syn-folding fractures. The 3D buckling of a strip of rock which is then considered provides a first insight into the fracture chronology of the field example.
3.1. Constitutive model for a fractured rock mass
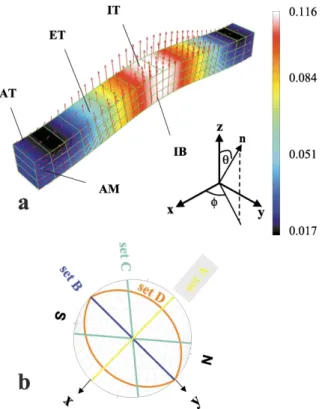
The model used in the next two subsections is presented inLeroy and Sassi (2000)and extended to account for finite rotation by Guiton (2001). The fractured rock mass is considered as a continuum, relying on the hypothesis that slip along or opening of any discontinuity occurs over a length that is small compared with the characteristic length of the representative volume element (RVE). Discontinu-ities are planar and grouped by orientation. Each orientation defines thus a set of fractures. Each set is oriented by the unit normal vector n(u,c) to the planar direction, in terms of the two Euler anglesuandcdefined inFig. 8.
The activation of discontinuities in a given set is seen as a micro-scale event and the controlling factor is the traction vector s·n deduced from the uniform stress or macro-stress s prevailing over the RVE. The norm of the tangential component of the traction vector defines the resolved shear stress:
t¼ s·n 2k snnk withsn¼ n·s·n; ð1Þ
in whichsnis the normal component of the traction vector.
The micro-scale slips contribute to the irreversible equiv-alent sheargdefined at the macro-scale set by the RVE size. The activation of this shear mechanism is described by the following Mohr – Coulomb yield criterion:
fSðs;gÞ ;tþmsn 2 cSðgÞ # 0
with cSðgÞ ¼ cS0þ cS1g; ð2Þ
in which m is the friction coefficient and cSis the cohesion which increases linearly from cS0 with g, at a constant hardening rate cS1. This yield criterion is truncated in the tensile range to introduce the second irreversible defor-mation mechanism. It is a macro-scale dilation d, resulting from the micro-scale opening of every discontinuities sharing the same orientation. This activation is controlled by:
fOðs; dÞ ;sn 2 cOðdÞ # 0 with cOðdÞ ¼ cO0þ cO1d; ð3Þ
where cOis a tensile strength which linearly increases from cO0with d, at a constant hardening rate cO1.
Eqs. (1) – (3) define the activation of a single set of planar discontinuities that contribute to the macro irreversible shear or dilation strain with the addition of a flow rule (see Leroy and Sassi (2000)for further information). It remains then to add the contribution of every set considered to define the complete macro-scale irreversible deformation and to predict the stress rate for a given macro-strain rate. This sum
Fig. 8. The shape of the buckle fold for simulation 3. (a) The displacement is represented by isocurves of its norm in km and by arrows at the mesh nodes. (b) The stereogram indicates the orientation of the pervasive discontinuities considered in the simulations, with the sets A, B and C oriented as sets I, II and III in the field.
is the main difference between the present model and a simple Mohr – Coulomb yield criterion with a single internal variable. Memory of formerly activated sets is retained with no coupling in hardening between the various sets. It should be added that a rate-dependent version of this simple model is adopted during the simulations for sake of numerical stability. A linear overstress viscosity function is considered and is documented inGuiton (2001).
This simple rheological model describes the activation of slip or opening in a given orientation with five parameters, which are the friction coefficient, the initial shear and tensile strength, cS0and cO0, and the two hardening moduli cS1and cO1. Hardening is necessary to avoid shear-band instability for rate-dependent materials (Leroy and Ortiz, 1990). It corresponds to an increase in the difficulty to either shear or dilate the rock mass beyond first yield. Hardening is commonly accepted in fracture mechanics and is related to the resistance or R curve (e.g. Broek, 1987). The five rheological parameters are also instrumental in differentiat-ing between inherited sets and new sets (Guiton, 2001). Non-cemented systematic joints in the RVE are assigned low values of the hardening moduli, initial cohesion and tensile strength. New orientations are given larger values. The model has thus the advantage of accounting for an initial anisotropy in the material response.
3.2. Constraint on the fracture chronology of the field example
The model problem is now presented, including the provision of the rheological properties of the fracture sets. The results of three simulations are then discussed providing a new insight into the chronology which must have prevailed in the field.
3.2.1. Model problem
Consider a planar bed of length L and thickness h set to 2 km and 200 m, respectively (Fig. 8). These dimensions were chosen to represent the characteristic wavelength of the folding and the thickness of a mechanical unit constituted of Devonian sandstone. These sediments are uncoupled from the underlying sequences because of the thick Silurian shales and are thus assumed to constitute the competent unit which buckled. The bed is of infinite width in the second horizontal direction with no displacement in that direction, for sake of simplicity. It is thus sufficient to consider a strip of an arbitrary 200 m width in the following. Mechanical equilibrium is enforced by a finite-element approximation of the principle of virtual work (Guiton, 2001).
The mid-surface of this strip is initially at a depth of 1 km and the vertical stress gradient results from the lithostatic pressure based on a volumetric mass of 2200 kg/m3. Although the accurate determination of this depth is difficult to obtain from field data, the proposed value is certainly of the right order of magnitude. The two principal horizontal
stresses are equated to the vertical stress times a scalar of 0.9, a value which is characteristic of sedimentary basins (Breckels and van Eekelen, 1982). A uniform displacement in the x-direction (N1208 in Fig. 8) is prescribed over the boundaries to induce the buckling of the strip, considered as a simple model of our field folds. For that purpose, a sinusoidal imperfection with long wavelength and an amplitude of 10 cm is introduced in the initial strip geometry. During loading, the overburden and the sub-stratum induce a pressure at the strip contact which is always directed along the interface normal, with a magnitude proportional to the current depth of burial.
Four sets of fractures are assumed to prevail and are denoted A – D on the stereogram of Fig. 8. Sets A and B correspond to sets I and II described in the previous section. To respect the boundary conditions and the symmetries, set C is composed of two orientations defining vertical planes symmetric with respect to the xz plane. The first is oriented at N0708, as set III in the field, whereas the second is along N1708. Set D is also composed of two orientations with a dip angle of plus and minus 308 and a strike of N0308. This fourth set D is reminiscent in orientation of the reverse fault which has been mentioned to intersect set II.
The orientations and the mechanical properties of the four sets are summarized in Table 1. Three data sets are provided for three different simulations proposed to explore various possible chronologies. For each simulation, the fracture sets can be separated into two groups. The first group comprises inherited discontinuities while the second group represents syn-folding discontinuities. The two groups differ by the values of their rheological parameters. A low friction coefficient, cohesion and tensile strength are considered for the inherited sets compared with the syn-folding discontinuities. A similar contrast is given to the work-hardening parameters describing the strength evol-ution during activation. Set A is always considered to be
Table 1
Rheological parameters for the four sets of pervasive discontinuities considered in the simulations (S) with their corresponding sets in the field (F). The three lines for every set correspond to the three simulations reported. c1stands for the work-hardening parameters cS1and cD1(Eqs. (2) and (3)). The Euler anglesuandf, defined inFig. 8, are in degrees. Units for the last three columns are MPa
S set F set u f m cS0 cO0 c1 A I 90 90 0.3 10 0 1 0.3 10 0 1 0.3 10 0 1 B II 90 0 0.6 20 5 5 0.6 20 5 5 0.3 10 0 1 C III 90 ^ 40 0.6 20 5 5 0.3 10 0 1 0.6 50 5 5 D Reverse fault ^ 30 0 0.6 20 5 5 0.6 20 5 5 0.6 50 5 5
inherited. The first simulation assumes the three other sets to be created during folding. For the second simulation, set C is inherited and is given the same characteristics as set A. The third simulation assumes set B to be inherited while the cohesion of sets C and D are increased to 50 MPa. The rheological data set requires also the provision of the elasticity modulus of the host rock E and its Poisson’s ratio set to 5 GPa and 0.2, respectively. Finally, the imposed nominal compressive strain rate is of the order of 10212s21 and the viscosity parameter is equal to 1017Pa s.
3.2.2. Stress trajectories
This discussion on the stress trajectories is facilitated if the geometry of the buckle fold is first presented. The shape of the buckle fold is always qualitatively similar to the one presented inFig. 8and obtained for simulation 3. The fold amplitude, defined as the maximum vertical displacement is found to be approximately 4.4% and 5.8% of the initial structure length, for simulations 1 and 3, respectively. It is thus sensitive to the fracture activation chronology.
The evolution with time of the normal stresssnand of the resolved shear stresst(Eq. (1)) is now analyzed for the four fracture sets. These stresses are computed at the center of the elements, which are identified in Fig. 8with letters X and Y. The first letter X varies from A to I as one moves along the x-direction, the letter I being assigned to the center of the fold. The second letter is indicative of the depth at which the element is located: T, M and B designate top, middle and bottom, respectively. The time evolution of the stresses are represented inFigs. 9 – 11obtained for fracture set B, set C and the first orientation of set D (dipping 308), respectively. Each figure contains three plots labeled a – c corresponding to simulations 1 – 3, respectively. In each plot, the stresses at the beginning and at the end of the simulation are marked by a circle and a square, respectively. The square is not at the end of the simulation but placed on the boundary of the plot if the whole history has been truncated for sake of clarity. The initial elastic domain in the stress space spanned by sn and t is delimited by the truncated Mohr – Coulomb yield criterion which is pre-sented, if possible, by dashed lines. It should be noted that fracture set A is parallel to the x-direction and, conse-quently, the resolved shear stress is initially zero and does not change during folding. However,snincreases toward tensile values in the outer-arc because of Poisson’s effect in the y-direction. This increase is nevertheless insufficient to trigger any opening that would require additional 3D effects disregarded here. It is for these reasons that set A is ignored from the discussion in the rest of this section.
The analysis of the fracture activations starts with set B, perpendicular to the x-direction. Each plot ofFig. 9contains ninet–sncurves corresponding to the stress evolution in the boundary hinge (A), the center of the limb (E) and in the central hinge (I). The stress states at the beginning of the three simulations are identical and are a linear function of the depth, explaining the presence of three circles on the
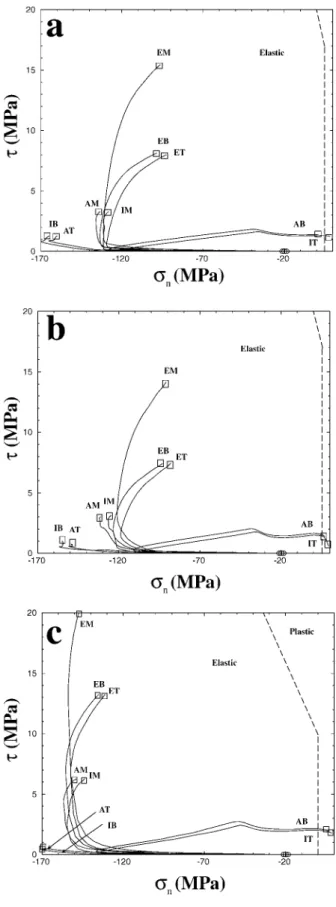
Fig. 9. The time-history of the resolved shear stresstand the normal stress snfor fracture set B, at different locations in the fold identified by two letters. The first letter varies from A to I along the x-direction (seeFig. 8) and the second marks the depth (top, middle or bottom). The three simulations are presented in (a), (b) and (c). The circles and the squares denote the initial and final stress states, respectively. The dashed segments mark the boundary of the initial elastic domain.
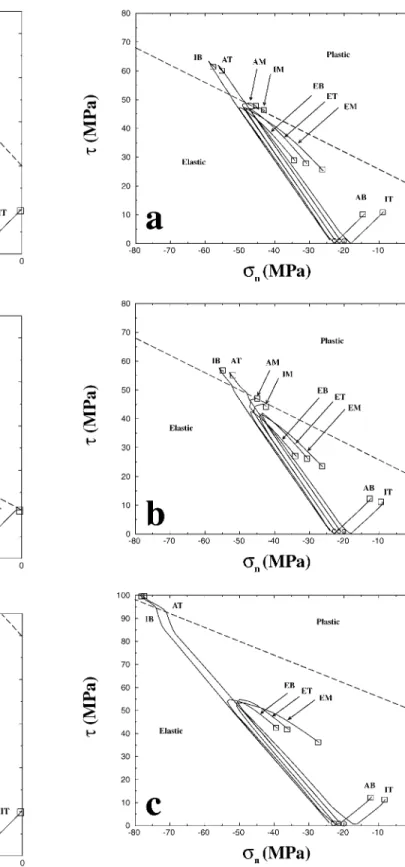
Fig. 11. The time-history of the resolved shear stresstand the normal stress snfor fracture set D dipping 2 308, at different locations in the fold. The three simulations are presented in (a), (b) and (c). The circles and the squares denote the initial and final stress states, respectively. The dashed segments mark the boundary of the initial elastic domain.
Fig. 10. The time-history of the resolved shear stresstand the normal stress snfor fracture set C striking to N0708, at different locations in the fold. The three simulations are presented in (a), (b) and (c). The circles and the squares denote the initial and final stress states, respectively. The dashed segments mark the boundary of the initial elastic domain.
horizontal axis. The initialtis zero because the principal stresses are either normal or coplanar to this set. The stress evolution with time is characterized by two stages for the three simulations. First, the compression of the bed prior to buckling results in an increase of the compressive normal stress with little variation of the resolved shear stress, due to the presence of the small geometrical imperfection. Second, the onset of buckling is marked by an increase of the compressive normal stress in the inner-arc (AT and IB) and a drastic decrease in the outer-arc (AB and IT). The magnitude of the compressive normal stress reaches values of the order of 170 MPa, signaling the potential activation of compaction deformation mechanisms, which are not accounted for here. The stress evolution in the outer-arc leads to an activation in an opening mode of set B, as signaled by the crossing of the vertical dashed lines (tensile strength of 5 MPa in a and b, and 0 MPa in c). The delay in the activation at location AB compared with IT is due to the slight difference in initial lithostatic pressure. At middle depth, elements AM and IM, the normal stress remains approximately constant during folding and no activation is detected. The stress evolution just described in the hinge is different from the one found in the limb center which is now discussed. Elements ET, EM and EB exhibit a drastic increase in resolved shear stress during folding due to limb rotation. The increase is maximum at middle depth because of the absence of friction on top and bottom surfaces. The maximum resolved shear stress is, however, of the order of 20 MPa and is not sufficient to activate set B in a sliding mode. As a final comment onFig. 9, the reader must have noticed that the stress trajectories (except at locations E) have a discontinuity in their slope. For example, consider the point of coordinate (2 35.; 2.) of curve AB in plot a. This discontinuity is due to the activation of other sets of fractures, as it is discussed in what follows.
The evolution with time of the stresses for set C is found inFig. 10. This evolution is similar for the two conjugate orientations and only set III (N0708 inFig. 8) is presented here. The initial resolved shear stress is zero at every depth because the two initial horizontal principal stresses are identical. The most significant evolutions are found in elements EB, IB and IT, which are shown in the three plots ofFig. 10. As for set B, one differentiates between before and after the onset of buckling for the three simulations. The compressive force prior to buckling results in an approxi-mately linear increase in the magnitude of the normal and the resolved shear stresses. Beyond the onset, this trend is continued in the inner-arc (IB), while the stress path is reversed, first in the outer-arc (IT) and second in the limb (EB). The evolution at IT is further commented by noting the second increase in resolved shear stress, which occurs once the neighborhood of the initial stress has been reached. This second increase should be interpreted as the end of the unloading from a compression regime for that set and the beginning of an extension. The major difference between the three simulations is that set C is inherited for the second
simulation,Fig. 10b, which is now commented on. During the compressive stage prior to buckling, set C is activated in sliding: thet–sncurve follows the boundary of the elastic domain marked by the dashed line. During the stress reversal triggered by buckling, this set is deactivated, first at IT, second at EB and then at IB. Finally, note that this set is close to being activated at IT in opening and sliding modes, at the final stage of simulation 2.
The stress histories for the first orientation of set D (reverse fault with a dip angle of 2 308) are presented inFig. 11at the same localities as for set B inFig. 9. The general evolution follows the same trend as for set C in Fig. 10. There is first a nearly linear increase in stress prior to the buckling onset and, second, an unloading in the outer-arc with continuous loading in the inner-arc during buckling. For example, elements IB and AT sustain a continuous loading leading to the activation of the fracture set D in a sliding mode. This activation occurs concurrently to buckling for simulations 2 and 3 and prior to buckling for simulation 1. At mid-depth within the hinges, the onset of buckling leads to the activation in sliding of the fracture set during simulations 1 (for AM and IM) and 2 (for AM only) but not during simulation 3. In the limb, the reduction in stress is both due to the finite rotation and the decrease in load-bearing capacity during buckling (Guiton, 2001). Note that the stress histories on the second orientation of set D has not been presented here. They are identical in the hinges and differ only quantitatively in the limb because of finite rotation.
A general comment is now needed to explain the position of the square that marks the stress states at the end of the simulations, with respect to the initial yield criterion.Figs. 9c and 11awill support that discussion. The distance in the
t–snspace of the square to the initial yield surface is of the order of 5 MPa and would result only from a positive work-hardening (constants cO1 and cS1in Eqs. (2) and (3)) if a rate-independent plastic model had been considered. In the presence of viscosity, this distance depends also on the local deformation rate. It turns out that the local strain rate during buckling is 50 times larger than the nominal strain rate set to 10212and the macro irreversible strain is only of the order of 1%. The distance to the yield surface is due for 95% to viscosity. The stored elastic energy thus determines the rate at which the fold develops and not the boundary conditions. This finding shows a further complexity in defining a rheological model for fractured rocks since the deformation rate could change by several orders of magnitude during the structural evolution.
3.2.3. The chronology of fracture activation
We are now in a position to discuss the chronology of the fracture activation in the field from the results of the three simulations. In summary, simulations 1 and 3 have in common that set D is first activated in sliding prior to the opening of set B in the outer-arc. The difference between these two simulations is that buckling is initiated prior to the
activation of any fracture set in simulation 3 (elastic buckling), whereas fracture activation precedes folding in simulation 1 (elasto-plastic buckling). During simulation 2, the bed parallel shortening makes use of the inherited set C and buckling is also elasto-plastic. This buckling leads to the deactivation of set C in the outer-arc, the activation of set D in sliding in the inner-arc, followed by the opening of set B in the outer-arc.
The fact that set I has been activated in opening prior to the folding in the field is confirmed by the numerical modeling. Similarly, sliding on set I cannot be associated with the buckling, confirming the importance of the final shear event proposed during the field interpretation.
Set II is supposed in the field to have been activated in opening at an early stage of folding. The three simulations confirm this opening within the outer-arc but at a rather late stage of the fold development. Cortes (2000)explains the early activation of this set by the presence of stylolites in the same orientation that were formed during the quasi-homogeneous compression stage preceding folding. The activation of a compaction mechanism leading to these stylolites in the third Rich sandstone requires large compressive normal stress consistent with the 100 MPa found here prior to buckling (Fig. 9). However, the early opening of set II would require a small buckling load to minimize the pre-folding compressive event. There is thus a contradiction between the genesis of set II along stylolites and the early opening of set II, with the present simple buckling model of the field case.
Set III is found numerically to be only activated prior to buckling in a sliding mode, if assumed inherited. However, this activation takes place over the whole domain and not at specific places, as found in the field. Furthermore, during folding, set III is deactivated except in inner-arc in all simulations. The activation of this set must thus be controlled by the late shear event.
The reverse fault in the field has been represented by set D. The discrete nature of this discontinuity does not respect the assumption of diffuse fractures. This point should however not stop us from discussing the first activation of the reverse fault. It is found numerically that this fault could be activated first in the inner-arc at an early stage of folding and, second, in the core of the hinge. In the limb, unloading during the final stage of the simulations prevents the activation of this fault to occur. It thus seems necessary to invoke another mechanism to explain the presence of the reverse fault in the limb of the field anticline. One could envision, for example, a localized shear failure in the final stage of folding.
4. Conclusion
On the basis of field observations in the Tata and Akka area (western Anti-Atlas), the chronology of the folding and fractures development in the Emsian sandstone is partitioned in five stages. The first stage is the compression of a
sedimentary plate at shallow depth, with the formation of set I systematic joints striking parallel to the direction of compression. As loading proceeds, folding of the rock beds is initiated, requiring the opening of axial joints defining set II, in the outer-arc of the competent sandstone beds. In the third stage, a minor collapse occurs in the anticline, which is accommodated by the coalescence of set II fractures in normal faults. Folding stopped in the fourth stage, as can be judged from the multiple shortening features including reverse faults and manifestations of fluid circulation. Further accommo-dation of the tectonic forces resulted, in the fifth stage, in shear deformation based on the strike-slip reactivation of set I synchronously with the formation of set III.
Several points in this interpretation remain open to question. The chronology of sets I and II could be modified from a better insight into the tectonics stages preceding the onset and the development of the fold. Set III could also be partly seen as predating folding and to have been only reactivated in conjugate shear with set I. Stages 4 and 5 are difficult to differentiate in time in the absence of any field evidence to assess the time evolution of the stress trajectories in the fold.
It is believed that a mechanical approach can contribute to constrain such trajectories and to elucidate some of the above controversies. As a first attempt, the elasto-plastic model of Leroy and Sassi (2000)helps in understanding stage 2, the beginning of stage 3 and, indirectly, stage 5 of the fold chronology. Three of the four fracture orientations considered in the simulations coincide with the orientation of sets I– III in the field. The fourth orientation is proposed to analyze the activation of the reverse fault also seen in the field. The main conclusions of the numerical simulations are as follows. Set I is not activated during folding, confirming that it must have been previously generated. Set II is activated during folding but at a later stage than expected from the field observations. This difference could be alleviated by considering a much thinner plate to reduce the critical buckling load and thus to minimize the compressive stress prior to buckling. Set III, if assumed inherited, is activated in sliding over the whole structure during the early compression but deactivated during folding. If not inherited, folding will not promote the formation of this set, except in the inner-arc. The importance of the final regional shear event for the activation of set III, as interpreted from the field observations, is thus confirmed. The reverse fault could be activated in the inner-arc but not in the limb where it was observed in the field as a single fault. It is suggested that the reverse fault is the tip of a ramp discontinuity propagating from an inner-arc region. This interpretation is consistent with the observations of ramps in the same region byCortes (2000). The formation of such a major discontinuity implies strain localization, which mod-ifies the overall fold kinematics and is not accounted for here. The numerical modeling has been shown to constrain the chronology of fracture activation inferred from the field observations. Despite the simplicity of our rheological model, the predicted fracture activation could already be
linked to the geo-statistical approach described inGauthier et al. (2000). This link is hoped to help in the short term both structural geologists and petroleum engineers to improve their construction of fracture network models at the scale of hydrocarbon fields.
Acknowledgements
Part of the fracture data were gathered by J. Letouzey, J.M. Gaulier, J.M. Mengus, J.L. Faure, J.C. Lecomte and M.C. Cacas (IFP) in 1995. J.P. Petit and T. Rives (University of Montpellier and TotalFinaElf) participated in this field study in 1995 and A. Toublanc (TotalFinaElf) in 1998. F. Roure (IFP) is thanked for his critical reading of the manuscript. G. Couples and S. Stewart’s constructive reviews were instrumental in preparing the final version of this paper.
References
Belfield, W.C., 1992. Simulation of subseismic faults using fractal and multifractal geometry. SPE 24751, 903 – 911.
Bourne, S.J., Brauckmann, F., Rijkels, L., Stephenson, B.J., Weber, A., Willemse, E.J.M., 2000. Predictive modelling of naturally fractured reservoirs using geomechanics and flow simulation. SPE ADIPEC 0911.
Breckels, I.M., van Eekelen, H.A.M., 1982. Relationship between horizontal stress and depth in sedimentary basins. Journal of Petroleum Technology 34, 2191 – 2199.
Broek, D., 1987. Elementary Engineering Fracture Mechanics, Martinus Nijhoff, Dordrecht.
Choubert, G., Destombes, J., Faure-Muret, A., Hollard, H., 1981. Carte Ge´ologique du flanc Sud de l’Anti-Atlas occidental et des plaines du Dra au 1/200 000 (feuilles Akka et Tafagount). Notes et me´moires du service ge´ologique du Maroc 163.
Cortes, P., 2000. Me´canismes et caracte´risation de la fracturation de mode 1 dans les roches stratifie´es: terrains et expe´rimentation. Doctoral thesis, University of Montpellier II, France.
Emran, A., Chorowicz, J., 1992. La tectonique polyphase´e dans la boutonnie´re pre´cambrienne de Bou Azzer (Anti-Atlas central, Maroc): apports de l’imagerie spatiale Landsat-MSS et de l’analyse structurale de terrain. Sciences Ge´ologiques Bulletin 45, 121 – 134. Engelder, T., 1987. Joints and shear fractures in rock. In: Atkinson, B.K.,
(Ed.), Fractures Mechanics of Rock, Academic Press, London, pp. 27 – 65.
Gauthier, B.D.M., Zellou, A.M., Toublanc, A., Garcia, M., Daniel, J.M., 2000. Integrated fractured reservoir characterization: a case study in a North Africa field. SPE 65118.
Guiton, M., 2001. Contribution to the deformation of diffuse fracture during folding of sedimentary rocks. Doctoral thesis, Ecole polytechnique, France.
Hancock, P., 1985. Brittle microtectonics: principles and practice. Journal of Structural Geology 7, 437 – 457.
Hassenforder, B., 1987. La tectonique panafricaine et varisque de l’Anti-Atlas dans le massif du Kerdous (Maroc). Doctoral thesis, University Louis Pasteur of Strasbourg, France.
Hegelson, D.E., Aydin, A., 1991. Characteristics of joints propagation across layers interfaces in sedimentary rocks. Journal of Structural Geology 13, 897 – 911.
Hollard, H., 1981. Principaux caracte`res des formations de´voniennes de
l’Anti-Atlas. Notes et Me´moires du service ge´ologiques du Maroc 42, 308, pp. 15 – 22.
Ladeira, F.L., Price, N.J., 1981. Relationship between fracture spacing and bed thickness. Journal of Structural Geology 3, 179 – 183.
Leroy, Y.M., Ortiz, M., 1990. Finite element analysis of transient strain localization phenomena in frictional solids. International Journal for Numerical and Analytical Methods in Geomechanics 14, 93 – 124. Leroy, Y.M., Sassi, W., 2000. A plasticity model for discontinua. In:
Lehner, F.K., Urai, J.L. (Eds.), Aspect of Tectonic Faulting, Springer-Verlag, Berlin, pp. 77 – 108.
Lewis, H., Couples, G.D., 1993. Production evidence for geological heterogeneities in the Anschutz Ranch East Field, western USA. In: North, C.P., Prosser, D.J. (Eds.), Characterization of Fluvial and Aeolian Reservoirs. Geological Society Special Publication 73, pp. 321 – 338.
Lisle, R.J., 1994. Detection of zones of abnormal strains in structures using Gaussian curvature analysis. American Association of Petroleum Geologists Bulletin 78, 1811 – 1819.
Lorenz, J.C., Teufel, L.W., Warpinski, N.R., 1991. Regional fractures I: a mechanism for the formation of regional fractures at depth in flat-lying reservoirs. American Association of Petroleum Geologists Bulletin 75, 1714 – 1737.
Mandl, G., 1988. Mechanics of Tectonic Faulting, Elsevier, New York. Mercier, E., Outtani, F., Frizon de Lamotte, D., 1997. The late evolution of
fault-propagation folds: principles and example. Journal of Structural Geology 19, 1107 – 1109.
Narr, W., Suppe, J., 1991. Joint spacing in sedimentary rocks. Journal of Structural Geology 13, 1037 – 1048.
Nelson, R.A., 1985. Geologic Analysis of Naturally Fractured Reservoirs, Gulf, Houston.
Nieuwland, D.A., Walters, J.V., 1993. Geomechanics of the South Furious field. An integrated approach towards solving complex structural geological problems, including analogue and finite-element modelling. Tectonophysics 226, 143 – 166.
Petit, J.P., Auzias, V., Rawnsley, K., Rives, T., 2000. Development of joint sets in association with faults. In: Lehner, F.K., Urai, J.L. (Eds.), Aspect of Tectonic Faulting, Springer-Verlag, Berlin, pp. 167 – 184. Pique´, A., 2001. Geology of Northwest Africa, Gebru¨der Borntraeger,
Berlin.
Pique´, A., O’Brien, S., King, A.F., Schenk, P.E., Skehan, J.W., Hon, R., et al., 1990. La marge nord-occidentale du Pale´o-gondwana (Maroc occidental et zones orientales des Appalaches); rifting au Pre´cambrien terminal et au Pale´ozoı¨que infe´rieur, et compression hercynienne.le´-ghanienne au Pale´ozoı¨que supe´rieur. Compte Rendu de l’Acade´mie des Sciences de Paris 310 (II), 411 – 416.
Pollard, D.D., Aydin, A., 1988. Progress in understanding jointing over the past century. Geological Society of America Bulletin 100, 1181 – 1204. Pollard, D.D., Segall, P., 1987. Theoretical displacements and stresses near fractures in rock: with applications to faults, joints, veins, dikes, and solution surfaces. In: Atkinson, B.K., (Ed.), Fractures Mechanics of Rock, Academic Press, London, pp. 277 – 349.
Price, N.J., 1966. Fault and Joint Development in Brittle and Semi-brittle Rock, Pergamon, Oxford.
Sassi, W., Faure, J.L., 1997. Role of faults and layer interfaces on the spatial variation of stress regimes in basins: inferences from numerical modelling. Tectonophysics 166, 101 – 119.
Stearns, D.W., 1964. Macrofracture patterns on Teton Anticline NW Montana. Transaction of the American Geophysical Union 45, 107 – 108.
Stearns, D.W., Friedman, M., 1972. Reservoir in fractured rocks. In: King, R.E. (Ed.), Stratigraphic Oil and Gas Fields—Classification, Explora-tion Methods, and Case Histories. American AssociaExplora-tion of Petroleum Geologists Memoir 16, pp. 82 – 106.
Suppe, J., 1985. Principles of Structural Geology, Prentice Hall, New Jersey.