HAL Id: hal-02415464
https://hal-mines-albi.archives-ouvertes.fr/hal-02415464
Submitted on 5 Feb 2020
HAL is a multi-disciplinary open access
archive for the deposit and dissemination of
sci-entific research documents, whether they are
pub-lished or not. The documents may come from
teaching and research institutions in France or
abroad, or from public or private research centers.
L’archive ouverte pluridisciplinaire HAL, est
destinée au dépôt et à la diffusion de documents
scientifiques de niveau recherche, publiés ou non,
émanant des établissements d’enseignement et de
recherche français ou étrangers, des laboratoires
publics ou privés.
Physics of Organization Dynamics: An AI Framework
for opportunity and risk management
Frederick Benaben, Matthieu Lauras, Benoit Montreuil, Louis Faugère,
Juanqiong Gou, Wenxin Mu
To cite this version:
Frederick Benaben, Matthieu Lauras, Benoit Montreuil, Louis Faugère, Juanqiong Gou, et al.. Physics
of Organization Dynamics: An AI Framework for opportunity and risk management. IESM 19 - 8th
International Conference on Industrial Engineering and Systems Management, Sep 2019, Shangai,
China. p.396-401, �10.1109/IESM45758.2019.8948167�. �hal-02415464�
Physics of Organization Dynamics: An AI
Framework for opportunity and risk management
Frederick Benaben, Matthieu Lauras
Centre Génie Industriel IMT Mines Albi Albi, FRANCE {first.last}@mines-albi.fr
Benoit Montreuil, Louis Faugère
Physical Internet Center, ISyE Georgia Tech Atlanta, USA {first.last}isye.gatech.edu
Juanqiong GOU, Wenxin Mu
School of Economy & Management Beijing Jiaotong University
Beijing, China {jqgou / wxmu}@bjtu.edu.cn
Abstract—The identification of risks and opportunities is
generally massively depending on the ability of managers and decision makers to analyze multi-dimensional situations, to mobilize their experience and to infer risks and opportunities. However, in the Big Data era, early warning systems have shown that data science could be an efficient way to automatize risk detection. In this article, a new and original vision of risks and opportunities management is introduced and discussed in the context of a simple example. The main expected benefit is to enable decision makers to manage the trajectory of a considered system with regards to its performance towards its associated objectives, and to also support the definition of these performance objectives. The system could be an enterprise in an economic context but mainly any social system trying to avoid or manage instability, disruptions or crises.
Keywords—risk management, risks, opportunity, knowledge
management, artificial intelligence, physics, force fields
I. INTRODUCTION
The initial and basic statement that leads this research work is the following: instability is the norm [1], [2], [3]. It is no longer question to try to maintain any social or economic system in a stable situation. The main objective of management is to surf on instability and progress in a continuous instable state. A lot of authors use the following metaphor: “walking or running is a continuous unbalanced state”. In any case, considering this initial statement, the paradox is that even if instability is such a major contextual element for socio-economic systems, the data, information and knowledge management tools to support decision makers are generally dashboards mainly dedicated to visualization (except for simulation tools). These are very fascinating contributions and great tools but it is also only a way to prepare, as much as possible, the available informational and cognitive content for processing by a human brain. The complementary treatment to concretely advise the decision makers with deeper insights and tangible analysis is still quite in its infancy.
The vision chosen for this article is based on the following: • Considering data about a situation to identify risks
and opportunities in order to support decision-making is close to what Artificial Intelligence should be. • An interesting analogy is to consider risks and
opportunities as physical forces applied onto the
observed socio-economic system. Risks and opportunity are then “pushing” or “pulling” a system in the referential of its performances.
Roughly speaking, the principle of the research work presented in this article is to collect data about a system and its context to identify potential forces that could impact it (risks and opportunities) and to visualize the potential trajectories of the observed system in the referential of its performances.
This approach could be relevant in a lot of contexts (from crisis management to supply-chain management, from strategy to operations). So, the main objective of this article is to clarify the vision of a formalized and structured way to use contextual data for the purpose of risk and opportunity detection in support of decision. This objective, in line with [4], aims at answering two main questions: (i) what does “use of data” mean exactly? And (ii) how can data be formally used for risk and opportunity detection?
This article is structured as follows: First, and based on an overview of the related work, the AI framework is introduced (thus answering the first of the two previous questions). Second, the risk and opportunity management framework is presented (answering the second question). Then, a simple and fictional example is described to illustrate the contributions of the article. Finally, the next steps are listed in the conclusion.
II. AN AIFRAMEWORK FOR DATA MANAGEMENT
A. Data, information, decision and knowledge framework The distinction between data, information and knowledge has been hardly discussed in the last decades. One of the first definitions relevant for this article can be found in [5]: “Data are symbols that represent properties of objects, events and their environments. They are products of observation”, “information is referred from data, it is contained in descriptions, answers to questions that begin with such words as who, what, where, when and how many” and, “Knowledge is conveyed by instructions, answers to how-to questions”.
More recently, [6] provides the following definitions: “Data consists of discrete, objective facts about events but nothing about its own importance or relevance; it is raw material for creating information” while “Information is data that is organized to make it useful for end users who perform tasks and make decisions” and “Knowledge is broader than
data and information and requires understanding of information (information about information, such as who has created the information).”
In addition, the notion of common operational picture, defined in [7] and inherited from the domain of command and control requires the contextualization of data to obtain information [8]. The obtained information, stored as models, is analyzed, updated and monitored to support decision.
Concretely, there are four concepts that should be considered to structure the data exploitation: data, information, decision and knowledge. On the basis of the previous elements, the following definitions are used:
• Data: formalized observation of the world.
• Information: result of the interpretation of data through the instantiation of conceptual references.
• Decision: result of the exploitation of information through dedicated processing mechanisms.
• Knowledge: capitalized static information about previous experience or extracted abstract concepts.
For instance, let’s consider the following example of data: “wild fire”, “city”, and “wind”. This dataset can be interpreted through sense making mechanisms to create the following information: “there is a wild fire close to a city where there is wind”, which may provide the following information “there is a threat on the city” which is a risk, or at least a potentiality. Analyzing and processing this information may support the decision of “triggering the evacuation of the city”. This decision is also based on knowledge such as the concept of what is a “risk” (or a “potentiality”) and stored instances about the fact that “the wind is a strong factor for the fire to spread”.
One strong hypothesis concerns data and the fact that all the questions of data source discovery, understanding, trust and cleaning are out of the scope of the current article. The hypothesis is the following “let’s assume that there are available data that are meaningful, trustable and usable”.
The following figure (Fig. 1.) presents the K-DID (Knowledge / Data / Information / Decision) Framework, which is somehow based on the DIKW (Data / Information / Knowledge / Wisdom) pyramid presented in [9].
Fig. 1. The K-DID framework presenting the abstraction levels data, information, decision and knowledge
B. AI combining Data Science and Industrial Engineering Both Data Science and Industrial Engineering aims at supporting the decision-making process. Both aims at providing organizations with approaches and tools to manage efficiently their activities, with regards to internal and external events. To reach that objective, Data Science is mainly based
on Data Analytics [10] to work on dashboard, while Industrial Engineering basically focuses on Enterprise Modeling [11] to reason on situations.
As for Data Science, [12] describes two main parts: Data Management and Data Analytics. Data Management includes Acquisition, Content Extraction and Data Integration and Representation. Data Analytics includes Analysis and Human-Interpretation. It is easy to draw the line between this vision of Data Science and the K-DID framework on Figure 1. Data Management fills in the data layer while Data Analytics aims at providing the user with visualization that may be interpreted by him. Actually, the Analysis stage of Data Analytics is dedicated to performing detection of frequent patterns and correlations to obtain general statistics, which is basically what is expected at the decision layer of Figure 1.
As for Industrial Engineering, two main parts may be identified as well: Enterprise Modeling and Model Driven Engineering. From [13] Enterprise Modeling can be considered as mainly using expert modelers to create (based on dedicated approaches and associated metamodels, know-how and knowledge basis) models that can then be exploited for decision support. It also provides a support for knowledge management. Model Driven Engineering as studied in [14] and described more precisely in the context of industrial engineering (and not software engineering) in [15] considers that models might be used throughout all engineering disciplines and in any application domain, through model transformation, metamodel conformance, etc.
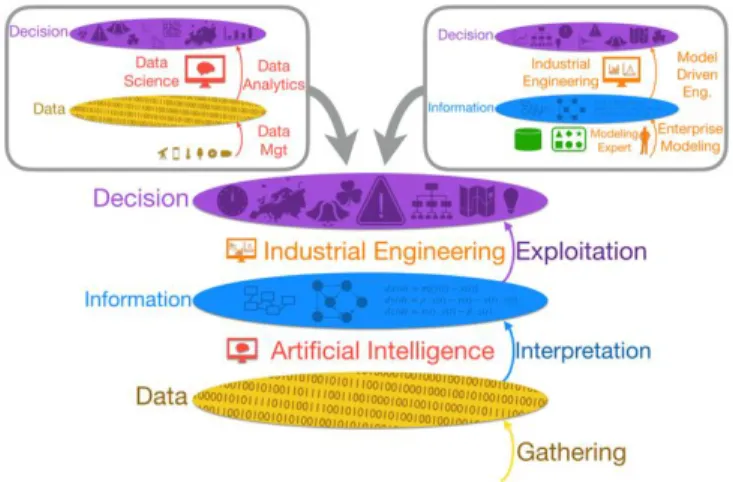
Consequently, the following picture illustrates how Data Science and Industrial Engineering can be located on the K-DID framework. The upper left part of Fig. 2. concerns Data Science (Data Analytics and Data Management), the upper right part concerns Industrial Engineering (Enterprise Modeling and Model Driven Engineering).
Fig. 2. The location of Data Science (upper left) and Industrial Engineering (upper right) on the K-DID framework
There are plenty of definitions of intelligence. Most of them include several features: (i) understanding, (ii) deciding or acting, (iii) adaptation to circumstances and objectives, (iv) based on knowledge, (v) abstract and formal. In the context of this article, and based on the previous element, we will consider the following definition of intelligence: The capacity to use one’s senses to understand any given situation and enact accordingly to reach one’s objectives. This definition includes all the features previously mentioned and could be used to define Data Science and Industrial Engineering according to the bottom part of Figure 2:
• Data science: Use one’s senses to enact to reach one’s objectives (missing the situation understanding part).
• Industrial Engineering: Analyze any given situation to enact accordingly to reach one’s objectives (missing the sense-based collection part).
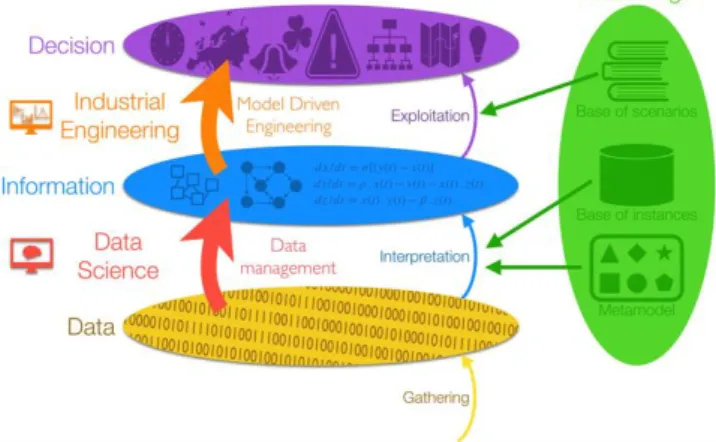
Both these visions show how partially Data Science and Industrial Engineering contribute to provide artificial intelligence for decision support. As a consequence, and in continuity with previous work [16] the ambition is to use Data Analytics to build situation models and to use Model Driven Engineering to use the obtained models for decision support. The following Figure 3 illustrates this AI framework mixing Data Science and Industrial Engineering:
Fig. 3. The Artificial Intelligence framework, based on the K-DID one
III. RISK AND OPPORTUNITY MANAGEMENT FRAMEWORK
A. General “field forces” inspired philosophy
This article claims that risks and opportunities are the same concepts. As discussed in [17], Opportunity is the opposite of Risk but current practices mainly focus on risk detection. Furthermore, it is obvious that what could be considered as a risk from one point of view might be an opportunity from another perspective. Consequently, risks and opportunities can be considered as potentialities: changes in the situation that may happen and impact the performances of the system.
According to [18], risk can be considered as the combination of the probability of occurrence and the impact of hazard. This vision can also be extended to opportunity as presented on Figure 4:
Fig. 4. Classical two-dimension representation of Risk and Opportunity
This is a very classical two dimensions representation of risk (probability VS. impact) but it also introduces two interesting concepts: occurrence and hazard. Besides, [19]
presents risk three components based: (i) a driver or danger which induct the risk; (ii) an event with probability of occurrence of the risk; and (iii) a consequence resulted from the occurrence of the risk on susceptible assets. Finally, [20] and [21] present the description of a causal chain based on a Danger / Risk / Consequence chain (DRC chain). This DRC chain can be extended to include favorable condition (as a positive danger) to describe opportunity (as a positive Risk). The event can be a punctual event (e.g. it is starting to rain) but it can also be a verified condition (There are people in the building). Figure 5 presents this causal chain and the propagation loops. The red/green elements of figure 5 illustrate the mechanism from the negative perspective (red elements for danger, risk and damage) and the positive perspective (green elements for favorable condition, opportunity, benefit). This chain is strongly inspired from the impact of force fields to susceptible systems. Yellow elements of Figure 5 introduce this analogy:
Fig. 5. Mechanical forces inspired causal chain for risk and opportunity, with cascading effect retroactive loop
Based on this framework inspired from mechanical forces, if we can use data flows to identify, on the one hand, the characteristics of the environment, and, on the other hand, to define the susceptibility to these characteristics of the systems immersed in this environment, then we might be able to determine the forces exerted on the systems.
B. The two modeling frameworks of the approaches
Following the previous ideas, the generic modeling vision proposed the “Physics of Organization Dynamics” approach as based on two modeling spaces: the first one is dedicated to
characterizing organizations and their context: this is the
“susceptibility framework”. The main idea of this modeling space is to locate organizations of the studied system with regards to dimensions that are representative of their precise nature. It can be geographical dimensions (latitude, longitude, altitude), type dimensions (domain, sectors, size), dependency dimensions (nature of inputs, type of energy), status (legal status, social status), image, etc. This set of dimensions is not closed and can be open to any characterization dimension relevant to any context. The main benefit of this first modeling space (the susceptibility framework) is that any specific characteristic of the context (dangers, favorable conditions and more generally impactful characteristic) can be model as a Boolean value in the susceptibility framework. It actually means that for each point in space, the considered characteristics impacts (1) or not (0) the organizations located in that point. Let’s take two examples: the seismic danger of Japan (characteristic) would only impact directly
organizations of any kind (stake) with geographical coordinates in Japan. Similarly, a French project of tax reduction for companies of less than 200 employees based on the number of handicapped employees would only impact directly SMEs located in France. Obviously, the number of representative dimensions depends on the use-case but Figure 6 illustrates that susceptibility framework in a simple case.
Fig. 6. The susceptibility framework
It is important to notice that characteristics could be represented with a more sophisticated function than Boolean (e.g. distribution between 0 and 1 depending on the strength of the impact, or even between -1 and 1). However, at this stage of the research work, a Boolean function is significant enough for the experiment and the demonstration.
The second modeling space is dedicated to observing the actual impact of characteristics on organizations as (potential/actual) movements due to (potential/actual) forces: this is the “performance framework”. Basically, the main role of this framework is to locate organizations with regards to their KPIs and to represent, as forces, the impact of characteristics, on the organizations, with regards to these KPIs. This is the modeling space where the location (in terms of performance) and the trajectory (in terms of evolution and progress) of organizations can be modeled and studied. Figure 7 illustrates that performance framework.
Fig. 7. The performance framework
Regarding the AI framework of Fig. 3., the susceptibility framework is the support for the information layer, while the performance framework is the support for the decision layer.
IV. ILLUSTRATION WITH A SIMPLE USE-CASE
Nota Bene: The following example is fictional and is not meant to be realistic. This simple use-case is dedicated to illustrating the previous sections.
Let us consider the following example of a thermal power plant in a territory where it provides electricity to a
neighborhood, a midtown and a hospital. Besides producing electricity, the thermal plant also plays a role of dispatcher by storing electricity and buying electricity from two other providers: a nuclear plant and a hydroelectric dam. Figure 8 illustrate this structure:
Fig. 8. The organizational structure of the fictional use-case
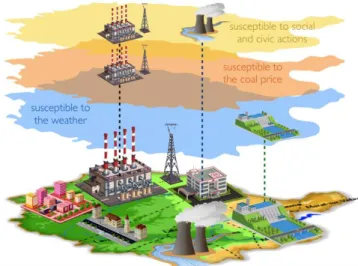
Basically, the component of the observed system may be susceptible to some characteristic of their environment. For instance, some weather event (e.g. a drought) may affect the components, which are in the weather event area, and susceptible to this kind of characteristic: the hydroelectric dam may reduce considerably its electricity production in case of drought. The cost of the coal may impact the components that use coal: the thermal power station may be financially impacted by the variation of the price of coal. Due to the green consciousness, the nuclear plant and the thermal power station may be impacted by some social and civic actions that could disturb their activities and reduce their production.
This principle of susceptibility of components to some characteristics of the environment, depending on their geo-location, on their nature, on their inputs/outputs is one of the main elements of the approach presented in this article. Fig.9. illustrates this principle in the case of the considered scenario on the associated susceptibility framework.
Fig. 9. The susceptibility framework of components of the considered systems and characteristics of the environment
The main interest of this question of susceptibility is to be able to define the way these characteristics may impact each component with regards to its own performance. Let’s consider that one component can be located in the referential
of its key performance indicators (KPI), then the question is how the considered characteristic (to whom the component is susceptible) will change that location. The proposed vision for this question is to consider that the characteristic might impact the component according to a relative term and an absolute term: the relative term depends on the current location of the component (e.g. 50% of the buildings of the component will be impacted, in the case of a KPI on the number of buildings) while the absolute term does not depend on that location (e.g. the first line of buildings of the component will be impacted, in the same case of a KPI on the number of buildings). This idea can be represented with the following elements:
• A component C can be characterized according to N dimensions: C = (c1, c2, … cn) such as longitude,
latitude, type, nature, size, type of inputs, type of outputs, etc.
• A characteristic of the environment is a Boolean function of occupation: Ch (x1, x2, … xn) = 1 if the
characteristic Ch is actually present in the location (x1,
x2, … xn). Else, Ch (x1, x2, … xn) = 0.
• The location of C in these N dimensions determines its susceptibility to characteristics: C is susceptible to all characteristics that have a non-null value at the coordinates of C.
• If C is susceptible to a characteristic Ch, then there is a matrix MCh and a vector VCh that represent
respectively the relative term of the impact of the characteristic Ch on C and the absolute term of the impact of the characteristic Ch on C. Then the force of Ch on C is : Force = MCh.C+VCh.
• MCh is a MxM matrix (impact matrix) and VCh is a
vector (impact vector) of M terms (where M is the number of KPI considered for C). If the M KPIs are independent, then MCh is a diagonal matrix.
• It is interesting to notice that depending on the nature of the considered characteristics, there might be profile of matrix and vectors.
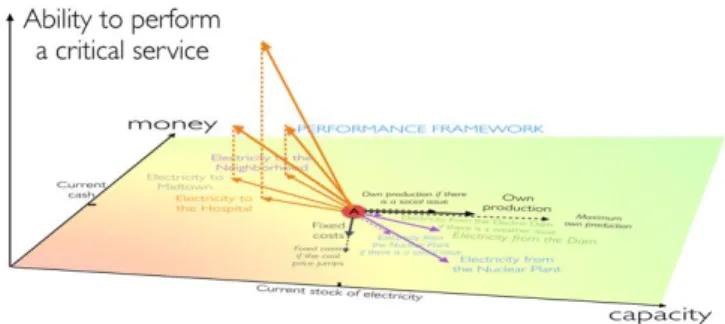
In the simple example observed in that section, if we consider a very simple performance framework, with only two KPIs: cash and capacity, then, according to the susceptibilities identified earlier, the following net of forces can be defined for the Thermal Power Station. Some of these forces are actual forces (solid line) and some are potential forces, i.e. risks or opportunities (dash lines).
Fig. 10. The performance model: a balanced net of forces, according to the identified characteristics of the context.
One can observe that selling electricity increase the indicator of cash but decrease the capacity. Similarly, buying electricity increase the capacity but decrease the amount of cash. In the presented situation, the forces are initially perfectly balanced (as a whole and naturally specifically in terms of cash and capacity).
Fig. 11. The sum of force of the thermal power station in the case of a stable balanced scenario.
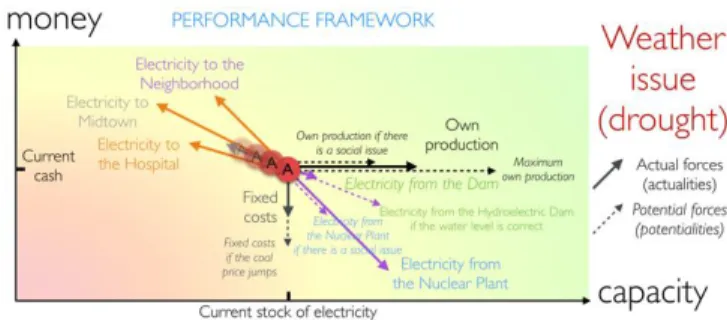
Let’s consider now the case of a weather issue (for instance a drought). Then the force represented with the purple dash line regarding the hydroelectric dam will be changed and the observed system will move (cf. red circles). See Fig. 12.
Fig. 12. The performance model: an unbalanced net of forces in 2D.
In the case of a drought, the dam is not any more able to provide electricity anymore. So, there is a resulting force that pushes the power station left and up. This is quite normal considering that the clients will still continue to buy electricity (unchanged incoming cash) but the power station will buy less electricity (fewer outgoing cash). See Fig. 13.
Fig. 13. The sum of forces in the case of an unstable event.
In this situation, stored electricity is basically just transformed in cash. However, this trajectory cannot be maintained a long time because the stock of electricity is not sustainable. As a consequence, to find a balanced situation again, the power plant should either reduce the volume of electricity delivered to customers or increase the capacity through other means (e.g. increase its own capacity or buy more capacity from other electricity providers). If the choice is to reduce the quantity of electricity delivered to its customers, it probably means that other performance dimensions should be considered to support that choice. Figure 14 illustrates this:
Fig. 14. The use of other dimensions to refine the decision-making process.
Then hopefully not only will the calculation system enable to define the trajectory of a component (in our case the component is the hydroelectric plant) but it may also enable the selection of options to control the trajectory and to reach target areas of the performance framework (i.e. the system’s objectives). Ultimately, this approach should even enable to study which part of the performance framework could be easier to access (i.e. show the system objectives that it didn’t even know could be reached).
V. CONCLUSION
The presented approach aims at using data to understand a given situation (through the design of a susceptibility model) and to exploit that vision of the situation to infer decisions (through the study of the performance model). These models (and the associated modeling frameworks) are based on an artificial intelligence framework, merging Data Sciences (especially data analytics) and Industrial Engineering (especially model-driven engineering). Data science is used mainly to build the susceptibility model and to define the impact matrix and the impact vectors of characteristics onto elements of the studied system. Industrial Engineering is used to contribute to the definition of the impact matrix and vector and also to exploit the obtained susceptibility models to create the performance model. The final results would be to assist the decision-makers in helping organizations reach some target area in the performance framework, or even to define the reachable areas in the performance framework (and how to reach them). At this stage, this idea is supported by the performance model, but the next step is to work on the definition of a third modeling framework: the decision framework to build and handle a decision model.
REFERENCES
[1] N. Taleb, The Black Swan – The Impact of the Highly Improbable. Random House, New York, 2007.
[2] N. Taleb, Antifragile – Things that Gain from Disorder, Random House, New York, 2012.
[3] J. P. Ribeiro, A. Barbosa-Povoa, “Supply Chain Resilience: Definitions and quantitative modelling approaches–A literature review”, Computers & Indus. Engineer., vol. 115, pp. 109-122, 2018.
[4] F. Benaben, A. Montarnal, A. Fertier, S. Truptil, “Big-Data and the question of horizontal and vertical intelligence: a discussion on disaster management”, Working Conference on Virtual Enterprise, Springer, IFIP, Porto, Portugal, 2016.
[5] R. Ackoff, “From Data to Wisdom”, Journal of Applied System Analysis, vol. 16, pp. 3-9, 1989.
[6] I. Rus, M. Lindvall, “Knowledge management in software engineering”, IEEE Software, vol. 19, issue 3, pp. 26-38, 2002.
[7] I. Dickinson, “National resilience extranet common operational picture”, Niteworks report, Ref N°: NW/Pj/ResComms/4902a, 2013.
[8] A. Tolk, “An agent-based Decision Support System Architecture for the Military Domain”, Intelligent Decision Support Systems in Agent-Mediated Environments, vol. 115, pp. 187-205, 2005.
[9] J. Rowley, “The wisdom hierarchy: representations of the DIKW hierarchy”, Journal of Information and Communication Science, vol. 33, issue 2, pp. 163-180, 2007.
[10] A. Gandomi, M. Haider, “Beyond the hype: Big data concepts, methods, and analytics”, International Journal of Information Management, vol. 35, pp. 137-144, 2015.
[11] F. Vernadat, Enterprise modeling and integration, Principles and applications. Chapman & Hall, 1996.
[12] H. Jagadish, J. Gehrke, A. Labrinidis, Y. Papakonstantinou, J. Patel, R. Ramakrishnan C. Shahabi, “Big data and its technical challenges”, Communication of the ACM, vol. 57, issue 7, pp. 86-94, 2014. [13] F. Vernadat, “Enterprise modeling and integration (EMI): current status
and research perspectives”, Annual Reviews in Control, vol. 26, pp. 15-25, 2002.
[14] R. Rodrigez Da Silva, “Model Driven Engineering, a survey supported by the unified conceptual model”, Computer languages, Systems and Structures, vol. 43, pp. 139-155, 2015.
[15] J. Dietz, E. Proper, J. Tribolet, The Enterprise Engineering Series. Springer; 2009-2014.
[16] F. Benaben, J. Li, I. Koura, B. Montreuil, M. Lauras, W. Mu, J. Gou, “A tentative framework for risk and opportunity detection in a collaborative environment based on data interpretation”, Proceedings of 52nd HICSS’19, Hawaii, USA, 2019.
[17] R. Olsson, “In Search of Opportunity Management: Is the Risk Management Process Enough?”, International Journal of Project Management, vol. 25, issue 8, pp. 745-752, 2007.
[18] P. Edwards, P. Bowen, Risk management in project organisations. Elsevier, Oxford, UK, 2005.
[19] B. Zeng, P. Yen, “Rethinking the role of partnerships in global supply chains: a risk-based perspective”, International Journal of Production Economics, vol. 185, pp. 52-62, 2017.
[20] F. Benaben, A.-M. Barthe-Delanoë, M. Lauras, S. Truptil, “Collaborative systems in crisis management: A proposal for a conceptual framework”, Working Conference on Virtual Enterprise, pp. 396-405, Springer, IFIP, Amsterdam, The Netherlands, 2014.
[21] J. Li, F. Benaben, J. Gou, W. Mu, W. “A Proposal for Risk Identification Approach in Collaborative Networks Considering Susceptibility to Danger, Working Conference on Virtual Enterprise, pp. 74-84, Springer, IFIP, Cardiff, UK, 2018.