Science Arts & Métiers (SAM)
is an open access repository that collects the work of Arts et Métiers Institute of Technology researchers and makes it freely available over the web where possible.
This is an author-deposited version published in: https://sam.ensam.eu Handle ID: .http://hdl.handle.net/10985/19535
This document is available under CC BY license
To cite this version :
Marc REBILLAT, Nazih MECHBAL - Principal Least Squares Canonical Correlation Analysis for damage quantification in aeronautic composite structures - In: International Workshop on Structural Health Monitoring 2019, Etats-Unis, 2019-09 - Proceedings of the International Workshop on Structural Health Monitoring 2019 - 2019
Any correspondence concerning this service should be sent to the repository Administrator : [email protected]
Principal Least Squares Canonical Correlation Analysis
for damage quantification in aeronautic composite
structures
Marc REBILLAT, Nazih MECHBAL
Processes and Engineering in Mechanics and Materials Laboratory (PIMM, UMR CNRS 8006, Arts et Métiers ParisTech (ENSAM)), 151, Boulevard de l'Hôpital, Paris, F-75013, France.
ABSTRACT
The Structural Health Monitoring (SHM) process is classically decomposed into four steps: damage detection, localization, classification and quantification. Here the focus is put on aeronautic composite structures and specifically on the damage quantification step. For SHM purpose, such structures are equipped with piezoelectric elements that can be used both as sensors and actuators. To quantify a detected damage, measurements are first performed in a reference state. Then, during the life cycle of the structure several measurements at unknown states are performed. Several damage indexes are then extracted from the difference between the reference and unknown states. This damage indexes matrix is the basis of any algorithms dedicated to the quantification step but still contains many more dimensions that just a quantification of damage size. The question raised here is the efficiency of dimension reduction algorithms in the damage indexes space for quantification purposes. Performances of simple direct regression (SDR), principal component analysis (PCA), partial least squares (PLS), canonical correlation analysis (CCA) and autoencoders (AE) are investigated for this purpose. It is shown that PCA, PLS and CCA are all able to discover a low-dimensional space within the damage indexes space that is linearly related with the physical damage size, and that average prediction errors of the order of ≃ 1% can be achieved by projecting data through that low-dimensional space.
INTRODUCTION
Monitoring in real-time and autonomously the health state of structures is of high interest for the industry, and more specifically for the aeronautic and civil engineering applications fields. Such a process is referred to as Structural Health Monitoring (SHM) [1, 2]. To achieve this goal, these structures become “smart” in the sense that they are equipped with sensors, actuators and artificial intelligence that allow them to state regarding their own health. One can compare such smart structures with the human body which, thanks to its various senses and nerves, can know if it has been hurt and where. The SHM process is classically decomposed into 4 steps: damage detection, damage localization, damage classification and damage quantification.
Here the focus is put on composite structure’s representative of aeronautic materials. To deploy SHM to composite structures, such structures are equipped with piezoelectric elements that can be used both as sensors and actuators. Each element is actuated one by one using a tone burst at high frequency (typically ≃ 100 − 200 kHz), produces an ultrasonic wave that propagates throughout the structure and that is measured by the other piezoelectric elements acting as sensors. Let’s considers a structure equipped with piezoelectric elements and for which acquisition is performed over 𝑆 ≃ 1500 samples. To monitor the possible apparition of damage, measurements
are first performed 𝑛𝑟 times in a reference (or healthy) state to get a reference matrix 𝑹 ∈ ℝnr×𝑆. Then, during the life cycle of the structure measurements at unknown states
are performed 𝑛𝑢 times and provides the matrix 𝑼 ∈ ℝnu×𝑆. A number 𝐹 ≃ 20 of
features (specifically called “damage indexes” in the present context) is then extracted from each pair of signals contained in the matrices 𝑹 and 𝑼 to provide the matrix 𝑭 ∈ ℝL×𝐹 with 𝐹 ≪ 𝑆 and 𝐿 = 𝑛
𝑟 × 𝑛𝑢. This constitutes the damage index space and is a first dimension reduction algorithm as the number of features 𝐹 ≃ 20 is much lower than the initial number of temporal samples 𝑆 = 1500.
This matrix 𝑭 is the basis of any algorithms dedicated to the quantification step of SHM but still contains many more dimensions (namely 𝐹 ≃ 20) that just a quantification of damage size or severity (which is mono-dimensional). The question raised here is of the efficiency of dimension reduction algorithms in the damage indexes space for quantification purposes. Traditionally, Principal Component Analysis (PCA) has been used as a dimension reduction technique to investigate whether the information contained within all the damage indexes can be condensed to a lower dimensional space without losing its quantification abilities [3]. However, as reported in [4], the aim of PCA is to find directions that explained the maximum of variance in the input data. One should here recall that in addition to input data, output data are also available, and the dimension reduction problem can be set up as a supervised dimension reduction problem here. There is thus a lot to learn with respect the dimension reduction directions that may be the more efficient for quantification. In order to achieve this goal, some alternate methods have been proposed such as Partial Least Squares (PLS) and Canonical Correlation Analysis (CCA) [5, 6, 7] that seek for a lower dimensional space optimizing discrimination. Finally, high-dimensional data can also be converted to lower-dimensional spaces also by training a multilayer neural network with a small central layer able to reconstruct high-dimensional input vectors, referred to as autoencoders (AE). AE have been demonstrated as powerful dimension reduction tools [8]. Using one of these approaches in the context of damage size quantification also appears as more appealing than relying on standard PCA.
DIMENSION REDUCTION METHODS FOR QUANTIFICATION
Problem statement
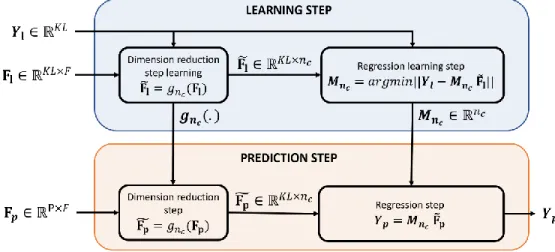
The problem at hand can be defined as follows: 𝐾 matrices {𝑭𝐤∈ ℝ𝐿×𝐹}𝑘∈[1,𝐾] corresponding to damage indexes extracted by comparison of a the repetitions measured in a healthy reference case with the repetitions measured for 𝐾 damaged cases are available (𝐹 denotes the number of extracted damage indexes and 𝐿 the number of times these features are computed given the available repetitions in each state). All these matrices 𝐅𝐤 are grouped to form a matrix 𝐅 ∈ ℝ𝐾𝐿×𝐹 that fosters all the available information. The 𝐾 damaged cases correspond to cases where the damage size 𝑑 takes discrete values {𝑑𝑘}𝑘∈[1,𝐾]. Only one parameter is thus responsible for the variations observed in all these matrices. We can thus wonder if it is it possible to reduce the dimensionality of the damage indexes matrix 𝐅 ∈ ℝ𝐾𝐿×𝐹 to 𝑛
𝑐 ≪ 𝐹 (ideally to one) and to learn a linear regression between this lower dimensional space and the real damage size in order to be able to predict unknown damage sizes. The input space is described by 𝐘 ∈ ℝ𝐾𝐿 a vector that contains all the damage sizes that are at the origin of the matrix 𝐅 ∈ ℝ𝐾𝐿×𝐹. Practically, we thus seek to adjust a linear model 𝐌𝐧𝐜 and a
dimension reduction operator 𝑔𝑛𝑐(. ) which, from the knowledge of learning points 𝐅𝐥 and 𝐘𝐥, can provide an accurate estimate of 𝐘𝐩 for prediction points 𝐅𝐩. An overview of the problem at hand with chosen notations is provided in Figure 1.
Figure 1: Overview of the problem at hand
Dimension reduction methods for damage quantification
The dimension reduction methods used here are very briefly introduced here. For more details, the reader is directed toward references [7, 4, 8] from which this paragraph is largely inspired. The first step of the solution proposed here for damage size quantification consists in projecting the input data to a subspace of dimension 𝑛𝑐 that preserves relevant information for the learning problem. Selected methods are: - Principal Component Analysis (PCA) selects the maximum variance projections of
the input data, imposing an orthonormality constraint for the projection vectors. PCA works under the assumption that high variance projections contain the relevant information for the learning task at hand.
- Principal Least Squares (PLS) are based on latent variables that account for the information contain in the covariance matrix 𝐂𝐘𝐅 = 𝐘𝐓𝐅 . In order to do so, PLS extracts the projections that maximize the covariance between the projected input and output data, again under orthonormality constraints for the projection vectors. - Cross-Correlation Analysis (CCA), rather than maximizing covariance, maximizes
the correlation between projected input and output data. In this way, CCA can more conveniently deal with directions of the input or output spaces that present very high variance, and that would therefore be over-emphasized by PLS, even if the correlation between the projected input and output data is not very significant. - An autoencoder (AE) is a type of artificial neural network used to perform efficient
data dimension reduction in an unsupervised manner [8]. An autoencoder learns to compress data from a small number of features by trying to encode and decode them with the minimum of error and by passing through a reduced dimension space. - Simple direct regression (SDR) is the case where no dimension reduction is applied
and thus 𝑔(. ) is simply the identity. This case is considered as a reference case. In summary, the dimension reduction operator 𝑔𝑛𝑐(. ) is either SDR, PCA, PLS, CCA or AE and makes use of only 𝐅𝐥 (PCA and AE, which are unsupervised methods) or of both 𝐘𝐥 and 𝐅𝐥 (PLS and CCA which are supervised methods) for learning. Once the dimension reduction learning step is learnt, a linear model 𝐌𝒏𝒄 that provides an accurate estimate 𝐘𝐥 = 𝐌𝐧𝐜𝑔𝑛𝑐(𝐅𝐥) for learning samples is also learnt using simple
least-squares. Finally, both the learnt dimension reduction operator 𝑔𝑛𝑐(. ) and linear
model 𝐌𝒏𝒄 are used to predict unknown 𝐘𝐩 from the damage indexes matrix 𝐅𝐩.
TESTED STRUCTURE AND COMPARISON METHODOLOGY
Structure under study
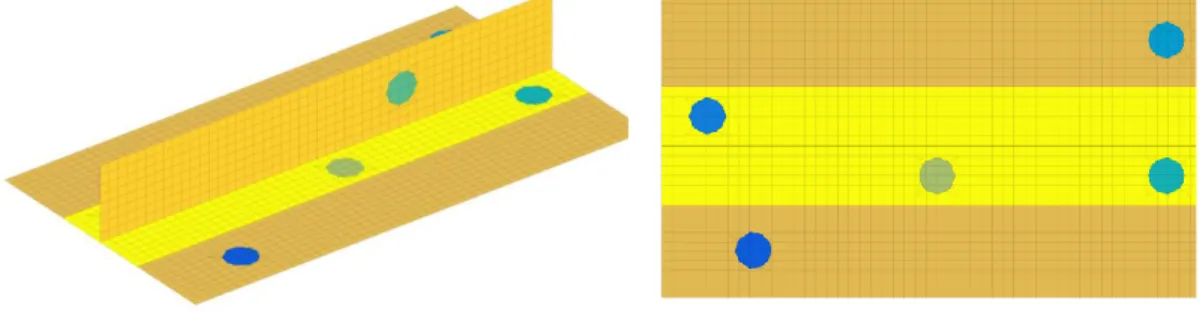
The methods for damage size quantification described above have been validated using numerical data. The structure under consideration is a stiffened composite panel. The structure is made of graphite-epoxy plies with a stacking sequence [45°/0°/45°/90°/-45°/0°] in the skin. One ply has a density of 1.57 g/𝑐𝑚3, a Young modulus in the 0° direction equal to 163 GPa and to 10 GPa in the 90° direction. The structure is equipped with 5 PZTs that can be used both as sensor and actuator. The FEM model with the PZT and damage position is shown in Figure 2. Coordinates of the piezoelectric elements and of the simulated damage can be found in Table 1. The damage is represented by a decrease of the young modulus of 90% in the damaged area. A healthy case, i.e. without damage is used as reference for comparing the signals. Damages have circular shape with a radius varying between 1mm and 10mm by step of 0.5mm leading to 𝐾 = 19 cases (one healthy and 18 damaged). Simulation have been conducted using the Matlab toolbox SDTools® [9].
Figure 2 : FE-model of the stiffened composite plate under study.
PZT1 PZT2 PZT3 PZT4 PZT5 Damage
𝒙 (mm) 50 25 275 275 200 150
𝒚 (mm) 25 98.8 140 66.3 82.5 66.25
Table 1: Coordinates of PZT elements and of damage center
The excitation signal sent to the PZT elements considered as an actuator is a “5 cycles burst” with an excitation frequency of 𝑓0 = 140 kHz and an amplitude of 10 V. The excitation frequency is selected to promote one propagation mode over another. The mode 𝑆0 is promoted over the mode 𝐴0 as it propagates faster [10, 11, 12]. In each phase of the numerical simulation procedure, one PZT is selected as the actuator and the other act as sensors. All the PZTs act sequentially as actuators. Resulting signals are then recorded by the other piezoelectric elements and consist of 𝑆 = 1500 data points sampled at 2 MHz. Gaussian white noise with a signal to noise equal to 70 dB is added to the numerical signals to simulate 𝑛𝑟 = 𝑛𝑢 = 10 experimental repetitions for each case under study (𝐿 = 𝑛𝑐 × 𝑛𝑢 = 100). As 𝐾 = 19 different cases are available, this leads to 𝐾𝐿 = 1900 samples.
The noisy numerical signals are first denoised by means of a discrete wavelet transform up to the order 4 using the “db40” wavelet. Those signals are then filtered around their excitation frequency 𝑓0 using a continuous wavelet transformation based on “morlet” wavelets and with a scale resolution equal to 20. The objective of this pre-processing step is to perform a band pass filtering around the excitation frequency 𝑓0 by means of wavelets. The scale parameter can be sought as an image of the bandwidth of the retained bandpass filter over the frequency range of interest. Here, choosing it equal to 20 is something relatively common as it provides convenient results in past studies [10, 11, 12]. A set of 𝐹 = 22 damage indexes, or features, are then computed on the basis of the denoised numerical signals. One damage index is computed for each path of the structure. The damaged indexes for all the paths over the structure are then summed together in order to get a unique global damage index value. The different standard damage indexes being computed are briefly defined in Table 2.
DI name Definition DI name Definition
CC FFT based implementation of the
maximum of the correlation TDM Time Delay of Max
CCA MATLAB based implementation
of the maximum of the correlation TD1
Time Delay of the first wave packet
CC0 MATLAB based implementation
of the zero-lag correlation SAPR Signal Amplitude Peak Ratio
CRC MATLAB-based implementation
of the correlation coefficient SAPS
Signal Amplitude Peak Squared percentage differences
NRE Normalized residual energy SAHM Signal Amplitude Hilbert
transform Maximum
MA Maximum amplitude of the
difference SSSD
Signal Sum of Squared Differences
MAR Maximum Amplitude Relative CCTOF Cross-correlation-based TOF
percentage difference
FFT FFT ratio of the difference signal
over the sum off signals at 𝑓0 WPSD
Welch-based Power Spectral Density
STFT Short Time Fourier Transform WTF Welch-based transfer function
ENV Energy of the envelope of the
difference CCMPD
Cross-correlation maximum percentage difference
PHI Energy of the phase of the
difference DWTC
Discrete Wavelet Transform approximation coefficients
Table 2: Implemented standard damage indexes
RESULTS
The damage size quantification methods introduced above have been tested on the simulated data coming from the composite structure previously described. Data for damage sizes ranging from 1 mm to 7.5 mm have been used to train the various methods. Data for damage sizes ranging from 8 mm to 10 mm have been used to test the ability of the various methods for prediction of upcoming damaged states. The dimension 𝑛𝑐 of the underlying low-dimension space varied between 1 and 15 to assess the influence of the dimension of the low-dimensional damage indexes space on the obtained results. In order to summarize the performances of each method for a given dimension 𝑛𝑐 of the underlying space, a learning error 𝜖𝐿 and a prediction error 𝜖𝑃 have been computed as the mean of the relative error in % between the true value and the estimated value over the learning and prediction points.
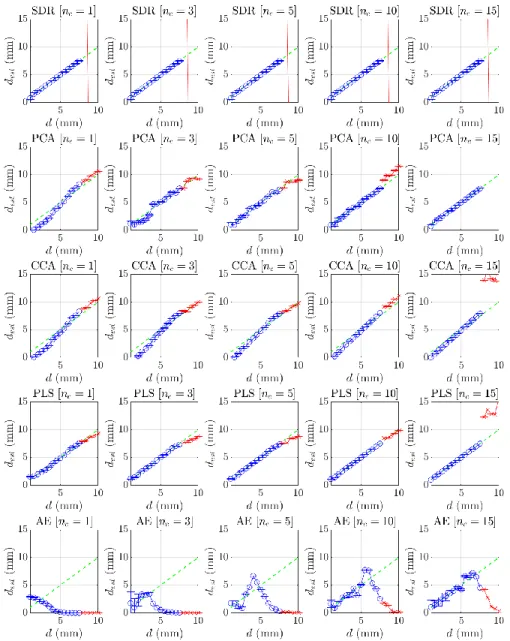
Figure 3: Details of the results obtained for the various tested methods. The diagonal green dashed line represents the ground truth. Blue circles represent damage size estimation for the learning points. Red stars represent damage size estimation for the prediction points. There is one line for each tested method
(SDR, PCA, PLS, CCA, AE) and columns stands for various choice on 𝑛𝑐 (1, 3, 5, 10, 15).
The results obtained for the various tested methods (SDR, PCA, PLS, CCA, AE) and for various choice of 𝑛𝑐 (1, 3, 5, 10, 15) are presented in Figure 3. In this figure, the diagonal green dashed line represents the ground truth, the blue circles represent damage size estimation for the learning points and the red stars represent damage size estimation for the prediction points. From this figure, it can be observed that regarding learning, all methods (except AE) provide satisfying results, even when 𝑛𝑐 = 1. AE totally fails in learning for low 𝑛𝑐 but results are becoming slightly better when increasing 𝑛𝑐. Regarding the learning performances of the other methods, they globally increase when increasing 𝑛𝑐. PCA and CCA furthermore exhibit a tendency to slightly underestimate the damage size for small damage sizes. The prediction results are also presented in Figure 3. For AE, as long as learning performances are poor, it is too be expected that prediction performances will also be poor. This is indeed the case. For SDR, for which there is no dimension reduction before the regression, it can be observed that the
prediction totally fails even if learning performances are acceptable. For the other methods where there is a dimension reduction step before performing the regression (PCA, PLS and CCA), it can be observed that predictions are good if 𝑛𝑐 remains relatively low. For large values of 𝑛𝑐, predictions performances severely degrade. A particular attention should be payed to the case 𝑛𝑐 = 1 which correspond to the theoretical case. It can be seen that for this case PCA, PLS, and CCA are all able to discover a lower dimensional space within the damage index space that is linearly related with physical damage size, which is extremely encouraging.
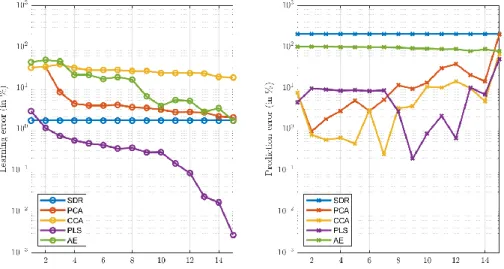
Figure 4: Learning and prediction errors for the different methods as a function of the dimensions of the underlying low-dimension space.
Figure 4 presents the evolution of the learning errors and of the prediction errors with 𝑛𝑐. The same general comment than before can be made: the learning error diminishes with 𝑛𝑐 whereas the prediction error increases with 𝑛𝑐 for all methods. AE do not provide interesting results in the present case. This may be because the data set under study is not large enough to guarantee a good learning process for AE. Another interesting point to notice here is that methods that provide low learning error (for example PLS and PCA for 𝑛𝑐 < 5) are not the ones that perform better for prediction (for example CCA for 𝑛𝑐 < 5). With respect to the usefulness of the dimension reduction step, it can be observed that prediction performances of SDR are the worst among all the investigated methods and thus it can be concluded that it really make sense to perform the regression after reducing the dimension of the damage index space. In terms of quantitative accuracy, CCA can predict damage size with an error lower than 1% for 𝑛𝑐 < 5 and PLS results are of the same order of magnitude with 𝑛𝑐 in the range (8,12) which is very encouraging.
CONCLUSION
The focus is here on composite aeronautic structures and specifically on the damage quantification step. To quantify a detected damage, several damage indexes are extracted from the difference between the reference and unknown states. This damage indexes matrix contains more dimensions that just a quantification of damage size. It is demonstrated that dimension reduction algorithms in the damage indexes space are efficient for quantification purposes. More precisely, PCA, PLS and CCA are all able to discover a low-dimensional space within the damage indexes space that is linearly
related with physical damage size, and that prediction errors of the order of ≃ 1% can be achieved by projecting data through that space.
However, the present results still have some limitations. The first point is that this study has been performed on numerical data and an experimental validation is mandatory in order to validate the proposed approach. Another limiting factor is that the proposed approaches are supervised, meaning that damaged data are necessary for the learning step. One way to avoid that is to rely on numerical data for learning and to be able to predict for experimental data. The last point is that linearity has been assumed for both dimension reduction and regression. Advanced nonlinear multivariate analysis techniques could also be efficient. These points will be investigated in future works.
AKNOWLEDGMENT
This work has received funding from the European Union’s Horizon 2020 research and innovation program under the REMAP project (grant agreement number 769288)
REFERENCES
[1] J. M. Nichols et M. D. Todd, «Encyclopedia of Structural Health Monitoring,» John Wiley & Sons, Ltd, 2009.
[2] W. Staszewski, C. Boller et G. R. Tomlinson, Health Monitoring of Aerospace Structures: Smart Sensor Technologies and Signal Processing, First éd., Wiley, 2004.
[3] R. Hajrya et N. Mechbal, «Principal component analysis and perturbation theory based robust damage detection of multifunctional aircraft structure,» Structural Health Monitoring - An
International Journal, vol. 12, pp. 263-277, 2013.
[4] M. Barker et W. Rayens, «Partial least squares for discrimination,» Journal of Chemometrics: A
Journal of the Chemometrics Society, vol. 17, pp. 166-173, 2003.
[5] R. Rosipal, L. J. Trejo et B. Matthews, «Kernel PLS-SVC for linear and nonlinear classification,» chez Proceedings of the 20th International Conference on Machine Learning (ICML-03), 2003. [6] R. Rosipal et N. Krämer, «Overview and recent advances in partial least squares,» chez
International Statistical and Optimization Perspectives Workshop" Subspace, Latent Structure and Feature Selection", 2005.
[7] J. Arenas-Garcia, K. B. Petersen, G. Camps-Valls et L. K. Hansen, «Kernel multivariate analysis framework for supervised subspace learning: A tutorial on linear and kernel multivariate methods,» IEEE Signal Processing Magazine, vol. 30, pp. 16-29, 2013.
[8] G. Hinton, «Reducing the dimensionality of data with neura networks,» Science, vol. 313, n° %15786, pp. 504-507, 2006.
[9] B. J. L. J. Balmes E, «Structural Dynamics Toolbox 6.2 (for use with MATLAB),,» Paris, 2009. [10] Z. Su et L. Ye, Identification of damage using Lamb waves: from fundamentals to applications,
vol. 48, Springer Science & Business Media, 2009.
[11] C. Fendzi, N. Mechbal, M. Rebillat, M. Guskov et G. Coffignal, «A general Bayesian framework for ellipse-based and hyperbola-based damage localization in anisotropic composite plates,»
Journal of Intelligent Material Systems and Structures, vol. 27, pp. 350-374, 2016.
[12] E. Lize, M. Rebillat, N. Mechbal et C. Bolzmacher, «Optimal dual-PZT sizing and network design for baseline-free SHM of complex anisotropic composite structures,» Smart Materials and