UNIVERSITÉ DU QUÉBEC À MONTRÉAL
,.
\SURVIE DES JUVÉNILES DURANT L'ÉLEVAGE CHEZ LA BERNACHE DU CANADA (BRANT A CANADENSIS MAXIMA) NICHANT AU SUD DU QUÉBEC
MÉMOIRE PRÉSENTÉ COMME EXIGENCE PARTIELLE
DE LA MAÎTRISE EN BIOLOGIE
PAR .
AMÉLIE FONT AINE
Avertissement
La diffusion de ce mémoire se fait dans le respect des droits de son auteur, qui a signé le formulaire Autorisation de reproduire et de diffuser un travail de recherche de cycles supérieurs (SDU-522 - Rév.0?-2011 ). Cette autorisation stipule que <<conformément à l'article 11 du Règlement no 8 des études de cycles supérieurs, [l'auteur] concède à l'Université du Québec à Montréal une licence non exclusive d'utilisation et de publication de la totalité ou d'une partie importante de [son] travail de recherche pour des fins pédagogiques et non commerciales. Plus précisément, [l'auteur] autorise l'Université du Québec à Montréal
à
reproduire, diffuser, prêter, distribuer ou vendre des copies de [son] travail de recherche à des fins non commerciales sur quelque support que ce soit, y compris l'Internet. Cette licence et cette autorisation n'entraînent pas une renonciation de [la] part [de l'auteur] à [ses] droits moraux ni à [ses] droits de propriété intellectuelle. Sauf entente contraire, [l'auteur] conserve la liberté de diffuser et de commercialiser ou non ce travail dont [il] possède un exemplaire.»AVANT-PROPOS
Ce mémoire est composé de trois parties. Une introduction générale rédigée en français présente d'abord une revue de littérature sur la gestion des populations animales qui prqfitent des modifications anthropiques. Je présente ensuite un bref survol de l'écologie des populations de bernaches du Canada et de l'estimation de la survie des juvéniles durant l'élevage. L'introduction générale se termine par l'énoncé des objectifs et des hypothèses de l'étude. Le corps du mémoire est composé d'un chapitre écrit sous forme d'article scientifique rédigé en anglais qui sera soumis pour publication dans une revue scientifique. Une conclusion générale, rédigée en français, termine le mémoire et revient sur les principaux résultats et conclusions de l'étude ainsi que son implication dans ce domaine de recherche. Le manuscrit traite principalement de l'évaluation de la survie des oisons durant l'élevage chez une population de bernaches du Canada établies dans le sud du Québec ainsi que de l'effet des principaux facteurs influençant cette survie. Je serai première auteure alors que mes codirecteurs Jean-François Giroux et Eric T. Reed seront coauteurs tout comme Jean Rodrigue impliqué dans le programme de baguage de bernaches. J'ai effectué la collecte des données en 2013-2014 et réalisé l'ensemble des analyses ainsi que la rédaction de l'article.
En tant que directeur de recherche, Jean-François Giroux rn 'a donné 1 'opportunité de travailler sur un projet passio1mant. J'aimerais le remercier pom cette chance, ses généreux conseils ainsi que sa grande écoute tout au long de ma maîtrise. Un grand merci également à mon codirecteur, Eric T. Reed, qui m'a conseillé et grandement aidé au niveau des analyses. Sans son aide, ces modélisations complexes m'auraient causé bien plus de maux de tête. Un merci spécial à Francis St-Pierre, pour qui les îles de Varennes et sa faune n'ont plus de secret et qui m'a permis de récolter les données de terrain avec facilité et efficacité. Un remerciement spécial à tous les responsables de laboratoire qui m'ont permis d'utiliser leurs ordinateurs pour accélérer le processus d'analyse (Labo Peres-Neto, Labo Giraldeau et Labo d'informatique du département). Un grand merci à mes collègues de laboratoire pour m'avoir encouragée et aidée ainsi qu'à tous les assistants de terrain qui depuis dix ans, ont permis d'amasser et de compiler les données nécessaires à mon projet. J'aimerais finalement remercier toute ma famille et mes amis qui m'ont soutenue pendant les aléas de ma maîtrise.
Cette étude a été possible grâce au soutien financier du Service canadien de la faune d'Environnement Canada, du Conseil de recherches en sciences naturelles et en génie du Canada, la Faculté des sciences de 1 'UQAM ainsi que du Centre de la Science de la Biodiversité du Québec.
TABLE DES MATIÈRES
AVANT-PROPOS ... ii
LISTE DES FIGURES ... vi
.LISTE DES TABLEAUX ... vii
RÉSUMÉ ... viii
INTRODUC:TION GÉNÉFlf\LE ... 1
Gestion de la faune et modifications anthropiques ... 1
La survie des oisons durant 1 'élevage chez les oies et les bernaches ... 3
Facteurs influençant la survie pré-envol chez les bernaches ... 4
Les bernaches du C:anada nichant aû sud du Québec ... 7
Objectifs et hypothèses ... 9
C:HAPITRE I PRE-FLEDGING SURVIVAL OF TEMPEFlf\ TE-NESTING C:ANADA GEESE: THE RELATIVE IMPORTANC:E OF DENSITY-DEPENDENT EFFEC:TS AND INDIVIDUAL C:OVARIATES ... 11 Surnri1ary . . . 12 Introduction . . . 13 Methods ... 17 Results ... 23 Discussion ... 35 C:onclusion ... 42
CONCLUSION GÉNÉRALE ... 44 APPENDICE A
STRUCTURE DES DIFFÉRE TES TRANSITIO S POSSIBLE POUR CHAQUE COHORTE
APPENDICEB
LISTE COMPLÈTE DES MODÈLES UTILISÉS POUR DÉTERMINER LE MEILLEUR MODÈLE À APPLIQUER ET POUR MESURER L'EFFET DU LIEU ET DES ANNÉES
APPE DICE C
LISTE DES MODÈLES UTILISÉ POUR TESTER LA VALIDITÉ DU SOUS-ÉCHANTILLON D'INDIVIDUS DONT L'ÂGE DE LA MÈRE EST CONNU APPENDICE D
PROBABILITÉS DE SURVIE DES JUVÉNILES DURANT L'ÉLEVAGE POUR LES MODÈLES SIMPLIFIÉS UTILI ÉS POUR LES MODÉLI A TI ONS DE L'EFFET DES DIFFÉRENTES COVARIABLES SUR LA SURVIE
LISTE DES FIGURES
Figure Page
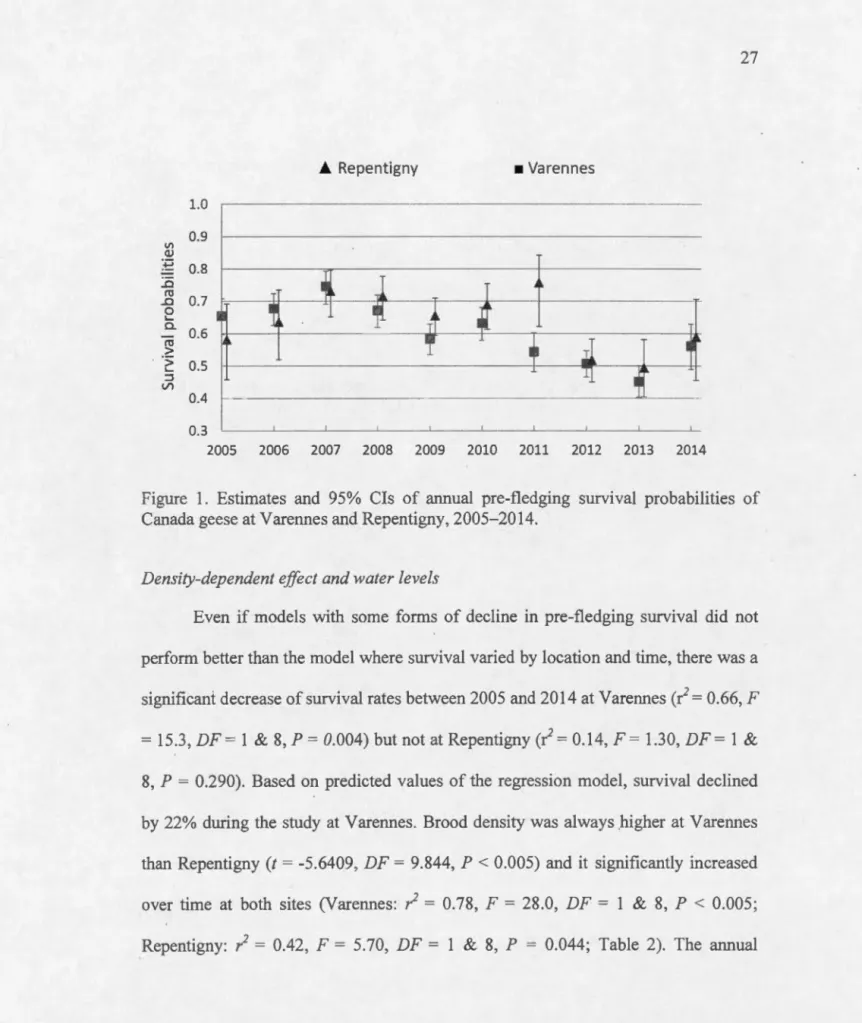
1. Estimates and 95% Cls of annual pre-fledging survival probabilities of Canada geese at Varennes and Repentigny, 2005-2014 ... 27 2. Survival probabilities and 95% Cls (dashed !ines) ofpre-fledgedjuvenile
Canada geese in relation to the ir relative hatching date (day) in sou them Quebec, 2005-2014. Relative hatching date is defined as the number of days from the median hatching date of each cohort. Asterisk following a year indicates a significant effect (single asterisk: f3 95% CI excluding 0 for one of the two beta estimates and double asterisk: f3 95% CI
excluding 0 for the two beta estimates) ... 31 3. Survival probabilities and 95% Cls (dashed !ines) ofpre-fledgedjuvenile
Canada geese in relation to the initial brood size oftheir family in southern Quebec, 2005-2014. Initial brood size is defined as the number of goslings leaving the nest. Years followed by an asterisk indicate a
significant effect (f3 95% CI excluding 0) ... 32 4. Survival probabilities and 95% Cls of pre-fledged juvenile Canada geese in
relation to the age of their mother in southern Que bec, 2008-2014. Asterisk following a year indicates a significant effect. Mother age classes 10 to 15 years were poo led bec a use of small sample size ... 34
Tableau Page 1. Top Mode! selection for survival rate of pre-fledged juvenile Canada geese in
sou them Que bec, 2005-2014 ... 26 2. Brood density for Canada geese in southern Quebec and water levels of
St. Lawrence River during brood rearing recorded at the Varennes
station, 2005-2014 ... 28 3. Mode! selection of hatching date, brood size, temperature, precipitation
and wind on pre-fledging survival rate of Canada gee se in sou them Que bec, 2005-2014 ... 30 4. /3-estimates and 95% CI for the effect of hatehing date on pre-fledged
survival rate of Canada geese in southem Que bec, 2005-2014. Signi:ficant f3 estimates are indicated in bold ... 30
RÉSUMÉ
Les modifications anthropiques intenses des dernières décennies ont permis à
certaines populations animales d'exploiter de nouvelles ressources et d'accroître leur effectif à un point tel où des problèmes au niveau écologique, économique et sanitaire
peuvent survenir. Comprendre les différentes composantes de la dynamique de ces
populations est essentiel afin de prendre des décisions de gestion adéquate. La
bernache du Canada (Branla canadensis maxima) s'est particulièrement bien adaptée
aux milieux urbains et est aujourd'hui considérée comme étant très abondante dans
plusieurs régions des États-Unis et du Canada. Au début des années 1990, une
population s'est établie dans une zone péri-urbaine du sud du Québec et a connu une
forte croissance jusqu'à récemment alors que des facteurs dépendants de la densité semblent se manifester. La survie des juvéniles durant l'élevage n'a pas encore été
déterminée pour ces oiseaux, ce qui constitue le dernier élément manquant afin
d'évaluer leur succès reproducteur. L'objectif principal de cette étude était donc
d'estimer le taux de survie des juvéniles durant l'élevage chez des bernaches du
Canada nichant au sud du Québec, dans les régions de Varennes et de Repentigny. Des effets dépendants de la densité ainsi que 1' effet de 1 'année, de deux sites
d'élevage, des conditions météorologiques (température, précipitations et vent), de la
date d'éclosion, de la taille de la couvée initiale et de l'âge de la mère sur le taux de
survie a également été évalué. Les données obtenues par marquage-recapture entre 2005 et 2014 ont été analysées à 1 'aide de modélisations effectuées avec le logiciel
MARK. La survie pré-envol variait entre 0.45 (95% IC: 0.40-0.50) et 0.76
(0.62-0.84) selon les années et les sites d'élevage. La survie des juvéniles à Varennes a
décliné durant l'étude alors qu'elle est restée stable à Repentigny. Le taux de survie à
Repentigny était légèrement supérieure qu'à Varennes (0.64 (0.53 - 0.72) vs 0.60
(0.55 - 0.65)) où la densité de couvées était plus élevée, supportant ainsi 1 'hypothèse d'effets densité-dépendant sur la survie des jeunes durant l'élevage. La date d'éclosion, et dans une moindre mesure, la taille de couvée et l'âge de la mère avaient
une influence sur la survie des jeunes. La survie était généralement plus élevée pour
des oisons éclos avant la date médiane d'éclosion. La taille de couvée et l'âge de la
mère avaient une influence positive sur la survie. L'élevage des jeunes se déroulait en
majeure partie à proximité des sites d'éclosion. Seulement 13% à 17% des oisons
changeaient de site après l'éclosion. Les modélisations ont également montré un faible taux de perte d'étiquettes de palmure annuelle, soit 2% pour les juvéniles après
l'envol et les sous-adultes et 7% pour les adultes. Cette étude a permis d'approfondir les connaissances sur la dynamique de cette population et sur les facteurs régulant la survie des juvéniles bernaches du Canada avant l'envol en région tempérée. Elle a aussi permis de développer une méthode· innovatrice et robuste permettant 1 'évaluation de la survie des juvéniles durant 1' élevage.
Mots clés : Branla canadensis maxima, dynamique de population, survie pré-envol, conditions météorologiques, site d'élevage, date d'éclosion, taille de couvée, âge de la mère, effets densité-dépendant
INTRODUCTION GÉNÉRALE
Gestion de la faune et modifications anthropiques
Depuis son apparition sur Terre, l'être humain n'a cessé de modifier
l'environnement qui l'entoure et a maintenant un impact direct sur la faune et la flore
(Goudie, 1982). Une des conséquences fréquemment mentionnées est le déclin de
plusieurs espèces végétales et animales (Vitousek et al., 1997). Cependant, certaines
espèces opportunistes peuvent parfois tirer profit de ces modifications d'habitats et
rapidement combler de nouvelles ruches écologiques créées par l'homme et ainsi devenir surabondantes (Destefano & Deblinger, 2005).
En Amérique du Nord, certains cas comme celui du cerf de Virginie
(Odocoileus virginianus) ou du castor du Canada (Castor canadensis) sont bien
co1mus (Côté et al., 2004; Lafond & Pilon, 2004). Cependant, bien d'autres cas moins
connus ont été répertoriés, notamment chez la faune aviaire avec le cormoran à
aigrettes (Phalacrocorax auritus) et plusieurs espèces de goélands (Larus spp.), d'oies
(Anser spp.) et de bernaches (Brant a spp.) (Hindman & Ferrigno, 1990; Bédard et al., 1997; Weiser & Powell, 201 0). De nouvelles sources alimentaires, de nouveaux habitats offrant des sites de nidification supplémentaires ou une protection contre les prédateurs, le contrôle de la chasse et la création de refuges ont tous été suggérés pour
expliquer l'augmentation phénoménale de certaines populations animales (Gering &
Cependant, la taille d'une population ne peut s'accroître indéfiniment. Des
effets densité-dépendants peuvent s'installer au fur et à mesure qu'w1e population
croît et peuvent moduler certains paramètres agissant sur le taux de croissance de
celle-ci. La diminution des ressources, l'augmentation de la compétition, une hausse de la prédation sont les principaux effets pouvant mener à W1e hausse de taux de mortalité, w1e baisse du taux de natalité ou une baisse de l'émigration ayant comme
conséquences de diminuer la taille de la population. Des conditions
environnementales anormales peuvent également subvenir ~t diminuer la taille de la
population. Puisqu'elles survien.llent de rnanière aléatoire et indépendante de la densité, elles n'ont toutefois pas le même pouvoir régulateur que les effets dépendants de la densité (Cain et al. 2008, Begon et al. 2009).
Une population abondante cohabitant avec des hwnains peut causer des problèmes tels que les nuisances associées aux dépôts de fientes sur les terrains privés ou publics, la déprédation dans les terres agricoles et les risques d'accidents routiers
ou aériens (Conover & Chasko, 1985; MacMillan et al., 2004; Cleary et al., 2006).
Cependant, des activités comme la chasse et l'observation de certaines populations
peuvent engendrer des revenus de plusieurs millions de dollars par année
(Groupe-conseil Genivar Inc., 2004; Lafond & Pilon, 2004; Henderson, 2005). Les avantages
3
d'appliquer une gestion fondée sur l'optimisation des bénéfices de ces ressources naturelles tout en minjmisant les nuisances occasionnées.
La gestion d'une population abondante requiert entre autres la connaissance de son utilisation des habitats et de la dynamique de population. Plusieurs paramètres démograpruques incluant le succès reproducteur, l'immigration, l'émigration et la mortalité des individus sont nécessaires afin de modéliser la tendance des effectifs d'une population (Williams et al., 2002). Chez les espèces aviaires, le succès reproducteur inclut le succès de nidification et la survie des jeunes durant l'élevage. Plusieurs méthodes permettent l'évaluation de ces deux paramètres. Cependant, la survie des jeunes durant l'élevage demeure un élément difficile à évaluer avec justesse chez les espèces nidifuges, comme la sauvagine.
La survie des oisons durant l'élevage chez les oies et les bernaches
La survie des jeunes durant l'élevage chez la bernache du Canada et chez les
Anserinae en général, est difficile à évaluer avec précision en partie à cause de leur
petite taille leur permettant de se camoufler facilement dans la végétation, de 1
..
'habitat semi-aquatique dans lequel ils vivent et du fait que les jew1es se déplacent aisément peu de temps après leur naissance (Stolley et al., 1999). En général, les estimations de la survie des oisons sont basées sur l'une des quatre méthodes suivantes: comparaison de la taille moyenne des couvées, comparaison du nombre total d'oisonssur un même site à des dates successives, changement temporel de la taille de la
couvée de femelles marquées ou changement de la taille de couvée d'oisons marqués.
Chacune de ces méthodes comporte ses propres biais. Toutefois, il semble que les méthodes basées sur le marquage individuel donnent les résultats les plus précis (Eberhardt et al., 1989; Stolley et al., 1999). Toujours selon ces quatre méthodes, une revue de littérature affectué par Warhurst et al. (1983) rapportent des taux de survie des jeunes durant l'élevage chez les bernaches du Canada variant entre 59% et 88%.
D'autres études plus récentes comme celle de Fondell et al. (2008) obtiennent des valeurs plus faibles avec une survie de seulement 32%. Les résultats dépendent grandement du lieu d'étude et de la méthode d'estimation, c'est pourquoi il est
difficile de faire des comparaisons directes entre les études (Stolley et al., 1999). Il apparaît donc impératif de trouver une méthode d'évaluation fiable qui pourrait être appliquée de manière standardisée. Les dernières avancées en modélisation reliées aux techniques de capture-marquage-recapture offrent des pistes de solutions intéressantes (Lebreton & Pradel, 2002; Nicolai & Sedinger, 2012).
Facteurs influençant la survie pré-envol chez les bernaches
Les jeunes étant plus vulnérables peu de temps après leur naissance, la mortalité semble se produire en grande partie au cours des deux premières semaines de vie (Brakhage, 1965; Zicus, 1981; Eberhardt et al., 1989; Flint et al., 1995). Les
5
conditions météorologiques comme la température, la pluie et le vent peuvent avoir
une influence négative sur la survie des jeunes durant les premiers jours suivant
1 'éclosion en raison de leur petite taille, de leurs habiletés thermorégulatrices limitées
et de leurs faibles réserves de graisses (Sedinger, 1986, 1992; Blumberg & Sokoloff,
1998).
Un autre facteur important est le site d'élevage. La qualité et la quantité de
végétation comestible disponible à un site d'élevage peuvent exercer w1e grande
influence sur la croissance des jeunes oies et bernaches qui en retour peut avoir un
impact sur leur survie (Aubin et al., 1993; Shorrocks et al., 1998; Hill et al., 2003;
Mainguy et al., 2006). Bien que moins étudiés, le dérangement hwnain, 1 'accès facile
à un plan d'eau, la distance entre les sites de nidification et d'élevage, la compétition
intraspécifique et la prédation peuvent également influencer la qualité d'un site
d'élevage (Vermeer, 1970; Hanson & Eberhardt, 1971; Lake et al., 2008). Pannetier
Lebeuf et Giroux (2014) ont observé des effets dépendants de la densité de couples
nicheurs sur le succès de nidification des bernaches établies dans deux sites ayant un
historique de colonisation et des densités différentes. On peut donc se demander s'il y
a aussi un effet dépendant de la densité sur le taux de survie des juvéniles lié à la
qualité des sites d'élevage.
La date d'éclosion peut également influencer la croissance des jeunes chez la
(Cooch et al., 1991; Sedinger & Flint, 1991; Lindholm et al., 1994) ce qui augmente lem chance de survie (Fondell el al.. 2008). Do iron (2006) a constaté chez la
population de bernaches du Canada du sud du Québec w1e différence allant jusqu'à
36 jours entre la première et la dernière éclosion. Cet étalement des éclosions laisse
présager que les contraintes envir01mementales et alimentaires reliées à la date
d'éclosion seraient moins impottantes en milieu tempéré qu'en milieu arctique ou
subarctique. Cependant, Doiron (2006) a tout de même montré un effet de la date
d'éclosion sur la condition corporelle des juvéniles et Pilotte et al. (2014) ont observé
un plus faible taux de survie post-envol pour les juvéniles éclos tardivement.
La taille de la couvée peut aussi influencer la survie des juvéniles bien que les
mécanismes pouvant expliquer ce phénomène ne soient pas encore bien compris.
L'étude de Loon en et al. (1999) a montré un lien entre la taille de couvée des bernaches nonettes (Branta leucopsis), la croissance des jeunes et la dominance de
l'unité familiale sur les sites d'alimentation. De plus, la survie des juvéniles lors de la
migration autonmale était meilleure chez les familles plus nombreuses. Le
phénomène d'adoption, fréquent chez les Anserinae, peut cependant venir modifier le
nombre d'individus d'une fanülle durant 1 'élevage par rapport à la taille de couvée
initiale (Eadie et al., 1988; Choudhury et al., 1993). Cet important phénomène rend
difficile le suivi des couvées et peut venir biaiser des résultats utilisant la taille de
7
sud du Québec, un taux d'adoption par les couples nicheurs de 50% a été rapporté (Doiron, 2006).
Le taux de survie des jeunes durant 1 'élevage peut finalement être influencé par l'âge de la mère (Raveling, 1981; Rockwell et al., 1993). Selon Rockwell et al. (1993), le succès reproducteur de la petite oie des neiges (Chen caerulescens), basé sur la taille de la ponte ·et la survie des oisons, augmente jusqu'à 1' âge optimal de six ans et décline par la suite. Le développement de comportements agonistiques, une meilleure condition corporelle et une meilleure connaissance des sites d'élevage pourraient contribuer au succès accru des femelles plus âgées (Raveling, 1981). À l'opposé, les femelles trop âgées offriraient des soins parentaux de moindre qualité due à la sénescence ou à leur fidélité à des sites d'élevage perturbés (Rockwell et al., 1993). D'autres études chez différentes espèces de sauvagines ont également montré que les femelles plus âgées ont tendance à nidifier plus tôt et à pondre plus d'œufs (Ringelman & Longcore, 1982; Hamann & Cooke, 1987).
Les bernaches du Canada nichant au sud du Québec
Au début des années 1990, une population de bernaches du Canada s'est établie dans le sud du Québec (Giroux et al., 2001 ). Depuis la découverte de quelques nids sur les îles de Varennes en 1992, la population s'est accrue de façon exponentielle. En 2014, on y dénombrait 320 nids, sans compter les 95 autres nids
localisés sur les îles avoisinantes dans la région de Repentigny (Giroux, J.-F. données non publiées).
Cette croissance élevée est reliée à plusieurs facteurs. Les adultes ont une
faible dispersion reproductive et sont également fidèles à leur site de reproduction
(Giroux, d01mées non publiées). L'étude de Pannetier Lebeuf et Giroux (20 14) a
montré une faible dispersion natale, ce qui signifie qu'une proportion importante des juvéniles sont fidèles à leur site de reproduction. Cette étude montre également que la majeure partie de la population niche sur des îles où les couples trouvent une protection accrue contre les prédateurs terrestres résultant en un succès de nidification
élevé. L'habitat (milieu tempéré et anthropisé) offre des sites d'alimentation
favorables à l'élevage des jeunes (Doiron, 2006). Finalement, leur comportement de
dispersion post-reproductive vers des sites où la chasse est interdite ou moins
intensive (Beaumont et al., 20 13) permet une plus grande survie pour les juvéniles et leurs parents (Pilotte et al., 2014). Depuis 2013, le nombre de couples nicheurs
semble se stabiliser sur les îles de Varennes. Pannetier Lebeuf et Giroux (2014) ont
soumis l'hypothèse que des facteurs dépendant de la densité pourraient commencer à limiter la croissance de cette population. Ils ont en effet observé une réduction du
succès de nidification liée à la fois à l'hétérogénéité des territoires de qualité et aux
9
Au sein de cette population, la survie des juvéniles durant l'élevage n'a pas encore été déterminée. Elle constitue le dernier élément manquant afin d'évaluer le succès reproducteur, qui est un paramètre essentiel dans la compréhension de la dynamique d'une population en croissance et dans l'utilisation de modélisations comme out.il de gestion (Gauthier & Brault, 1998).
Objectifs et hypothèses
Le premier objectif de ce projet de recherche consistait à estimer le taux de survie avant l'envol des juvéniles bernaches du Canada établies dans le sud du Québec à l'aide d'une méthode d'estimation robuste et innovatrice. Le second objectif visait à évaluer l'effet de plusieurs variables individuelles susceptibles d'influencer la survie des jeunes avant l'envol.
Les prédictions concernant l'effet de facteurs influençant la survie des oisons durant l'élevage étaient les suivantes :
1) Les oisons élevés dans la région de Repentigny, où la densité de couvées est moins élevée, auront une survie supérieure à ceux élevés dans la région de Varennes.
2) La survie des oisons sera plus faible s'ils subissent des températures froides, de fortes précipitations ou de forts vents pendant les premiers jours de leur vie.
4) Les oisons issus d'une famille dont la taille de couvée initiale est plus élevée auront une survie plus élevée.
5) La survie des oisons augmentera avec l'âge de la mère jusqu'à l'atteinte d'un plateau puis diminuera avec la sénescence de celle-ci.
I-IAPITRE I
PRE-FLEDGING SURVIVAL 01~ TEMPERATE- E TING C ADA GEE E:
TI-IE RELATIVE IMPORTA CE OF DE SITY-DEPE DE T EFFECT D
Summary
1. Severa! bird pec1es have taken advantage of human modified habitats.
resulting in population increases. Determining how and which demographie
parameter can be affected by these anthropogenic modifications is essential
to under tand population dynamic . Among these parameters, unbiased
estimate of pre-fledging smvival remain relatively difficult to obtain for
precocial birds. Furthermore thi parameter can vary from year to year and
find the causes ofthese variations i another challenge for ecologists.
2. In thi study. we developed an accurate method to cstimate pre-fledging
survival in a population of temperate-nesting Canada gcese (Branto canodensis maxima) that ha undcrgonc an exponcntial increasc during the last two decades. We ais examincd whcther pre-Jlcdging survival -vvas affectcd by dcnsity-dependent cffccts and individual covariates.
3. Between 2005 and 2014. 8.679 goslings \Nere markec\ with web tags ,;o,,hen hatching at two adjacent ites thal support different broocl densitics. total of
3.92:2 of the c birds w re recaptured and banded beforc flcdging while 338 wcre recaptured and banded in ubsequent years as after-hatcbing year birds.
ultistatc moc\els with joint live and dead encountcrs wcre used to estimate
survival and to look at the effects of rearing sites. hatching date. initial brood
size. mother age. and weathcr condition at hatching.
4. During the 10 years of the study, survival varied between 0.45 (95% CI:
0.40-0.50) and 0.76 (0.62-0.84) according to years and sites with an overall
mean of 0.62 (0.55-0.69). Survival rates varied little between the two sites
and declined over time at the site with the highest density. Pre-fledging
survival generally declined for birds hatched after median hatching date and
tended to increase with initial brood size and mother age. Weather conditions
at time of hatching did not affect gosling survival.
5. This study provides the first estirnate of true pre-fledging survival for a
temp rate-ne ting population of Canada geese using an improved and robust
method. Density dependent effects that were shown to influence nesting
success of this population also appear to affect gosling survival.
Keywords: Branla canadensis maxima, brood size, density-dependent effect.
hatching date, gosling, mother age, population dynamics, rearing site, weather
13
Introduction
Rapid urbanization over the last decades has had considerable impact on severa] animal populations. Although many species have been negatively affected, sorne have taken advantage of these changes, resulting in colonization of new areas with sometimes a concomitant exponential population growth. In North America, this has been the case for raccoon (Procyon lotor), white-tailed deer (Odocoileus
virginianus), severa] species of gulls (Larus spp.), and temperate-nesting Canada geese (Branta canadensis maxima) (Hindman & Ferrigno, 1990; Riley et al., 1998; Côté et al., 2004; Weiser & Powell, 2010).
When animais have access to new habitats and abw1dant food resources, a shift in their reproductive output and/or mortality rates can occur (Adams et al., 2006). In birds, components of reproductive success that can be affected include breeding propensity, clutch size, hatching success, and pre-fledging survival. Although ecologists have explored populations dynamic for severa! decades, sorne parameters are still difficult to assess accurately. In precocial birds like waterfowl, unbiased estimation of pre-fledging survival is particularly challenging. lt is usually based on either a comparison of mean brood size through the rearing period, a comparison of the total number of young in a specifie wetland tlu·ough time, a change in mean brood size of marked adults or a change in mean brood size of marked young. Each of these methods has its own biases and can provide divergent estimates
but those based on marked individuals provide the most reliable estimates (Stolley et
al., 1999). Most of all, all these methods have for implicit assumptions that by
comparing proportions of "survivors" in the samples, they will test for differences in "survival probability". In fact, the proportion of individual that are encountered alive
on the different sampling occasion is the product of different processes: the
probability of surviving and returning to the sampling area, and the probability of
being encountered, conditional on being alive and in the sample. The
capture-marking-recapture (CMR) method fills these gaps and the latest advances in modeling
provide new opportunities to develop unbiased robust estimation method for
pre-fledging survival (Gosser & Conover, 1999; Slattery & Alisauskas, 2002; Nicolai &
Sedinger, 2012).
A second challenge is to identify what factors can affect pre-fledging survival.
The major causes of mortality for precocial young are predation,. starvation or
hypothermia, but what improves or reduces the survival can vary among years and
populations and remains little studied in opposition to altricial young. The suitability
of a rearing site can influence pre-fledging survival. It can be affected by the quality
and quantity of food resources, the presence of predators, the level of hurnan
disturbance, and the distance from natal sites (Hanson & Eberhardt, 1971; Aubin et
al., 1993; Hill et al., 2003; Lake et al., 2008; Dunton & Combs, 2010). The suitability of rearing site can vary through years because of adverse environmental conditions
15
like drought, storm or water levels. High water levels can restrict the availability of feeding sites and low water levels can increase the predation by facilitating de movement of predators. In a growing population, the suitability of rearing site can
also be eventually affected by density-dependent effects. High densities have bee.o
attributed to an increased use of territories with lower food availability or to greater competition for food and even to an increase of predation (Ferrer & Donazar, 1996; Sedinger et al., 1998; Elmberg et al., 2009).
Severa! individual covariates can also affect pre-fledging survival of geese.
Weather conditions characterised by low temperatures, heavy rains or strong winds prevailing during the first . few days after hatching can reduce gosling survival because of their small size, their limited thermoregulatory abilities and their minimal fat reserves (Sedinger, 1986, 1992). Geese hatched during the peak of resources can benefit from better feeding conditions enhancing their growth and survival (Cooch et al., 1991; Sedinger & Flint, 1991; Lindholm et al., 1994; Fondell et al., 2008). Pre-fledging survival can also be influenced by initial brood size. Larger families may have an advantage over smaller ones for accessing to the best feeding sites (Black & Owen, 1983; Loonen et al., 1999). Finally, maternai experience may also play a role in juvenile survival. Rockwell et al. (1993) found that brood survival in snow geese (Anser caerulescens) increased with mother age up to 6 years old due to their
increasing knowledge about the best rearing sites and then declined due to female senescence.
In southern Quebec, a breeding population of Canada geese became established in the early 1990s in a suburban area and has grown exponentially since (Giroux et al., 2001; Pannetier Lebeuf & Giroux, 2014). The birds nest on a series of
islands located at two contiguous sites and the young are reared along the shorelines of islands and the mainland. In this study, we first estimate pre-fledging smvival of Canada geese established in this suburban environment by an improved and robust method. Next, we determined whether density-dependent effects can affect pre
-fledging survival by comparing smvival through time and between the two contiguous sites that have a different history of colonisation and different densities of
breeding pairs. If there were sorne density-dependent effects, pre-fledging survival
would decrease according to the increase of density. We also looked at the effects of
individual covariates that could potentially affect gosling survival. We predicted that
survival should be lower for young facing cold, windy, and rainy conditions shortly after hatch. Survival would be lower for early and late hatched goslings. Finally, survival should be lower for young in smaller families and for those with younger or
Methods Study area
17
The study was conducted along the St. Lawrence River approxiJ?1ately 15 km
northeast of Montreal, Quebec, Canada (45 o 40 'N, 73 o 27' W). Canada geese nest
on six large islands located near Varennes (total area: 98 ha) and on 18 smaller ones
near Repentigny (total area: 123 ha). The Varennes and Repentigny sites are contiguous encompassing approximately 11 km of the River. Islands are characterized by areas of open vegetation consisting of herbaceous plants, slu·ubs, and small trees (Parmetier Lebeuf & Giroux, 2014). Nests are initiated between late March and mid-May and the first nests usually hatch in early May with the last ones in mid-June. Rearing takes place along the island shores and the mainland on both sides of the River. Families remain within the study area until they disperse in late summer (Beaumont et al., 2013 ). The rearing habitats include marshes and wet meadows affected by water levels as well as recreational, agricultural, and residential lands along the St. Lawrence River Shores. The shoreline length totaled 40.8 and 43.2 km at Varennes and Repentigny, respectively.
Capture, mm-king and reencounter
Each spring between 2005 and 2014, three systematic nests searches were carried out on each island of the Varennes and Repentigny sites. Nest location was
recorded with a GPS and the number of eggs and parent identity, if they were already
marked with a neck band (see below), were noted. For nests found during laying,
initiation date was calculated by backdating the discovery date considering a laying
interval of 1.5 days. If a nest was found during incubation, the age of the embryos
was estimated by flotation and the initiation date was based on the number of eggs
laid and the incubation stage (Walter & Rusch, 1997). In both cases, hatching date
was predicted considering a 28 days incubation period and used to determine when to
visit a nest for marking newly hatched goslings. Ali the goslings were marked with
unjque numbered web tags (Pi lotte et al., 20 14). The site where goslings were marked
was considered the natal site.
Each July, when adults were molting and therefore both adults and young were unable to fly, flocks of geese were driven towards corral nets set along the
mainland or island shores by people on foot and in boats. The banding operations
lasted 7-10 days each year and included 10-22 catches per year for a total of 151 catches split between the Varennes (n = 70) and Repentigny (n= 81) sites. The date of
the banding operations was adjusted each year to capture juveniles that were
approximately 40-54 days. The site where pre-fledged juveniles were captured was
considered the rearing site. Ali geese were aged as hatching-year Uuveniles) or afte r-hatching year (yearlings and adults) based on plumage, sexed by cloaca) examination, and checked for the presence of web tags. Unbanded birds were fitted with a United
19
States Geological Survey aluminum leg band while a sample of yearlings and adults (females with brood patches, birds with web tags and randomly chosen males) also
received an orange plastic neck-collar with a unique alphanumeric white code. Worn
bands were replaced and those that had opened since the previous capture were
reclosed to redu ce band loss (Pilotte et al., 2014 ). Groups of geese were released simultaneously after each banding drive to reduce the probability of family breakup.
Band recovery data were obtained from the Bird Banding Laboratory (BBL) while
recovered unbanded geese with web tags were either reported through the BBL or
directly to us. Animal handling methods were approved by the UQAM Animal Care
Committee (#578 and #716) and conformed to guidelines of the Canadian Council for Animal Care.
Estimation of pre-fledging survival probabilities
We extended the general approach based on double marking developed by Nicolai and Sedinger (2012) to estimate gosling survival. We improved their approach by using multi-state models that allowed to follow individuals through time in function of different states like age and location. This provides the opportunity to test the robustness of the models through a large set of constraints. Models with joint live and dead encounters also allowed estimation of true survjval compared to studies where permanent emigration and mortality are confounded resulting in an estimation of apparent survival. Multi-state models with joint live and dead encounters
implemented in program MARK 8.0 (White & Burnham, 1999) were used to estimate: (i) true survival (S/'b) defined as the probability that an animal alive in state a at time (i) was alive and in state b at time (i
+
1), (ii) recapture probability (p/), which is the probability that a marked animal alive in state b at time (i) was recaptured at time (i), (iii) transition probability (v;), which is the conditional probability that an animal in one state at ti me i was in another state at ti me i+
1, given that the animal was al ive at time (i+
1 ), and (iv) recovery probability (rb) defined as the probability that a bird has died in state b and its web tag and/or band recovered and reported.The states considered m our models included: age classes (pre-fledged juveniles [a0], post-fledged juveniles [a 1], yearlings [ a2], and adults [a3]), time (to.5,
t,
,
t2, ... , 110), encounter type (web tagging, capture, banding, recapture), encounter
location (Varetmes and Repentigny) and the status of the web tag (present, loss) for a
total of J 8 states (see appendix A). For a given cohort, each individual could switch
among these states during its lifetime with a time interval of 1.5 month for the first interval (hatching to first capture occasion) and 12 months for subsequent intervals (banding at time tx to banding at time tx+1). Use of the natal area for brood rearing varied as a function of disper al rate and time spent on site prior to dispersal. Because we had information on location of the first two encounters of a cohort (natal and rearing sites), we were able to quantify dispersal rate on an arumal and site-specifie
21
basis. Dispersal rates were low (see results) and we therefore assumed that survival estimated as a function of natal site was a good indicator of the rearing site condition considering that the studies of Eberhardt et al. (1989b) in Washington and Zicus (1981) in Wisconsin showed that the majority of families used on! y one rearing a rea and remained on the area w1til the fledging of young. The Joss of web tags was modeled according to the three most plausible relationships: web tag age dependent,
time dependent, and constant through time.
The starting mode!' s structure integrated knowledge of the demographie patterns identified in previous studies of this population (Pilotte et al., 2014). It was constructed by considering: (i) full interaction between time and encounter location for pre-fledging survival and additive effect of time and age class for post-fledged juvenile, yearling, and adult survival, (ii) additive effect of time and age and full interaction among encounter locations, age classes and time for post-fledged juvenile, yearling, and adult recapture, (iii) full interactions between time, age, and encounter location for ali age classes, and (iv) constant and equal recovery for post-fledged juveniles, yearlings, and adults. Based on this initial mode!, a set of 40 reduced candidate models was developed. Monthly pre-fledging survival estimates provided by MARK were then adjusted considering 1.5 month for the pre-fledging period.
Two constraints on pre-fledging survival describing the density of birds and the annual variation in habitat quality were added to the best model to explain
survival variation through years. During rearing, families stayed together and acted as a single unit. They also stayed on the shores and rarely went upland further than 100 m. from the river. The total number of pairs leaving the nest with one or more
goslings was thus used in relation to the total shoreline length available at each site to
provide an index of brood density for each year. Water levels of the St. Lawrence River at the median hatching date for each year were obtained from Fisheries and
Oceans Canada for the Varennes station (#15660; http://www.isdm-gdsi.gc.ca/isdm
-gdsi/twl-mne/index-eng.htm). Water levels are relative to the chart datum reference.
Given the proximity of the two study site~, the water levels recorded at Varennes could be applied to Repentigny. The best models were selected using the Akaike information cri teri on after assessing goodness of fit with program U-Care (Choquet et
al., 2005) and adjusting as needed.
Effect of individual covariates on prejledging survival
Individual covariates including weather conditions, initial brood size, hatching date, and mother age were added to the best models. The new set of models
considered possible interactions between hatching date
*
brood size mother age*
hatching date, mother age
*
·brood size, and mother age*
hatching date*
brood size.The best models were selected using the Akaike information criterion and beta
estimates were used to evaluate the effect of covariates on pre-fledging survival.
23
of the rearing period from the Rivière-des-Prairies station white wind speed (km/h)
was obtained from the Varennes station, both stations being located less than 3 km
from the study are a
(http://climat.meteo.gc.ca/advanceSearch/searchHistoricData f.html). The mean for
the first 4 days of !ife of each gosling (hatch date
+
3 next days) was computed foreach variable. Initial brood size was the number of young leaving the nest where the
young was marked. Relative hatching date of goslings was calculated as the number
of days between the observed hatching date and the median hatchjng date for each
cohort. The effect of mother age was estimated from a subsarnple of individuals
whose mother age was kno\.vn (mothers banded as juvenile or marked as gosling and
subsequently fitted with a neck-collar).
Results
From 2005 to 2014, 8,678 web tags were placed on goslings at hatching
including 6,709 at Varennes and 1,969 at Repentigny. A total of 3,922 were
recaptured and banded as pre-fledged juveniles and 338 as after-hatching year birds
one to six years a:fter their birth. In addition, 880 banded individuals were recaptured
at !east once for a total of 1,319 recaptures. Finally, 966 banded geese were reported
through the BBL. For the analysis on the effect of the mother's age, a sub-sample of
2,805 marked goslings was used.
Loss of web tags
The best mode! that explained the loss of web tags was dependent on age
class. Models that included a time dependent effect or constant through time did not
converge weil. The annual loss rates were 0.022 (95% CI 0.015-0.032) for
post-:fledged juveniles, 0.022 (0.013-0.037) for yearlings, and 0.070 (0.058-0.083) for
adults. The loss of web tags during the pre-fledging period was impossible to evaluate
and considered negligible considering the fact that almost very few young ( <1 0 /year)
were caught with an apparent loss of web tags (hole or tear in the webbing). This
structure was kept for mode! selection of pre-fledging survival.
Pre-fledging survival
The general model fit the data well and showed no over dispersion (ê
= 1.0; n
= 8,678). We therefore used AIC corrected for small sample size relative to the
number of parameters (AICc) for mode! selection.The best-approximating model
indicated that pre-:fledging survival probability varied among years and natal sites ("w;
= 0.74). The second best mode! excluding the interactions between years and natal
sites had less support (w; = 0.20; t..AICc = 2.58) as well as the third best model that
excluded the effect of natal sites (w;
= 0
.05; t..AICc = 5.27; Table 1). These first three-- -- -- ---- - - -
-25
fledging smvival of these three models varied between 0.45 (0.40 - 0.50) and 0.76 (0.62- 0.84) over the 10-year period (Fig. 1). Mean survival during rearing was 0.60 (0.55-0.65) and 0.64 (0.53 - 0.72) for Varennes and Repentigny, respectively for an overall mean of 0.62 (0.55 - 0.69) and generally follow the same trend for both site. Models including the brood density index, water levels and survival decline through . ti me did not perform weil (Table 1 ).
The best mode! included transition probabilities that were similar for ali age classes but varied among years and encounter sites with a Joss of web tags constrained as a function of age class (see appendix B for complete mode! selection). There was a low transition probability from natal site (first encounter) to the rearing site (second encounter during the same year). The probability that a juvenile hatched at Varermes stayed at that site during rearing varied between 0.78 (0.73 - 0.83) and 0.99 (0.96- 1.00) according to years while it varied between 0.74 (0.61 - 0.84) and 0.99 (0.93 - 1.00) for juveniles hatched at Repentigny. In addition, Beaumont et al. (2013) showed that dispersal from the breeding sites does not occur until early August when young are fledged. The use of the natal site as a proxy for the rearing site was thus well justified.
Table 1. Mode! selection for survival rate of pre-fledged juvenile Canada geese in southern Que bec, 2005-2014.
Mode!* AI Cc
t.AICc weight K Deviance Survival ( a0)
Survival
Recapture (p) Transition Recovery (w,) (Sa1a2a3) ( VJa.,.a,=a,=a,) (r)
Sao(t*I) Sa1a2a3(a+t) pa1a2a3(a+t*l) IJI(l *1) rao(. ),a l=a2=a3(.) 0 0.73 132 35159.41
ao(t+l} IJI(l *1) 2.58 0.20 123 35180.31 ao(t) IJI(l *1) 5.27 0.05 122 35185.04 Sao(l*decline ljl(t*l) 7.99 0.01 121 35189.78 Clogit) Sa0(1*decline) ljl(t*l) 39.50 0.00 116 35231.49 Sao(I*ID) IJI(t*l) 48.23 0.00 117 35238.17 Sa0(1*WL) ljl(t*l) 62.58 0.00 116 35254.55 Sao(l) IJI(l *1) 68.24 0.00 114 35264.28 ao(.) IJI(l *1) 70.01 0.00 113 35267.30
• Only top models are presented and only pre-fledged survival and transition for all age classes varied. ao = pre-fledged juvenile; a 1 = post-fledged juvenile; a2 = yearling: a3 = adult. t = time, l = encounter location, a = age class and, . = constant. Clogit=
cumulative logit link. ID= index of density, and WL= water leve!. The
+
betweenvariables indicates an additive effect and the
*
an interaction. K= number of27 À Repentigny • Varennes 1.0 0.9 Vl Q)
:
-e
0.8 ..0 ro 0.7 ..0 0 .._ Q. 0.6 ro > ·:; 0.5 .._ ::::l (/) 0.4 0. 3 _ _ ! _ _ . . J . _ .L -'· ..L. 2005 2006 2007 2008 2009 2010 2011 2012 2013 2014Figure 1. Estimates and 95% Cis of atmual pre-fledging survival probabilities of Canada geese at Varennes and Repentigny, 2005-2014.
Density-dependent effect and water levels
Even if models with some forms of decline in pre-:fledging survival did not perform better than the mode! where survival varied by location and time, there was a significant decrease ofsurvival rates between 2005 and 2014 at Varennes(/= 0.66, F = 15.3, DF = 1 & 8, P = 0.004) but not at Repentigny(/= 0.14, F = 1.30, DF = 1 &
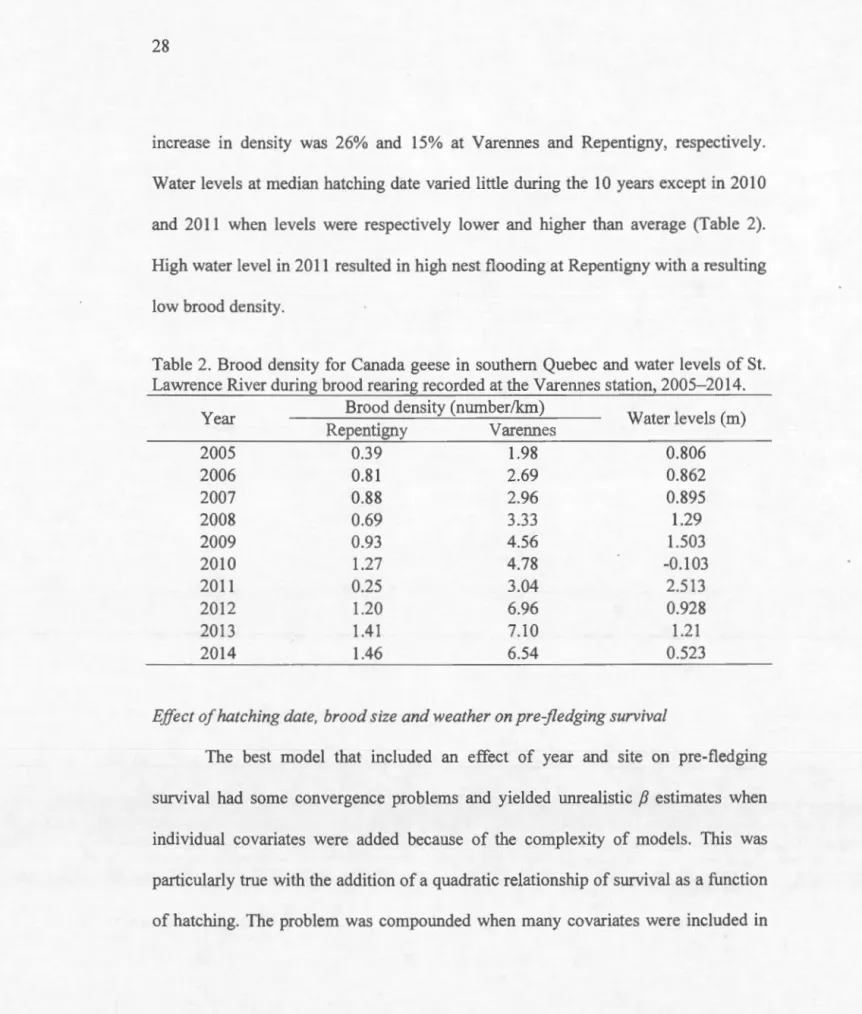
8, P = 0.290). Based on predicted values of the regression model, survival declined by 22% dming the study at Varennes. Brood density was always .higher at Varennes than Repentigny (t = -5.6409, DF = 9.844, P < 0.005) and it significantly increased over time at both sites (Varennes: / = 0.78, F = 28.0, DF = 1 & 8, P < 0.005; Repentigny: / = 0.42, F = 5.70, DF = 1 & 8, P = 0.044; Table 2). The annual
increase in density was 26% and 15% at Varennes and Repentigny, respectively. Water levels at median hatching date varied little during the 10 years except in 2010 and 2011 when levels were respectively lower and higher than average (Table 2).
High water level in 2011 resulted in high nest flooding at Repentigny with a resulting
low brood density.
Table 2. Brood density for Canada geese in southem Quebec and water levels of St. Lawrence River during brood rearing recorded at the Varennes station, 2005-2014.
Brood density (number/km)
Repentigny Varennes Water levels (rn)
Year 2005 0.39 1.98 0.806 2006 0.81 2.69 0.862 2007 0.88 2.96 0.895 2008 0.69 3.33 1.29 2009 0.93 4.56 1.503 2010 1.27 4.78 -0.103 2011 0.25 3.04 2.513 2012 1.20 6.96 0.928 2013 1.41 7.10 1.21 2014 1.46 6.54 0.523
Effect of hatching date, brood size and weather on pre-fledging survival
The best model that included an effect of year and site on pre-fledging
survival bad sorne convergence problems and yielded unrealistic
j3
estimates when individual covariates were added because of the complexity of models. This was particularly true with the addition of a quadratic relationship of survival as a function of hatching. The problem was compounded when many covariates were included in29
interaction. We therefore applied covariates to a simplified mode! structure and used
the third best mode! in which pre-fledging survival was year dependent only. This
model bad a t.AICc= 5.27 and pre-fledging survival estimates were similar to those
obtained from the best model (see appendix D). Our justification was based on
Anderson and Burnham (1999) suggestion that models with t.AICc < 7 do not support strong evidence that they are really different.
The best approximating mode! included an effect of hatching date and brood
size (w; = 1.00). This model performed better than the model without covariates while
models with temperature, precipitations, and wind speed performed less well than the
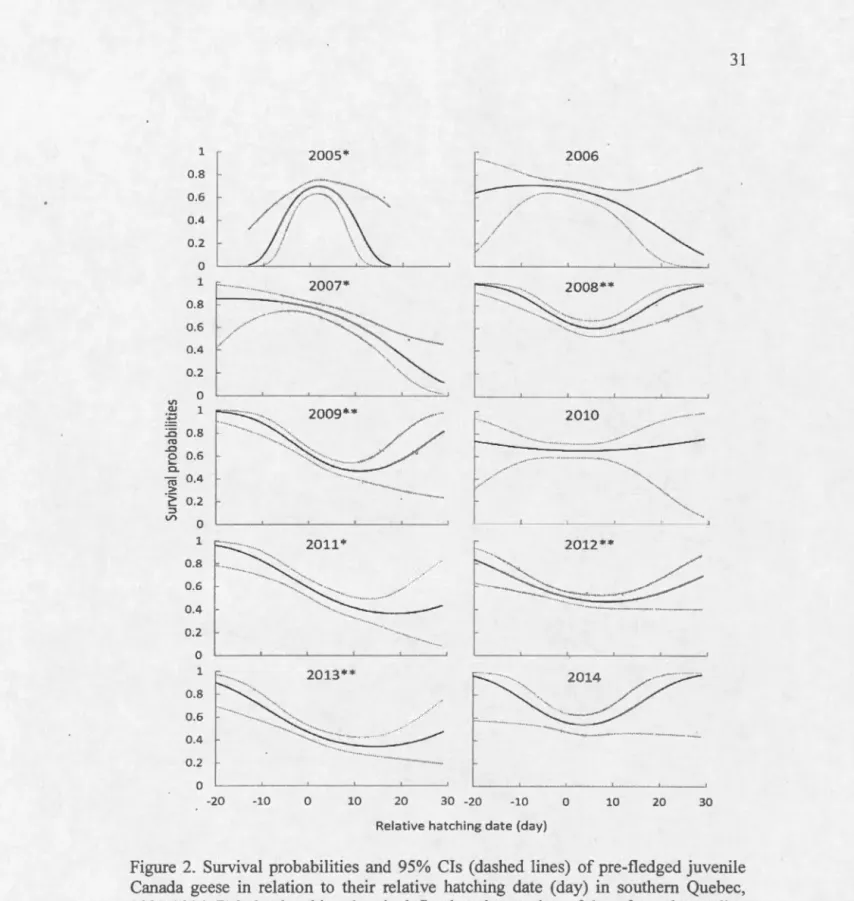
model without covariates (Table 3). Pre-fledging survival was significantly higher for
juveniles that hatched before the median hatching date during six of the 10 years (Fig.
2; Table 4). Survival tended to increase for birds hatched lü days after the median
date in sorne years but the confidence intervals greatly increased. In 2005, survival
was significantly higher for juveniles that hatched around the median hatching date and was lower before and after (Fig. 2).
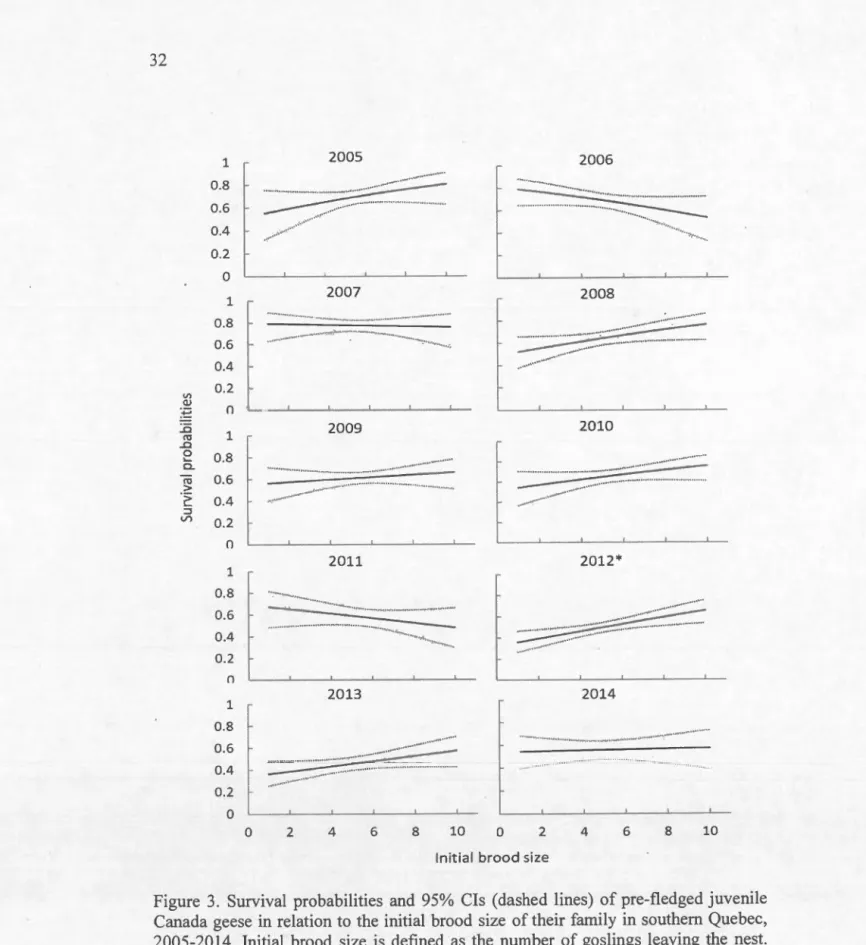
Pre-fledging survival increased with initial brood size during seven of the 10
years of the study but was significant on1y in 2012 (/3=0.17 [0.05-0.28]; Fig. 3). Confidence intervals increased for the lowest and largest brood sizes as a result of small sample sizes.
Table 3. Mode! selection of hatching date, brood size, temperature, precipitation and
wind on pre-fledging survival rate of Canada geese in southern Quebec, 2005-2014.
Mode(
âAICc AICc weight K Deviance
Survival (Sa0) Covariates added to Sa0
Sao(t) Hatching Date* Brood Size 0.00 1.00 125 35059.57
Sa0(t) Hatching Date 21.61 0.00 124 35333.40 Sa0(t) 119.37 0.00 122 35185.04 Sa0(t) Temperature 125.93 0.00 123 35189.56 Sa0(t) Brood Size 144.72 0.00 123 35208.36 Sao(t) Precipitations 147.62 0.00 123 35211.26 Sa0(t) Wind 155.08 0.00 123 35218.72
Only top models are presented. A0= pre-fledged juvenile. The* between variables indicates
an interaction. K= number of estimable parameters. Akaike's [nformation Criterion (AICc) was for ê of 1 for hatching date, brood size, temperature, precipitation and wind.
Table 4. jJ-estimates and 95% CI for the effect of hatching date on pre-fledged
survival rate of Canada geese in southern Quebec, 2005-2014. SignificantjJ estimates
are indicated in bold.
Year j3, 95% CI
13/
95% CI 2005 0.33 -0.09-0.74 -0.64 -1.11--0.17 2006 -0.18 -0.39-0.03 -0.07 -0.24- 0.10. 2007 -0.33 -0.60 - -0.06 -0.06 -0.16-0.05 2008 -0.40 -0.65- -0.15 0.23 0.08-0.38 2009 -0.59 -0.83 - -0.35 0.17 0.03-0.30 2010 -0.02 -0.20- 0.16 0.25 -0.11 - 0.16 2011 -0.52 -0.76--0.28 0.08 -0.02-0.19 2012 -0.19 -0.33 - -0.06 0.07 0.01-0.13 2013 -0.38 -0.56- -0.19 0.08 0.01-0.15 2014 -0.21 -0.50-0.07 0.19 -0.002- 0.38*
fJ
,
and (32 represent respectively the x and x- coefficients of the quadratic relationship between survival rates and hatching date., - - - -- - - ; - - - -- - - -- - - -- - - -- - - , Vl ClJ :~ ..0 ct1 ..0 2 o. ct1 > ·~ :::s V ) 1 0.8 0.6 0.4 0.2 0 1 0.8 0.6 0.4 0.2 0 1 0.8 0.6 0.4 0.2 0 1 0.8 0.6 0.4 0.2 0 1 0.8 0.6 0.4 0.2 0 ... ··· -20 ... ····~ ···. ·•. ··· ... ... -10 2005* 2009** · .... 2013** ... 0 10 31 ···-··· ... ···
r
-
2006 ··· ,.··· • .. ...._ _ _._ _ _ _.__ _ __._ _ _ __..·=··· ··~-....J .. ···r
~ ··· 2010 ... ··· .. ... ···· ·· ... ·.
.
2012** 2014 _ - - t . _ _ ...__ _ _;,_ ____ , ___ , L - - - - 1 20 30 -20 -10 0 10 20 30Relative hatching date (day)
Figure 2. Survival probabilities and 95% Cls (dashed !ines) of pre-fledged juvenile
Canada geese in relation to their relative hatching date (day) in southern Quebec,
2005-2014. Relative hatching date is defined as the number of days from the median
hatching date of each cohort. Asterisk following a year indicates a significant effect
(single asterisk: fJ 95% CI excluding 0 for one of the two beta estimates and double
V'l Q) :~ ..0 ro ..0 0 .... 0.. ro .::: > ,_ ::J V') 1 0.8 0.6 0.4 0.2 -0 1 r 0.8 0.6 0.4 0.2 n 1 0.8 0.6 0.4 0.2 n 1 0.8 0.6 0.4 0.2 n 1 0.8 0.6 0.4 0.2 0 0 2005 ... ··· 2007 2009 ... ... ···. 2011 ··· ··· 2013 2 4 6 2006 ... ,., ···-... ··· 2008 2010 ··· 2012* ··· ..... ···· 2014 8 10 0 2 4 6 8 10
Initial brood size
Figure 3. Survival probabilities and 95% Cls (dashed lines) of pre-fledged juvenile
Canada geese in relation to the initial brood size of their family in southern Quebec, 2005-2014. Initial brood size is defined as the number of goslings leaving the nest.
33
Effect of mother age on pre-fledging survival
The top models remained in the same relative order for the subsample of
juveniles hatched from mothers of known-aged than for the entire sample set
(Appendix C). The best mode! explaining pre-fledging survival included an effect of
year and natal site. Again, this mode! had convergence problems yielding unreliable
f3
estimates when covariates were added, particularly mother age and hatching date that
had quadratic relationships with survival. The problem was even more severe because
the sample size was thre:e times smaller than for the full sample. We were therefore
not able to test interactions between mother age and other covariates like hatching
and brood size.
The best mode! had a simplified structure by the withdrawal of the
interactions between mother age and site The mode! depicting a linear relationship of
mother age on survival performed better than the mode! with the quadratic
relationship (t:.AICc = 5.25) and equivalent to the mode! without covariates (t:.AIC =
0.28). Pre-fledging smvival significantly increases with mother age in 2010 (/3= 0.49
[0.09 - 0.90]), 2012 (f3
= 0.34
, [0.08 - 0.60]), and 2013 (f3=
0.27, [0.01 - 0.55]; Fig.VI (lJ .-t= _o (1J _o 0 '--0.. (1J .::: > '--::) V) 1 ü.8 ü.6 ü.4 ü.2 ü 1 ü.8 ü.6 ü.4 -ü.2 ü 1 ü.8 ü.6 ü.4 ü.2 ü 1 ü.8 ü.6 ü.4 -ü.2 1 ü.8 ü.6 ü.4 ü.2 ü 2005
---
_,._---
----~ ---2007 2009 .... -· ---· .;-·~ ---·-:..:.· --::..:-·; . . : : : _
-
--2011 2013* 20061
· - ! 2008 2010* 2012* J. ._ J... 2014---
..----
... ______---
.... ---1 2 3 4 5 6 7 8 9 lü+ 1 2 3 4 5 6 7 8 9 lü+ Math er ageFigure 4. Survival probabilities and 95% Cls of pre-fledged juvenile Canada geese in relation to the age of their mother in southern Que bec, 2008-2014. Asterisk following a year indicates a significant effect. Mother age classes 10 to 15 years were poo led
35
Discussion
J\lfodeling pre-jledging S7trvival
Om study is among the first to use CMR analytical techniques and get accurate estima tes of pre-f1edging survi val for a precocial bird species. The use of
double marking, recaptures, and recoveries in a multi-state framework increases the
robustness of our estimates and allows an estimation of "true survival" probabilities
for pre-fledged juveniles. lt also allows to determine the factors affecting them. This
is an improvement over the metl1od developed by Nicolai and Sedinger (201 2) who estimated "apparent survival" of pre-fledged juvenile black brant (Branla bernicla nigricans).
An issue with the use of web tags to estimate pre-fledging smvival is that
recapture probabilities are often low and they can incur high Joss rates (Seguin &
Cooke, 1985). However. in our' study we obtained a high recaptme rates of webtagged individuals and an annualloss rate of Jess than 2% per year during the first
two years of !ife of geese and 7% thereafter. Complex modeling approaches often imply a trade-off between the improvement brought by a better fit of a more complex
model to the data and the Joss of precision resulting from a greater number of
parameters. In our case, because of this constraint and the Jimited loss of web tags, survival estimates were not corrected for Joss rates. We nevertheless conducted
survival rates. A considerable limitation of complex multi-state modeling that
includes. covariates is the long· and intensive use computer central processing unit
(CPU) required to obtain mode! convergence. The complexity of some models
compared to the amount of data was also an issue for models convergence. There i
also a loss of precision when a large number of parameters and the interactions
between parameters or covariates are considered. Om result show that using
simplified models to test the effect of covariates on pre-fledging survival appears a
sui table alternative approach ..
Pre-jledging survival oftemperate nesling Canada geese
Few studie have estimated pre-t1edging survival of temperate-nesting Canada
geese but none used CMR analytical techniques that provide true survival
probabilities. Gosling survival rates vary greatly depending on the study area and the
estimation method. Based on total and partial brood loss of marked young and
females. gosling survival was estimated between 0.32 and 0.66 in New Jersey and
Ontario (Guerena (2011) Bruggink et al. (1994). Conover (1998) reported gosling
survival of 0.76 in Connecticut based on brood size of marked female . Our estima te
that ranged between 0.45 - 0.76 among years and sites with an overall mean of 0.62
are thus within the range reported for temperate-nesting Canada geese in the Atlantic
37
We know little about the causes of mortality of goslings. Only nine carcasses were found during our 10-year study, none providing evident elues on mortality
causes. However, ail these dead gosl ings were less than 14 days which support
severa! tudie that found that mortality occurs during the early stage of brood rearing (Brakhage, 1965; Zicus, 1981; Eberhardt et al., 1989a; Flint et al .. 1995). One
mortality cause c01mnonly mentioned is predation but measuring it accurately
remains difficult (Prop et al., 1984; Gosser & Conover, 2000; Bowrnan et al., 2004).
No predation events on broods was witnessed during om study. Potential predators
like the red foxes (Vufpes vu!pes), the American minks (Neovison vison), the northern pikes (Esox lucius). and the peregrine falcons (Fa/co peregrinus) are nonetheless
common throughout our study area.
A few studies fow1d an effect of weather on survival of yotmg for geese or
ducks. Fondell et al. (2008) found that precipitation dming the first three days post-hatch was negatively related to gosling survival and this efiect increased with date. Makepeace and Patterson ( 1980) found that the overall survival of ducklings
increased significantly with increasing number of warm days in the season and
decreased significantly with more windy days. either temperature, precipitation or
wincl had an effect on pre-fledging survival of Canada geese goslings in our study.
Most studies that found an effect of weather on pre-fledging survival of waterfowl were conducted in northern regions (Makepeace & Patterson. 1980; Sclunutz et al.,
--2001; Fondell et al., 2008). Weather conditions in temperate regions like southern
Quebec are likely not severe enough to induce hypothermia of few day-old goslings
and to have a significant impact on their survival.
DensiLy-dependenL and individuals covariates e.ffects on pre-jledging survival
Difference of pre-t1edging survival betv,reen the two sites were small and followed the sa me trends except for 2011. This can mean that the same regional factors
regulate the survival of young at both sites. However, brood density was significantly greater and increased at a faster rate at Varennes than Repentigny. More importantly, survival significantly declined at Varennes but not at Repentigny. Pre-fledging survival declined by 22% at Varennes during the course of the study, which provides some support to a density-dependent effect even if the mode! with the brood density index was not retained to explain annual variations of pre-fledging survival. Our index based on shoreline length may not have been representative of true density compared to an index that would have considered the area covered by different types of rearing habitats.
Water levels during brood rearing were relatively similar throughout the study period except for two years. This variable did not affect annual variations of pre -fledging survival. In this suburban environment, it is possible that families have sufficient anthropic areas to forgo feeding in marshes and wet meadows when these natural habitats are negatively impacted by water levels. Nevertheless, water levels
39
can indirectly influence pre-fledging sw·vival by affecting brood density. Nesting
islands at Repentigny are smaller and are at a lower elevation th an tho se at Varennes. Exceptional high water levels in 2011 caused extensive nest flooding resulting in a
much lower brood density (Pannetier Lebeuf & Giroux, 2014). The highest survival rate of goslings recorded during our study occurred at Repentigny in 201 1, adding some support to an efTect of density.
Our results also show a positive effect of an early hatching date and not a negative effect of early and late hatching as we predicted. Severa! studies have considered density-dependent effects to explain why hatching date influences growth
and survival of different species of geese that breed in subarctic or arctic regions (Francis et al., 1992; Loonen et al., 1997; Brook et al., 20 15). The general mechanism proposed by these authors is a seasonal decrease of food resources on brood rearing areas associated with intense grazing. Although we Jack data on food quality and availability to test this hypothesis, our results show a corresponding pattern. evert11eless, the effect of hatching date on survival was relatively
unexpected because we initially assumecl that it was unlikely that food availability would be limited in temperate regions because geese often forage in anthropic habitats and because of the greater primary production at thi latitude (Running et al.,
2004). ln a controlled experiment, Lindbolm et al. (1994) folmd that supplementing food to late hatched greater snow geese (Chen caerulescens atlanlica) enhanced their