ANAL YSIS OF YEAST MET ABOLOMICS BY LC-MS
THESIS
PRESENTED
AS PARTIAL FULFILLMENT
OF THE MASTERS IN CHEMISTR Y
BY
BlAOJJ
UNIVERSITÉ DU QUÉBEC À MONTRÉAL Service des bibliothèques
Avertissement
La diffusion de ce mémoire se fait dans le respect des droits de son auteur, qui a signé le formulaire Autorisation de reproduire et de diffuser un travail de recherche de cycles supérieurs (SDU-522 - Rév.0?-2011 ). Cette autorisation stipule que «conformément
à
l'article 11 du Règlement no 8 des études de cycles supérieurs, [l'auteur] concèdeà
l'Université du Québecà
Montréal une licence non exclusive d'utilisation et de publication de la totalité ou d'une partie importante de [son] travail de recherche pour des fins pédagogiques et non commerciales. Plus précisément, [l'auteur] autorise l'Université du Québecà
Montréalà
reproduire, diffuser, prêter, distribuer ou vendre des copies de [son] travail de rechercheà
des fins non commerciales sur quelque support que ce soit, y compris l'Internet. Cette licence et cette autorisation n'entraînent pas une renonciation de [la] part [de l'auteur]à
[ses] droits moraux nià
[ses] droits de propriété intellectuelle. Sauf entente contraire, [l'auteur] conserve la liberté de diffuser et de commercialiser ou non ce travail dont [il] possède un exemplaire.»ANALYSE METABOLOMIQUE CHEZ LA LEVURE PAR LC-MS
MÉMOIRE PRÉSENTÉ COMME EXIGENCE PARTIELLE
DE LA MAÎTRISE EN CHIMIE
PAR BIAO JI
ACKNOWLEDGEMENTS
There are too many people to thank for helping me during my Master's studies in bio-analytical mass spectrometry in the last two years. First and foremost, I would like to thank my supervisor, Professor Lekha Sleno, for giving me the opportunity to pursue my Master's degree, offering me invaluable guidance with patience, and providing me with enormous support and encouragement. 1 would like to thank ail the members of Professor Sleno's lab, especially Dr. Makan Golizeh, Dr. André LeBlanc, Leanne Ohlund, Maxime Sansoucy and Ghazaleh Moghaddam for their help and good company. Thanks to Joanie Emond, an undergraduate intem, for her assistance. I would like to acknowledge Professor Sarah Jenna and Professor Mathieu Frenette for kindly accepting to read and review this thesis. I would also like to thank the Department of Chemistry for ki nd support, especially Professor Huu Van Tra, Sonia Lachance and Mathieu Maurin-Soucy. Last, but certainly not !east, I would like to thank my family for their continuous and unparalleled love, help and support throughout my Master's studies and life in general, particularly, I must acknowledge my wife, Caixia, without whose love and encouragement, I would not have finished this thesis.
LIST OF TABLES ... ix
LIST OF ABBREVIATIONS ... x
LIST OF SYMBOLS AND UNITS ... xiii RÉSUMÉ ... xiv
ABSTRACT ... xv
CHAPTER ONE ... 1
INTRODUCTION ... 1
1.1 MET ABOLOMICS ... 1
1.1.1 Targeted Metabolomics ... 3
1.1.2 Untargeted Metabolomics ... 4
1.2 METABOLOMICS TECHNOLOGIES ... 5
1.2.1 Nuclear Magnetic Resonance ... 5
1.2.2 MS-based Metabolomics ... 6
1.2.3 LC-MS/MS ... 12 1.4 RESEARCH INTRODUCTION ... 14
1.4.1 Y east Metabolite Extraction ... 16 1.4.2 Y east Metabolomics Techniques ... 17
1.4.3 Metabolite Identification ... 18
CHAPTER TWO ... 20
METHOD DEVELOPMENT ... 20
2.1 EXPERIMENTAL ... 21 2.1.1 Materials ... 21 2.1.2 Method Optimization ... 21 2.1.3 RP-UHPLC-HRMS/MS Analysis ... 22
2.1.4 Data Processing ... 23
2.2 RESULTS AND DISCUSSION ... 23
v
2.2.2 Comparison of Extraction Solvents ... 24
2.2.3 Comparison ofPre-rinsing Tubes and Glass Beads ... 25
2.2.4 Comparison of Metabolite Extraction Methods, and Sample Drying Methods ... 30
2.2.5 Optimized Sample Preparation Workflow ... 33
2.2.6 Comparison ofThree Chromatography Columns ... 33
CHAPTER Tl-IREE ... 3 8 UNTARGETED METABOLIC PROFILING OF YEAST AUXTROPHIC ST -RAINS BY LC-HRMS/MS ... 38
3.1 ABSTRACT ... 39
3.2 INTRODUCTION ... 39
3.3 EXPERIMENTAL PROCEDURE ... 44
3.3 .1 Materials ... 44
3.3.2 Preparation ofYeast Samples ... 44
3.3.3 Metabolite Extraction ... 45
3.3.4 LC-HR-MS/MS Analysis ... 45
3.3.5 Data Processing and Statistical Analysis ... 46
3.3.6 Metabolite Identification ... 47 3.4 RESULTS AND DISCUSSION ... 48
3 .4.1 Comparison of Chromatographie Separations ... 48
3 .4.2 Statistical Analysis ... 50
3 .4.3 Metabolite Identification ... 54
3.4.4 Pathway Analysis ... 67
3.5 CONCLUSJONS ... 69 3.6 ACKNOWLEDGEMENTS ... 69 3.7 SUPPORTING INFORMATION ... 69 CHAPTER FOUR ... 70 CONCLUSIONS ... 70 APPENDIX ... 74 REFERENCES ... 89
LIST OF FIGURES
1.1 Scheme of four different "amies" and the ir functions as weil as the category of
molecules involved ... 2
1.2 Workflow of LC-MS based targeted metabolomics ... 3
1.3 Workflow of MS-based untargeted metabolomics ... 4
1.4 NMR-based metabolomics workflow ... 6
1.5 Scheme of a typical mass spectrometer ... 7
1.6 General scheme of electrospray ion source ... 9
1.7 Schematic diagram ofTripleTOF™ 5600 mass spectrometer. ... 14
2.1 Representative BPC (overlaid) of 75% IP A, 75% EtOH and 50% MeOH for BetaBasic TM C18 column in positive mode ... 24
2.2 Representative BPC (overlaid) ofnon-rinsing, pre-rinsing tubes by 100% IPA or 1 00% MeOH using 75% IP A, 75% EtOH or 50% MeOH as extraction solvents for BetaBasic TM C18 column in postive mode ... 26
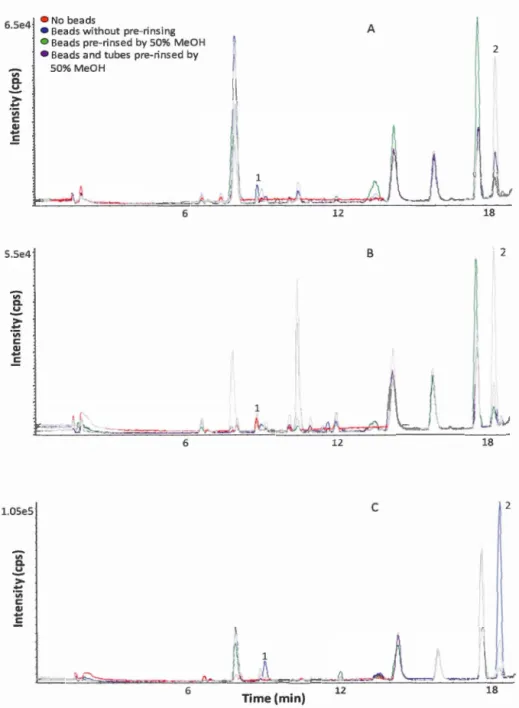
2.3 Representative BPC ( overlaid) of no beads, beads without pre-rinsing, beads pre-rinsed by 50% MeOH, or both beads and tubes pre-rinsed by 50% MeOH, using 75% IPA, 100% MeOH or 50% MeOH as extraction solvents for BetaBasic TM C18 column in positive mode ... 28
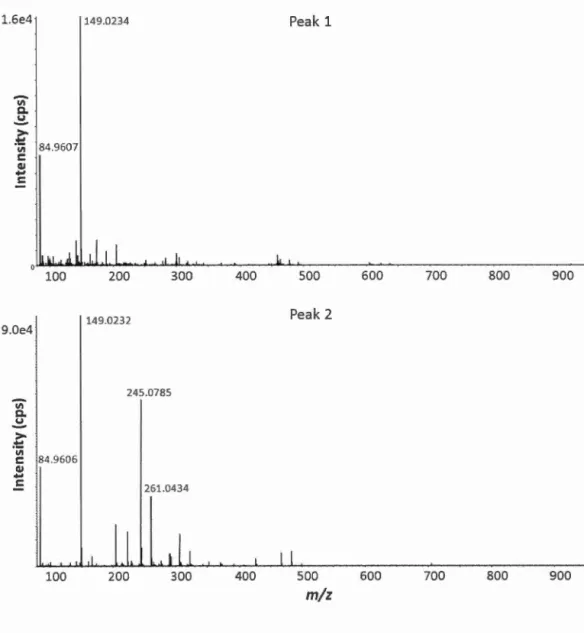
2.4 Representative MS spectra of peak 1 and peak 2 for BetaBasic TM C18 column in positive mode ... 29
2.5 Comparison of metabolite extraction methods and solvents for BetaBasic TM C18 column in positive and negative modes ... 30
2.6 Comparison of metabolite extraction sol vents by bead-beating for 60 seconds at medium speed for BetaBasic TM C1s column in positive and negative modes .... 31
VII
2.7 Comparison of sample drying methods for BetaBasic TM C18 column in positive and negative modes, and HSS T3 column in positive and negative modes ... 32 2.8 Scheme of optimized sample preparation workflow ... 33 2.9 Total ion chromatograms for BetaBasic TM C1s, HSS T3 and PFP columns in both positive and negative modes from LC-HRMS/MS analysis ... 34 2.1 0 Representative extracted ion chromatogram of three internai standards ( overlaid) for HSS T3 column in negative mode ... 35 2.11 Number of non-redundant features from MarkerView™ and MetabolitePilot™, and the ir METLIN hits for BetaBasic TM C 18, HSS T3 and PFP columns in both positive and negative modes ... 36 2.12 Venn diagrams of METLIN hits between three chromatography columns using MarkerView™ in positive and negative modes, and MetabolitePilot™ in positive and negative modes ... 37 3.1 Number of features from yeast extracts (n
=
4) and number of METLIN hits (unique formulas) using MarkerView™ and MetabolitePilot™ for HSS T3 and PFP columns in positive and negative ion modes ... .49 3.2 Venn diagram of the overlapping METLIN hits (unique formulas) between HSS T3 and PFP columns in positive mode using MarkerView™ and MetabolitePilot™ ... 49 3 3 PCA plots of the statistically different peaks for eight yeast strains of four data sets (n=
1 2), using HSS T3 and PFP columns in both positive and negative modes ... 51 3.4 Hierarchical clustering heat maps of statistically different peaks from four data sets ... 53 3.5 Overlaid extracted ion chromatograms of guanine and guanosine from representative yeast extracts from BY4743 and JRY222 strains for HSS T3 column in positive mode, respectively ... 573.6 Extracted ion chromatogram of isocitric acid and citric acid from representative yeast extracts from BY4743 and JRY222 strains for PFP column in negative
mode, respective) y ... 58
3.7 Extracted ion chromatogram of isocitric acid and citric acid from pooled samples ofBY4743 and JRY222 strains, and from standards of isocitric acid and citric acid for PFP column in negative mode separately ... 59
3.8 MS/MS spectra of isocitric acid from the pooled JRY222 sample and standard for PFP column in negative mode ... 60
3.9 MS/MS spectra of citric acid from the pooled JRY222 sample and standard for PFP column in negative mode ... 61
3.1 0 Extracted ion chromatogram of guanineand guanosine rom poo led sam pies of BY4743 and JRY222 strains, and from standards of guanine nd guanosine or HSS T3 column in positive mode, respectively ... 63
3.11 MS/MS spectra of guanine from the pooled JRY222 sample and standard or HSS T3 column in positive mode ... 64
3.12 MS/MS spectra of guanosine from the poo led JRY222 sample and standard or HSS T3 column in positive mode ... 65
3.13 Pathway ofpyrimidine biosynthesis involving URA3 gene ... 67
3.14 Pathway of leucine biosynthesis involving LEU2 gene ... 68
LIST OF TABLES
1.1 Comparison of different mass analyzers ... 10 2.1 Information of three internai standards for HSS T3 column in negative mode .... 35 2.2 Overlap of non-redundant features between MarkerView™ and MetabolitePilot™ for BetaBasic TM C18, HSS T3 and PFP columns in both positive and negative
modes ... 36 3.1 List of tentative metabolites ... 56 3.2 List of identified metabolites confirmed by authentic chemical standards with
APCI B bb BPC BYH BYL BYU
CE
Cl CID OBSoc
OOA
EC
O
El ESIETO
FAB FO FT-ICRGC
HCA
HCO
atmospheric pressure chemical ionization magnetic sector
bead-beating
base peak chromatogram BY4743 + HIS3 BY4743
+
LEU2 BY4743 + URA3 capillary electrophoresis chemical ionization collision-induced dissociation dynamic background subtraction direct current data-dependent acquisition electron-capture dissociation electron impact electrospray ionization electron-transfer dissociation fast atom bombardment field desorptionFourier-transform ion cyclotron resonance gas chromatography
hierarchical clustering analysis higher-energy C-trap dissociation
HILIC HMDB HR HSS IDA IRMPD IT JRH JRL JRU LC LIT LSIMS MALDI MMCD MRM MS MS/MS
N
z
NMR PBS PCA PD PFP PGCQ
QIT QqQhydrophilic interaction chromatography Human Metabolome DataBase
high resolution high strength silica
information dependent acquisition infrared multiphoton dissociation ion trap
JRY222- HJS3 JRY222-LEU2 JRY222 - URA3 liquid chromatography linear quadrupole ion trap
liquid secondary ion mass spectrometry matrix-assisted laser desorption/ionization Madison Metabolomics Consortium Database multiple reaction monitoring
mass spectrometry
tandem mass spectrometry under nitrogen
nuclear magnetic resonance phosphate-buffered saline principle component analysis plasma desorption
pentafluorophenyl
porous graphitized carbon linear quadrupole
quadrupole ion trap triple quadrupole
QqTOF ReTOF RF RP S. cerevisiae SGD SID
SIM
SIMS
SRM TIC TOF UPLC XIC YMDB YPD quadrupole-time-of-fligh reflectron time-of-flight radio frequency reversed phase Saccharomyces cerevisiaeSaccharomyces Genome Database surface-induced dissociation selected ion monitoring
secondary ion mass spectrometry selected reaction monitoring total ion chromatograms time-of-fl ight
ultra-performance liquid chromatography extracted ion chromatogram
Y east Metabolome Database yeast peptone dextrose
LIST OF SYMBOLS AND UNITS Da Dalton Ek kinetic energy g gravity kV kilovolt liter L length m mass rn me ter mm minute mm millimeter
mlz mass-to-charge
ms millisecond
n number of analytical replicates
pp rn part per million rpm revolutions per minute
RT retention time s second ti me Th Thomson !-! micron v velocity
v
volt z chargeperturbations dans le métabolome et les voies de deux souches de levure de type sauvage ainsi que six souches mutantes furent étudiés. Ces mutants se rapportent à des gènes d'auxotrophies et sont identifiés comme étant URA3, LEU2 et HIS3. Un intérêt particulier est porté à ces gènes puisqu'ils concernent la souche la plus souvent utilisée dans la génomique chimique. Cependant, le profilage global de métabolites fut très difficile au cours des dernières décennies, principalement alimenté par une grande variété de propriétés chimiques et physiques ainsi qu'une gamme dynamique des concentrations. Parmi plusieurs techniques d'analyse les plus couramment utilisées, la chromatographie en phase liquide (LC) couplée à la spectrométrie de masse en tandem à haute résolution (HRMS/MS) est devenue une approche extrêmement puissante et populaire pour surmonter les défis rencontrés dans l'analyse d'échantillons biologiques complexes. Cette approche offre de grands avantages tels que la possibilité d'analyses de routine, la résolution, la précision et la sensibilité.
Dans cette étude, une approche non ciblée par LC-MS fut développée afin d'étudier l'effet de l'auxotrophie de l'uracile, de l'histidine et de la leucine. Premièrement, les métabolites intracellulaires furent extraits selon une méthode optimisée par bead-beating à partir du milieu de culture employant trois marqueurs isotopiques nécessaire à la normalisation. Par la suite, le recouvrement du métabolome fut considéré par la comparaison de trois types de colonnes (BetaBasic ™ C18, HSS T3 et PFP). Les données brutes furent traités par les logiciels PeakView®, MarkerView™ et MultiQuant™ afin d'en évaluer la détection, l'intégration et la quantification relative de chaque pics détectés en plus de conserver uniquement les candidats statistiquement différent. L'utilisation de METLIN a permis l'identification des métabolites d'intérêt qui furent subséquemment confirmé par des composés standards. Finalement, les voies biologiques furent analysés par les connections reliées aux métabolites identifiés à différent niveaux génétiques.
Mots-clés : levure, souches mutantes, nutriment auxotrophie, la métabolomique non ciblée, bead-beating, LC-HRMS/MS
ABSTRACT
Saccharomyces cerevisiae (yeast) is a widely used mode! orgamsm in the investigation of molecular and cell biology. In this thesis, perturbations in the metabolome and pathways of two wild-type yeast strains and their six mutant strains involving genes of nutrient auxotrophy, were investigated. These genes, URA3, LEU2 and HIS3, are of specifie interest because they relate to the strains most often used in chemical genomics screens. However, global metabolite profiling has been challenged in the past decades due to a great variety of chemical and physical properties of metabolites, and the widely dynamic range of metabolite concentrations. Among severa] most commonly used analytical techniques, liquid chromatography (LC) coupled with high-resolution tandem mass spectrometry (HRMS/MS) has become a tremendously powerful and popular approach to overcome these challenges in the analysis of complex biological samples, showing great advantages such as high throughput, resolution, accuracy and sensitivity.
In this thesis, an untargeted workfiow for LC-MS-based metabolomics was developed to investigate the effect of uracil, histidine and leucine auxotrophy. Firstly, intracellular metabolite extraction from yeast pellets was performed by an optimized bead-beating method using three isotope-labeled internai standards for normalization purpose. Metabolite extracts were then detected by LC-HRMS/MS approach using three columns (BetaBasic™, HSS T3 and PFP) in both positive and negative modes to compare metabolome coverage. Raw data was processed by PeakView®, MarkerView™ and MultiQuant™ for peak detection, integration and relative quantification. Statistically differentiai features were analyzed by both principle component analysis and hierarchical clustering heatmap analysis. Metabolites were tentatively identified using METLIN database, and then confirmed by authentic chemical standards. Finally, pathway analysis was investigated via the connection of the identified metabolite levels with genes.
Keywords: yeast, mutant strains, nutrient auxotrophy, untargeted metabolomics, bead-beating, LC-HRMS/MS
INTRODUCTION
1.1 METABOLOMJCS
Metabolites are defined as small molecules (having molecule weights less than 1500 Da), such as nucleotides, amino acids, organic acids, fatty acids and lipids obtained from cellular activities (Baker, 2011; Becker et al., 2012). Metabolites provide the complementary information to upstream proteins, genes and transcripts, which are involved in biological networks (Tautenhahn et al., 2012; Gowda and Djukovic, 2014).
The complete coverage of ali metabolites in a given biological system, such as cell, tissue and organism, is described as metabolome (Fiehn, 2002). However, so far the who le metabolome coverage can 't be achieved by any of the analytical platforms or methods due to the large variety of chemical and physical properties metabolites, and the highly diverse range of metabolite concentrations in biological samples (Roberts et al., 20 12).
Global metabolite profiling, or metabolomics, is conducted to perform qualitative and quantitative analysis of the metabolome in a given biological system (Theodoridis et al., 20 12). lt ai ms to discover new potential biomarkers and provide
2
new insights into disease pathogenesis, based on their connections to the changes of metabolites in complex biological samples (Jansson
et al.,
2009; Pattiet al.
,
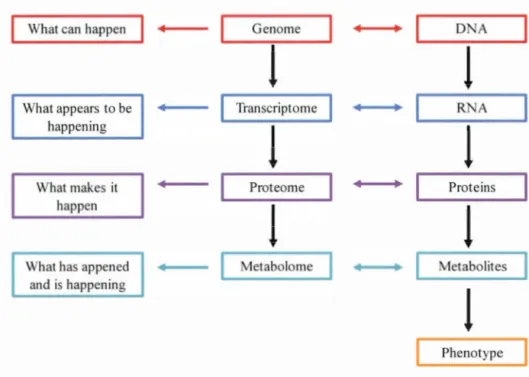
2012; Ward and Thompson, 2012). In systems biology, the relationship between metabolomics and three other "amies" include genomics, transcriptomics and proteomics is shawn in Figure 1.1.What can happen Genome ~
1
DNA1
1
What appears to be Transcriptome RNA
happening
1
1
What makes it Proteome Proteins
happen
1
1
Wh athas appened Metabolome Metabolites and is happening
1
Phenotype
Figure 1.1 Scheme of four different "amies" and their functions as well as the category of molecules involved (scheme adapted from Katja Dettmer
et al.,
2007; Dunn et al., 2011)As depicted in Figure 1.1, Genome can build blacks for other "amies". Metabolomics, the anal y sis of the metabolome, is closest to phenotype and can reveal phenotypic changes induced by genetic mutation, disease or environment (Dettmer
et
al.
,
2007). Also, metabolomics can connect phenotype to genes of interest (Fiehn, 2002).1.1 .1 Targeted Metabolomics
In general, metabolomics can be classified into two categories: targeted and untargeted studies. Targeted metabolomics aims to detect the known metabolites usually related to a particular pathway or specifie type of metabolites (Patti et al., 20 12). It is widely used to analyze and quantify pre-known metabolites in sam pies by high-throughput approaches, mainly nuclear magnetic resonance (NMR) (Weljie et al., 2006) and mass spectrometry (MS) (Wei et al., 2010), which will be discussed in more details later in this chapter. Figure 1.2 shows the workf1ow of targeted metabolomics performed by liquid chromatography-MS (LC-MS). After setting up absolute quantitation methods by selected reaction monitoring for standard metabolites, samples are investigated based on metabolite extract of interests. Stable isotope-labeled internai standards are usually used for data normalization, followed by univariate statistical analysis, such as Student's t-test or principle component analysis (PCA), to differentiate groups (Roberts et al., 2012). However, targeted metabolomics is unable to detect unknown metabolites.
Standard LC-MS of Selected reaction Optimization and
--+
-
quantification ofmetabolites standard metabolites monitoring standard metabolites
!
Quantification of
....,.__
Data processing LC-MS of Preparation of-
-specifie metabolites and analysis metabolite extract biological samples
Figure 1.2 Workf1ow of LC-MS based targeted metabolomics (scheme adapted from Patti et al., 20 12)
4
1.1.2
Untargeted Metabolomics
Unlike targeted metabolomics, untargeted
metabolomics attempts
to detect ali
the measurable metabolites in
biological
samples
b
y
a given
method
(Lee
et al.,201 0)
.
NMR and MS
ha
v
e become the primary methods
used in the in
v
estigation of
untargeted
metabolomics
in the la
s
t
decade
(
Alonso
et al.,20 15)
.
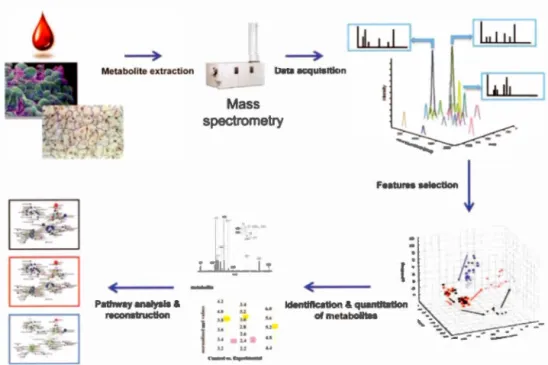
Figure 1.3
illustrates
the
standard workflow of an untargeted
metabolomics
stud
y
using
MS,
w
hich
ai mSto
detect
global
and
unknown
metabolites
b
y
relativ
e
quantitati
ve
analysis.
This workflow is
different
from the one of targeted
metabolomics focusing on specifie and known metabolites
b
y
absolute quantitation
methods (Patti
et al., 2012).
Pathway analysls & reconstruction Mass spectrometry
.
---
·-i.
1~
.
1.1
""""' """'
""
l
(Identification & quantltatlon of metabolites
1.2 METABOLOMICS TECHNOLOGIES
Severa! analytical platforrns have been applied in the study of metabolomics m recent decades. However, due to the large variety of metabolites in biological samples, such as polarity, charge and stability, the whole metabolome coverage still can't be achieved by any single analytical technique. The following section will briefly describe the main analytical platforms used for investigation of metabolomics in complex samples.
1.2.1 Nuclear Magnetic Resonance
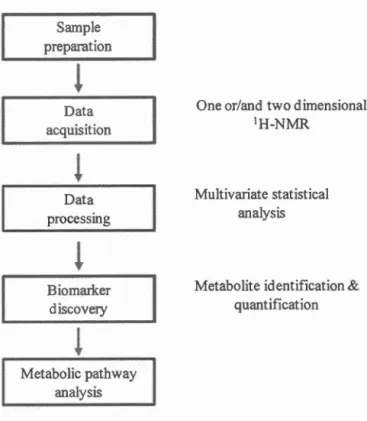
Proton NMR (1H-NMR) spectroscopy is a powerful tool to detect metabolites. Its advantages include being non-destructive to samples, highly reproducible and throughput, and minimal sample preparation required (Dumas et al., 2006; Bharti and Roy, 2012). 1H-NMR spectroscopy can be employed for biomarker discovery by qualitative metabolomics (Blasco et al., 2010; Weljie et al., 201 1). For example, lactate was detected as a biomarker via the changes between the extracts of coelomic fluid of two earthworm species, Eisenia veneto and Lumbricus terrestris, under metabolomic investigation by one and two-dimensional 1H-NMR spectroscopy (Lenz et al., 2005). Also, 1H-NMR spectroscopy can be used to perform targeted metabolic analysis (Zulak et al., 2008; Schicho et al., 2012; Da Silva et al., 2013). For example, metabolites from Parites compressa corals were quantified by 1H-NMR with high reproducibility (Sogin et al., 2014). Figure 1.4 illustrates the typical NMR-based metabolomics workflow. Although NMR is highly selective to metabolites, its sensitivity is comparably lower than other technologies, such as MS (Son et al., 2009; Airoldi et al, 2015).
Sample preparation Data acquisition
l
Data processing Biomarker discovery Metabolic pathway analysisOne or/and two d imensional 1H-NMR
Multivariate statistical analysis
Metabolite identification & quantification
Figure 1.4 NMR-based metabolomics workflow
1.2.2 MS-based Metabolomics
6
Mass spectrometry is currently one of the most widely used analytical methods in metabolomic analysis (Moco et al., 2007). It was employed by Joseph J.
Thomson in 1897 for the first time to determine the mass-to-charge (m/z) ratio of electron, which was discovered by him (Griffiths, 1997). ln 1918, the first magnetic sector mass spectrometer with electron ionization source was introduced by Arthur J. Dempster. After the first commercial mass spectrometer was devised in 1942, MS has been through a rapid development and enormous changes, which have made it to one of the most popular analytical tools in analytical chemistry, including "omics"
analysis, drug discovery, inorganic chemistry, physics, food and pollution control, etc (Stroobant, 2007).
MS generates ions from inorganic or organic compounds by different
ionization methods such as thermal method, electric fields, impacting energetic
electrons, ions or photons, and separates these ions by their mlz ratio, and then detects
them by their individual m/z and abundance (Gross, 2011).
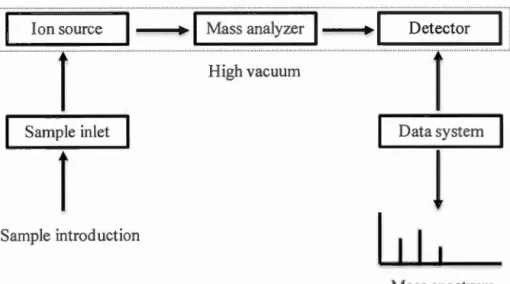
A mass spectrometer contains three essential components, including an ion
source, a mass analyzer and a detector, and other associated components, such as a sample introduction and a data system (Figure 1.5).
1
1
Ion sourc~ ··· ... ···· ... ···· ... ····~~~~ r~~~~..
~l1~1~~~;···u• uuou HUH;;;;····;;;;····;;;;····;;;;D;;;;;;;;et;;;;e;;;;c;;;;to;;;;r;;;;;;;;~l·i High vacuum'···r··· ... r···
r---...;;.--...,
Sample inlet Data system
l
Sample introduction
Mass spectrum
Figure 1.5 Scheme of a typical mass spectrometer. The ion source for some types of mass spectrometers don't require high vacuum
8
The role of an ion source is to produce gas phase ions from atoms or molecules by an ionization process. A great variety of ionization methods have been introduced: (1) electron impact (El), (2) chemical ionization (CI), (3) API (atmospheric-pressure ionization) includes atmospheric-pressure photoionization (APPT), atmospheric pressure chemical ionization (APCI) and electrospray ionization (ESI), and (4) desorption ionization, such as field desorption (FD), fast atom bombardment (F AB), secondary ion mass spectrometry (SIMS), liquid secondary ion mass spectrometry (LSIMS), plasma desorption (PD-MS) and matrix-assisted laser desorption/ionization (MALDI). Based on the volatility of analytes, ionization, such as El or CI, can be performed under vacuum for volatile compounds or at atmosphere,
for example APCI or ESI, for non-volatile compounds. According to the energy of ion source, EI is considered as hard ionization method mainly producing fragment ions, while ESI and MALDI are soft ionization techniques mostly generating molecular ions for bimolecular analysis (Gross, 2011).
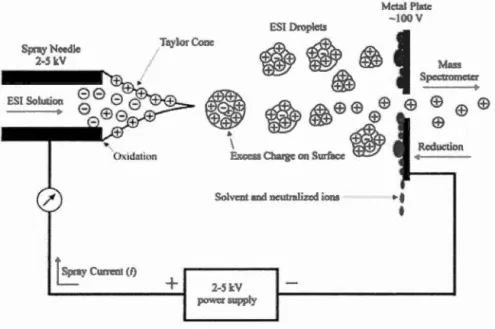
ESI was introduced by Malcolm Dole in 1968, and then was developed by John. B. Fenn in 1984. Jt is one of the most widely used ionization methods in MS in the chemical and biochemical analysis. Futihermore, it is one of most popular API techniques coupled with LC-MS to detect non-volatile, large and charged biological molecules by producing multiply charged ions. Figure 1.6 illustrates the process of ESI. Dilute sample solution is sprayed through a capillary at a rate of 5-20 j.!l/min, forming charged droplets. The capillary is in a strong electric field held at a potential of 2-5 kY under atmospheric pressure. Then desolvation of ions is performed via solvent evaporation from these droplets by a countercurrent stream of hot nitrogen (also called curtain gas) or a heated capillary. Finally, selected ions will pass through the skimmer orifice into mass analyzer under high vacuum (De Hoffmann and Stroobant, 2007; Gross, 2011).
pra 'cedle 2·5 kY l Solution Oxida1ion
+
Metal Plme -lOO V ESl Droplcts~·®>
~
tffb. • ®:)•
tffb.
@
e
e
@:)e
•
\ E ·cess Chrugc on Surface•
+ + ; '+'Sol vent and neut.ralizr:d i ns ~ t
2-5kV power supply
•
Miss pectrometer•
Reduction•
Figure 1.6 General scheme ofelectrospray ion source (Cech and Enke, 2001)
Different types of mass analyzers, separating ions based on their m/z ratios,
have been developed, including magnetic sector (B), linear quadrupole (Q), ion trap (IT) incorporating linear quadrupole ion trap (LIT) and quadrupole ion trap (QIT),
time-of-flight (TOF) and reflectron time-of-flight (ReTOF), Fourier-transform ion
cyclotron resonance (FT -ICR) and Orbitrap. The comparison of these mass analyzers
10
Table 1.1 Comparison of different mass analyzers
Q IT TOF ReTOF B Orbitrap FT-ICR
Mass limit (Th) 4000 6000 > 1000000 10000 20000 50000 30000
Resolution 2000 4000 5000 20000 100000 100000 500000
Mass accuracy (pp rn) 100 100 200 10 < 10 <5 <5
Quadrupole is currently one of the most widely used mass analyzers. It was developed by Wolfgang Paul and his group, which brought him the Nobel Prize in 1989. A linear quadrupole analyzer is composed of four parallel hyperbolic or cyl indri cal rods, of which, two opposite pairs of rods have the sa me potential of direct current (DC) and radio frequency (RF), respective) y. The trajectory of ions within the quadrupole is affected by the applied voltages, only allowing selected ions with certain m/z ratio to pass through. Based on its function, quadrupole analyzer is also called mass filter (De Hoffmann and Stroobant, 2007; Gross, 2011). Due to the low resolution (Jess than 2000), quadrupole is usually used in tandem MS (Johnson et al.,
1990; De Hoffmann, 1996), which will be described later in this chapter.
TOF analyzer is also one of the most powerful and common mass analyzers. L TOF was firstly introduced by Stephens in 1946 (Stephens, 1946) and then developed by Cameron and Eggers in 1948 (Cameron and Eggers, 1948). In the mass spectrometer, ions are accelerated by an electric field with potential V into a field-free flight tube with the same kinetic energy (Ek). The Ek of an ion with mass m and charge q can be calculated by
_: mv2 =
qV
2 (1.1)
The ions are then separated based on their velocities v, which are obtained by
v
=
.)2qV
fm (1.2)The ti met of ions traveling through the tube of length L is given by
t
=
Ljv (1 .3)Therefore, replacing v by equation 1.2 gives
t L
J2qV jm (1.4)
L TOF analyzer has numerous advantages, such as fast data acquisition and theoretically unlimited mass range. However, its resolution is relatively low due to the variations of kinetic energy and departure positions of ions with same mlz,
reaching the detector at different time (Gross, 2011). ln order to improve the resolution of LTOF analyzer, an electrostatic reflector or reflectron was introduced by
Mamyrin in 1994 (Mamyrin, 1994). The resolution of ReTOF analyzer is largely increased by creating a retarded field, which enables ions with the same mlz arriving at the detector at the same time. Recently, ReTOF has become one of the most powerful analyzers in metabolomic studies, which will be widely described later in
12
1.2.3 LC-MS/MS
For the analysis of complex mixture, especially biological samples,
chromatography is used to couple with mass spectrometer. Gas chromatography-MS
(GC-MS) is able to separate the structurally similar compounds with relatively higher
sensitivity (Chatham
et al.
,
2003; Gregorye
t
al.
,
2011). However, GC-MS is not ableto detect sorne polar and large compounds, since it is only for the investigation of
thermally labile and volatile metabolites or those can be converted to be volatile by
derivatization (Iwasaki
et
al.
,
2012). Capillary electrophoresis-MS (CE-MS) is awidely used technique in biological analysis, displaying a better separation
performance and selectivity for many charged metabolites (Tanaka
et
al.
,
2008). Themain disadvantage of CE-MS is the relatively lower sensitivity (Cai
e
t
al.
,
1995).Considering the limitations of GC-MS and CE-MS, LC-MS has become a
more powerful method in metabolomics. Since most of metabolites are water-soluble,
LC-MS equipped with ESI as ion source is recently one of most often used
techniques for the simultaneous analysis of thousands of polar or non-polar
metabolites with outstanding sensitivity and selectivity (Rojo
e
t
al.
,
2012;Kuehnbaum and Britz-Mckibbin, 2013). Reversed phase-liquid chromatography (RP
-LC) can be used for both polar and non-polar metabolites and hydrophilic interaction
chromatography (HILIC) is an optimal approach for the very polar metabolites
(Cubbon
e
t
al.
, 2010;
Tanget
al
.,
2015), which will be discussed in details in Chapter3.
In order to perform structural and sequencing studies, tandem MS (MS/MS)
containing at least two stages of mass analysis is required, of which MS/MS means
MS 1 and MS2 separately. Tandem MS can be performed in space by coupling two
mass analyzers, such as TOF/TOF, triple quadrupole (QqQ) and QqTOF, or in tirne
steps of mass analysis. Depending on the mass analyzer, it is possible to realize MS3 or MSn by both of the tandem MS methods. Generally, tandem MS is employed by
selecting a precursor ion in the first analyzer, then fragmentation from the selected
precursor ion will be performed to achieve product ions or the specifie neutral loss in
the second analyzer by activation. There exists a variety of types of ion activation,
including collision-induced dissociation (CID), higher-energy C-trap dissociation
(HCD), electron-capture dissociation (ECD), electron-transfer dissociation (ETD),
infrared multiphoton dissociation (IRMPD), and surface-induced dissociation (SID) (De Hoffmann and Stroobant, 2007; Gross, 2011).
In
targeted metabolomics (Figure 1.2), quantitative analysis of standardmetabolites can be performed by LC-MS/MS using selected reaction monitoring
(SRM), also termed multiple reaction monitoring (MRM) (Patti et al., 20 12; Zhou et
al., 2012). In SRM or MRM experiments, both precursor ions and fragment ions are
selected, presenting a better selectivity than selected ion monitoring (SIM) in which
only precursor ions are monitored. QqQ is one of the most common tandem MS to
execute SRM or MRM, selecting precursor ions and fragment ions in Q1 and Q3, two
quadropole mass filters, separately, while fragmentation occurring in Q2, the
collision cell (Lange et al., 2008; Domon and Aebersold, 2010).
The most widely used tandem MS in untargeted metabolomics (Figure 1.3)
are hybrid mass spectrometers combining the advantages of different mass analyzers,
such as quadrupole-time-of-flight (QqTOF) and L TQ-Orbitrap (Patti et al., 2012). In
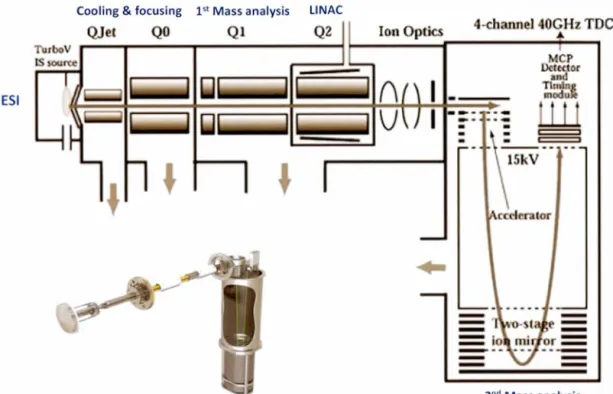
this study, the hybrid QqTOF, TripleTOF™ 5600 (AB Sciex, Figure 1.7), was
employed to perform LC-MS/MS analysis, achieving the coupled features of high
14
Cooling & focusing l" Mass analysis LINAC
4-channel 40GH't TOC
ESI
znd Mass analysis
Figure
1.7
Schematic
diagram
of TripleTOF™ 5600 (AB Sciex)
mass
spectrometer.
LINAC:
l
inear accelerator
collision
cell
1.4
RESEARCH
INTRODUCTION
Y east
is
eukaryotic
microorganism,
current
l
y
having more than 1500
identified
species (Kurtzman and Fell
,
2006)
.
Among
thes
e
species
,
the well
-kn
own
budding
yeast
Saccharomyces cerevisiae (S. cerevisiae),which
is
also called
baker
'
s yeast or
budding refers to the asymmetric cel! division in yeast, forming a bigger mother cel!, and a bud or a daughter cell (S. Becker et al., 2012).
S.
cerevisiae has become more popular as a mode! organism in molecular and cell biology studies, especially after having its full genome sequenced in 1996(Goffeau et al., 1996). This is due to its simple cultivation conditions and short generation time within 90 minutes as well as high-throughput feature (Haladus et al.,
1982; Danku et al., 2009). Besides,
S.
cerevisiae cells are similar to higher eukaryotesincluding human cells. Moreover, gene mutation can be easily performed using
S.
cerevisiae on both chromosomes and plasmids to investigate the impacts of gene
expression and phenotypes (Duina et al., 2014).
S.
cerevisiae has also been widely used in chemical genetics studies since its gene knockout (or deletion collection) was completed in 2002 (Giaever et al., 2002). Chemical genetics is the field to discover biological processes by perturbation of small molecules (Kawasumi and Nghiem, 2007). Compared to traditionaltarget-based screen designating a target in vitro but usually fails to yield optimal inhibitors
in vivo, chemical genetics is able to better mimic intracellular conditions and perform
phenotypic screen for chemicals to identify their cellular targets via unbiased
methods. Thus, chemical genetics has greatly facilitated drug discovery (Enserink,
2012; St. Onge et al., 2012).
In chemical genetics, auxotrophic markers such as URA3, LEU2, HJS3, TRP 1
and METJ5 have been widely used to generate yeast
S.
cerevisiae mutants by geneticmanipulation (Pronk, 2002; Gonzalez et al., 2008). These markers can encode the
essential enzymes in pathways for biosynthesis of metabolites. For example, URA3,
LEU2 and HJS3, encode orotidine-5'-phosphate decarboxylase, beta-isopropylmalate
dehydrogenase and imidazole glycerol-phosphate dehydratase, the key enzymes in
16
respectively (Boeke
et al.,
1984). The perturbation of genome between wild-type andmutant strains can be investigated via phenotype changes through metabolomics
studies. Haploids, BY4741 and BY4742, and diploid BY4743, are the three most
commonly used auxotrophic parental strains, which are derived from S288C stain
isolated by Robert K. Mortimer in the early 1950s (Harsch
et al.
, 2010;
Müllederet
al.
,
2012; Walkeret al
.,
2014). A variety of studies have been reported. For example,metabolome studies upon genetic perturbation was analyzed between BY4741 or
BY4743 and their mutant strains by 1H NMR (Bundy
et al.
,
2007; Lourençoet al
.,
20 13); global metabolite profiling was conducted and compared between BY 4 742and its mutant strains to discover the possible targets for new antiviral drugs by
GC-MS (Schneider e
t
al.
, 2009).
The goal of this thesis is to investigate the perturbations in the metabolome
and pathways of yeast wild-type BY4743 and JRY222 strains, and their six mutant
strains related to URA3, LEU2 or HJS3 auxotrophy by untargeted metabolomics.
However, there exist several main challenges including a great variety of chemical and physical properties of metabolites, and the widely dynamic range of metabolite
concentrations, as well as the difficulties in metabolite identification (Walsh
et al.
,
2008; Johnson and Gonzalez, 2012).1.4.1 Y east Metabolite Extraction
Yeast metabolites can be categorized into extracellular or intercellular
(metabolic footprinting), and intracellular (metabolic fingerprinting) types (Allen
et
al.
, 2003)
. Centrifugation or filtering is the main approach used to collect cell pelletsmetabolites are obtained from the supernatant of cells, while intracellular metabolites
are extracted from cell pellets (Japelt et al.
,
2015).Metabolic fingerprinting is a widely used non-targeted approach in
metabolomics. After metabolism quenching and cell lysis, metabolite extraction will
be performed. To achieve the maximal metabolome coverage with optimal
repeatability while avoiding metabolite degradation, severa! methods have been
reported and compared, including hot water (Kuo et al., 1964), sonication (Flikweert
et al
.
, 1996)
, freeze-thaw (Parket al.
,
1997), boiling ethanol (Gonzalez et al., 1997)
,cold methanol (De Koning W, 1992) and bead-beating (Sporty
et al.,
2008).However, the full metabolome coverage can't be achieved by any approach (Canelas
et al.
,
2009). In this thesis, an optimized metabolite extraction procedure usingbead-beating was developed, which will be widely discussed in Chapter 2.
1.4.2 Y east Metabolomics Techniques
The main techniques in yeast metabolomics are also NMR and MS based
approaches as previously discussed. Puig-Castellvi et al. (2015) performed untargeted
profiling of yeast metabolites, of which 38 were identified and relatively quantified
by 1H-NMR. However, the relatively lower sensitivity hampered its application in
metabolomics studies (Son
et al.,
2009). Recently, MS-based techniques includedirect infusion, GC-MS, CE-MS, FT-ICR-MS and LC-MS have played a key role in
yeast metabolomics investigation. Among these methods, LC-HRMS/MS is optimal
for both polar and non-polar metabolite detection, providing enormous advantages
such as high throughput, resolution, accuracy and sensitivity (Smedsgaard and
Nielsen, 2005; Ibanez
et al.
,
2013). As previously described, LC separations areRP-LC-18
HRMS/MS analysis to compare and maxtmtze metabolome coverage of yeast
samples in this thesis, which will be discussed in more detail in Chapter 2 and
Chapter 3.
1.4.3 Metabolite Identification
In
yeast untargeted metabolomic studies, thousands of diverse and unknowncompounds can be found. Thus, it is highly required to identify metabolites of interest
for the following biological investigation, for example, metabolic network and
pathway.
Isotopie labeling is one of the mam approaches used in metabolite
identification (Hegeman
et al
.,
2007; Klugere
t al
.,
2014). The basic principle is to employ stable isotope tags to the samples, for example, by growing cells on 12C-unlabeled (light) or 13C-labeled (heavy) carbon source, and then mix the two types of samples (Chokkathukalam
et al
.,
2014). Stable isotope labeling is widely used in thesamples that are detected by high-resolution mass spectrometry (HRMS) such as
QTOF, LTQ-Orbitrap or LIT-FT-ICR, in which the characteristic isotopie patterns
between the heavy and light samples can highly improve metabolite identification (J. F. Xiao et al., 2012). However, it suffers the high costs, time-consuming process or variability in labeling efficiencies (G. W. Becker, 2008; Saxena
e
t
a
l.
, 2012)
.Another approach is to perform putative identification by searching against
databases include METLIN (https://metlin. cripp .edu) (Smith
e
t
al
.,
2005), Human Metabolome DataBase (HMDB, http://www.hmdb.ca) (Wisharte
t al.
, 2007)
, Yeast Metabolome Database (YMDB, http://www.ymdb.ca) (Jewisone
t al
.,
2012),(Cui
et al.
,
2008) and
MassBank
(
http:
//
www.
m
ass
b
a
nk.jp
) (Horai
et al.
,
2010).
METLIN provides
comprehensive
information
about
more
than 200,
000 metabolites
and
their more than 70
,
000 MS
/
MS
spectra acquired on a 6510
Q-TOF
(Agilent
Technologies)
coupled
with ESI
in both positive and negative modes using different
collision energies (0
,
10
,
20 and
40
V).
By defining
m/zvalues
,
mass
accuracy,
charges or adducts
,
metabolite bits can be retrieved in METLIN,
followed
by
comparing MS
/
MS
spectra with samples
to
obtain
putative identification.
The
authentic
pure
chemical standards of
these putative metabolites
are
then purchased
and analyzed with samples
under the identical analytical conditions to
compare
their
retention
times
and
MS/MS
spectra.
This method bas
greatly facilitated the
identification
of
metabolites
,
making METLIN become
one of
the most popular
databases in this
field (Tautenhahn
et al
.
,
2012;
Benton
et
al., 2015
; Niko
l
skiy
et al
.
,
2015).
However
,
there
exist several challenges: for example,
putative identifications
can
be interfered by isomers
comparison of
MS
/
MS
spectra
can be hindered by
low-quality data.
To overcome
these difficulties
,
sample
analysis
can
be
employed
by
isomer-sensitive
chromatographie separation approaches
include
HILIC or
porous
graphitized carbon (PGC) coupled with
tandem mass
spectrometry
using
high-resolution
mass
analyzers such as FT-ICR,
ReTOF
or
Orbitrap
(Wuhrer
et
al
.
,
2004;
Pabst
et
al.
,
2007
; Tousi
et
al.
,
2013).
In
arder
to
obtain
high-quality MS
/
MS
spectra,
product ion
scans,
also
termed
targeted
MS
/
MS
,
can be performed
instead of
information dependent
acquisition (IDA) (Andrews
et al
.
,
2011).
This
method
will
be
used and
widely
discussed in
Chapter 2
and
Chapter 3.
Nevertheless
,
the limited
availability of authentic
chemical
standards and coverage of
databases
are still
the
CHAPTER
TWO
METHOD DEVELOPMENT
Metabolite
extraction
is crucial to the
global
metabolic profiling of
yeast.
In
this
chapter
,
an
optimized work:flow was
developed to
extract
intercellular
metabolites
from yeast
pellets
,
using
50%
MeOH
as extraction solvent
,
and
pre-rinsing the
glass
beads
(0.1
mm) as
well as
bead-beating lx for 60s
at
medium
speed
,
and
then drying the metabolite
extracts
under nitrogen
(N2).This sample
preparation procedure
yielded
higher metabolome coverage
and
2.1 EXPERIMENTAL
2.1.1 Materials
Eight
S.
cerevisiae strains, including BY4743, JRY222, BY4743+
URAJ
(BYU), BY4743
+
LEU2
(BYL), BY4743+
HISJ
(BYH), JRY222 -URAJ
(JRU),JRY222 -
LEU2
(JRL) and JRY222 -HISJ
(JRH), were provided by the HipHopchemical genomics lab (University of British Columbia, BC, Canada). Glass beads
(0.1 mm diameter) were obtained from Bertin Technologies (France). L- Tyrosine-13C9, 15N (>98 atom% 13C, >98 atom% 15N), L-phenyl-13C6-alanine (>99 atom%
13 C)
and anthranilic acid-ring- 13C6 (>99 atom%
13
C) were from Sigma-Aldrich (St. Louis,
MO) and used as internal standards for data normalization. HPLC-grade solvents
were purchased from EMD Chemicals (Gibbstown, NJ). Nanopure water was
prepared using a Millipore Synergy UV system (Billerica,MA).
2.1.2 Method Optimization
Two metabolite extraction methods, vortex and bead-beating, were compared.
Extraction sol vents were evaluated among MeOH, EtOH and IP A. In order to reduce the impurities, pre-rising tubes and beads were investigated. For bead-beating, two
diameters of glass beads (0.1 mm and 0.5 mm), frequency, and time as well as speed
were examined. Sample drying methods, SpeedVac (ThermoFisher Scientific
22
2.1.3 RP-UHPLC-HRMS/MS Analysis
Samples were injected onto a BetaBasic™ C18 (150 x 2.1 mm, 3 ).lm; Thermo
Scientific, Waltham, MA) and an ACQUITY UPLC® HSS T3 colurnn (1 00 x 2.1
mm, 1.8 ~-tm; Waters, Milford, MA) as weil as a Luna PFP (2) (150 x 2.0 rnn1, 3 j.lm;
Phenomenex, Torrance, CA) column, respectively, using a Nexera UHPLC system
(Shimadzu, Columbia, MD). Mobile phases for BetaBasic ™ C18 column were water
(A) and MeOH (B), both containing 0.1% formic acid, at a flow rate of 300 ~-tLimin
(40°C). The gradient started at 3% Band was linearly increased to 50% Bat 15 min,
then to 90% B at 20 min, held until 25 min. Mobile phases for HSS T3 and PFP
colurnns were water (A) and acetonitrile (ACN) (B), both containing 0.1% formic
acid. The gradient for HSS T3 colurnn had a 1.0 min hold at 1% B, followed by a
linear increase to 30% B at 8 min, to 75% Bat 13 min, and then with a sharp increase
to 90% B until 13.5 min, and then held for another 1.5 min, at 450 ~-tLimin and
column temperature of 60°C. The gradient for PFP column started at 3% for 1.5 min,
th en to 85% at 15 min, held un til 17 min. The flow rate was 3 00 ~-tL! min at 40°C. MS
and MS/MS spectra were collected on a hybrid quadrupole-time-of-flight (QqTOF)
TripleTOF 5600 mass spectrometer (AB Sciex, Concord, ON, Canada) equipped with
a DuoS pray ion source set at source voltage of 5 and -4.5 kV in positive and negative modes, respective! y, 450°C source temperature, and 50 psi for GS 1/GS2 gas flows,
with a declustering potential of 80 V for BetaBasic TM C18 and HSS T3 method, and
60 V for PFP method. The instrument performed a survey TOF MS acquisition from
m/z 80-975, followed by MS/MS on the 4 most intense precursor ions from m/z
50-850 using information-dependent acquisition (IDA) with dynamic background
subtraction (DBS). Each MS/MS acquisition had a collision energy of 30 ± lü V and
2.1.4 Data Processing
MetabolitePilot™ (version 1.5) and MarkerView™ (version 1.2.1) software were used to generate peak lists from raw data sets with a signal ratio of sample-
to-blank > 1
O.
For the optimization of metabolite extraction method, monoisotopic peaksfrom MarkerView™ were searched against METLIN within 10 ppm to find the
tentative metabolite hits which were then integrated by MultiQuant™ (version 2.1.1)
software. For the chromatographie separations, MassBox software (Golizeh et al., 20 15) was used to eliminate redundancies from the peak lists using a
m
/
z window of
±0.01 and a retention time window of ±0.2 min. Non-redundant peaks were searched against the METLIN within 10 ppm, and then were used to perform overlap analysis
by Venn diagram (Oliveros, 2007).
2.2 RESULTS AND DISCUSSION
2.2.1 Comparison of Diameters of Glass Beads
The bead diameter is an important parameter in obtaining a reproducible of
bead mixture. In this experiment, two diameters of glass beads were tested. The results showed that 0.1 mm glass beads were pipetted more precisely than 0.5 mm
24
2.2.2 Comparison of Extraction Sol vents
Background
signais
from organic
solvents are
comrnonly detected in LC-MS
spectra.
In order to
achieve
relatively low background, three widely used
solvents,
75%
IPA
,
75%
EtOH
and 50% MeOH
, were
tested
and
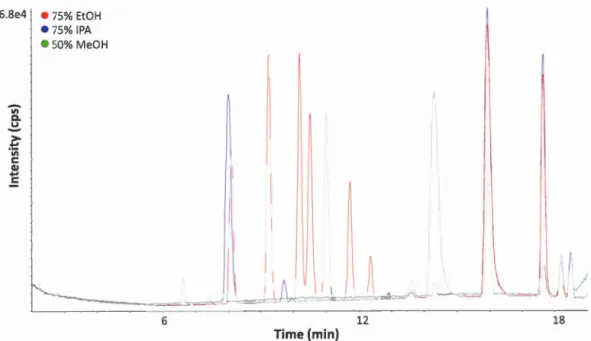
compared. Figure 2.1 illustrates
the base peak chromatogram
(BPC)
of these three tested
solvents
,
of
which
50%
MeOH
showed
the lowest background.
6.8e4 e 75% EtOH
e75% IPA
e5o% MeOH
---
6 12 18Time (min)
Figure 2.1
Representative BPC
(overlaid)
of 75% IPA
,
75%
EtOH
and 50% MeOH
2.2.3 Comparison of Pre-rinsing Tubes and Glass Beads
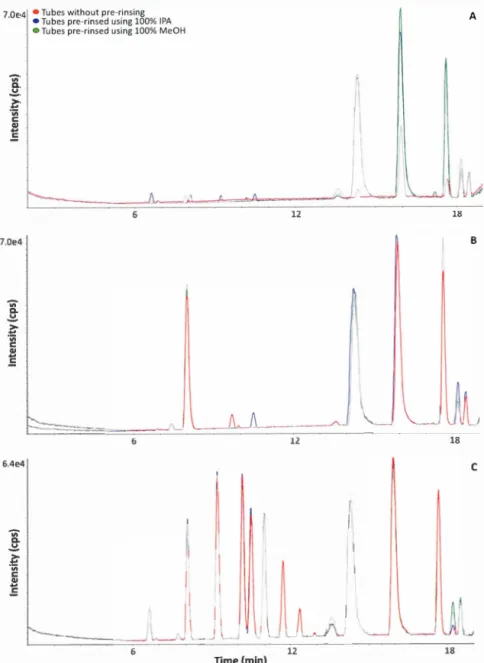
1 00% MeOH and 100% IPA were employed to pre-rinse tubes using 75% IPA,
75% EtOH and 50% MeOH as extraction solvents, respectively. However,
pre-rinsing tubes didn't reduce the background signais in LC-MS spectra. Furthermore,
compared to non-rinsing, sorne extra peaks were found due to rinsing with 100%
organic solvents (IPA and MeOH) in tubes. This is probably because sorne impurities
or plasticizers were extracted from polypropylene tubes, hence reducing the positive
7 Oe4 • Tubes without pre-rlnsing · • Tubes pre-rinsed using 100% IPA
7.0e4 "' c. ~ ·~ 1: 2l 1: 6.4e4
e Tubes pre-rinsed using 100% MeOH
1
i\
-
-
"'----~'---·
12 12 Time(min){\
1 1\ Il A B c 1L
26Figure 2.2 Representative BPC ( overlaid) of non-rinsing, pre-rinsing tubes by 100%
IPA or 100% MeOH using 75% IPA (A), 75% EtOH (B) or 50% MeOH (C) as
To redu ce the negative effects of 100% organic sol vent on rinsing, beads were pre-rinsed using 50% MeOH, and then were employed to perform bead-beating by bead ruptor (Omni international, Kennesaw, GA) using 50% MeOH, 100% MeOH
and 75% IP A as extraction solvents, respectively. The results demonstrated that the intensities of the peaks due to beads were reduced by rinsing. However, pre-rinsing both beads and tubes resulted in higher intensities than pre-rinsing beads alone
(Figure 2.3). Thus, in this study, pre-rinsing beads was necessary but pre-rinsing
tubes wasn 't. The impurities detected in MS spectra (peak 1 and peak 2 in Figure 2.4)
probably due to plasticizers that came from tubes or bags where beads are stored.
Peak 1 and peak 2 (Figure 2.4) were classified as phthalate-derived compounds based
65 e4 • • No beads Beads without pre-rinsing -;;;-a. ~ > .... ïii c:: QI ]; 5.5e4 -;;;-a. ~
:::
ïii c:: QI ....-=
l.OSeS "' a. ~ > .... ·;:;; c:: QI .... c:: 0 Beads pre-rinsed by 50% Me OH• Beads and tubes pre-rinsed by 50% MeOH 6 6 6 28 A 2 12 B 2 12 18 c 2 Time(min) 12 18
Figure 2.3 Representative BPC ( overlaid) of no beads, beads without pre-rinsing,
beads pre-rinsed by 50% MeOH, or both beads and tubes pre-rinsed by 50% MeOH,
using 75% IPA (A), 100% MeOH (B) or 50% MeOH (C) as extraction solvents for
1.6e4 > ·~ 84.9607 s::::: QI
...
s::::: 9.0e4 Vi Q, ~ > .~"'
s::::: QI...
s::::: 100 84.9606 100 149.0234 200 300 149.0232 245.0785 261.0434 ,1lJ
1lt
200 300 Peak 1 400 500 600 700 800 900 Peak 2 1 1 1 400 500 600 700 800 900m/z
Figure 2.4 Representative MS spectra of peak 1 and peak 2 for BetaBasic
™
C1830
2.2.4 Comparison of Metabolite Extraction Methods, and Sample Drying Methods
A great variety of metabolite extraction methods have been reported, which will be discussed in more details in Chapter 3. In this study, intracellular metabolites were extracted from representative yeast samples by vertex or bead-beating using pre-rinsed glass beads with 50% MeOH. Bead-beating (bb) was performed one time
(1 x) and two times (2 x) at medium speed for 45 seconds using 50% MeOH and 80% MeOH as extraction solvents, respectively. Figure 2.5 illustrates that bead-beating 1 x using 50% MeOH as extraction solvent yielded the highest average normalized values of metabolite peak areas.
200 200
....
0 "'j
.,=
.... ;>~ 150 150 ~ -=~ ~ (1) ·- "' - ., "' ... 100 100 ë "' '--"' 0 "'=
.,
., c.""
"' 50 50 ... ., ~ 0 1 0 2 4 5 6 2 3 4 51: 50% MeOH (vortex) 3: 50% MeOH (bb, 1 x 45 s, medium speed) 5: 50% MeOH (bb, 2 x 45 s, medium speed)
2: 80% MeOl-1 (vortex) 4: 80% MeOH (bb, 1 x 45 s, medium speed) 6: 80% MeOH (bb, 2 x 45 s, medium speed)
6
Figure 2.5 Comparison of metabolite extraction methods and solvents for BetaBasic TM C18 column in positive (left) and negative modes (right)
In order to maxumze the efficiency, metabolite extraction was carried out twice in the following experiments using 50% MeOH, or 50% and 80% MeOH separately as extraction solvents. In general, the results between them didn't show big
differences (Figure 2.6). Considering higher percentage of MeOH could increase
sorne noisy peaks' intensities in the previous investigation (Figure 2.2), thus 50%
MeOH was chosen as extraction solvent for this study.
...
0 "'..,
-=
«: ;..,.-.. ~ "1:1~..,
"' ~ «:..,
«:...
s
«: '"'..:0: 0 «: c .., .., Q. b!l «:...
..,
~ 200 ISO 100 50 0 2 200 ISO 100 50 0 1: 50%-50% MeOH 2: 50%-80% MeOH 2Figure 2.6 Comparison of metabolite extraction solvents by bead-beating for 60
seconds at medium speed for BetaBasic TM C18 colurnn in positive (left) and negative
mode (right)
The key features of biological sample drying are avoiding degradation and
introduction of impurities in a relatively rapid procedure. In this study, metabolite
extracts were evaporated to dryness in a SpeedVac or under N2. Figure 2.7 illustrates
that for BetaBasic TM C18 or HSS T3 columns in both positive and negative modes, the
dryness of metabolite extracts obtained by bead-beating at medium speed (2450 rpm),
in the SpeedVac achieved the best results based on the average normalized values of
peak areas of metabolites. However, considering dryness in the SpeedVac took a
32
Bead-beating at medium speed was better than at high speed
(31
00
rpm) according tothe results of dryness under N2, however they didn't show big differences.
200 A 200 B
....
0 "'"'
= -; 150 150 ... ~ ;g_ -=~ -~ ;-"'
"'
... ë "' 100 100 ... ~ 0 "'=
"'
"' Q.. eJl"'
...
50 50..
~ 0 0 2 3 2 3 200c
200 D....
0 "' c.>-=
"'
... ~ 150 150 ;g_ -=~ ~ ~ 100j
·
-
-
"'
..
"'
... 100 ë "' '-..:0: 0 "'=
..
"' Q.. eJl"'
50 ..."'
;;.. -<( 0 0 2 3 2 3 1: SpeedVac (bb at medium speed) 2: N2 (bb at medium speed) 3: N2 (bb at high speed)Figure 2.7 Comparison of sample drying methods for BetaBasic
™
C1s colurnn inpositive (A) and negative mode (B), and HSS T3 column in positive (C) and negative
2.2.5 Optimized Sample Preparation Worktlow
Taken together, sample preparation worktlow was optimized (Figure 2.8), using 0.1 mm glass beads pre-rinsed by 50% MeOH to perform bead-beating in order to extract intercellular metabolites from yeast pellets. Bead-beating was carried out lx for 60s at medium speed with 50% MeOH as extraction solvent. Metabolite extracts were dried under
N2
and reconstituted in 10% MeOH prior to RP-UHPLC-HRMS/MS analysis.Ycast pellets MeOH 100 ~L 80
o
c
Internai standards mix 0.1 mm glass beads (0.25 g) Bead-beating 60s, medium speed
(50 ~L) 50% MeOH 500 ~L
Remove supematant (500 ~1)
Centrifugation
~-14,800 rpm, 4 min ~ Bead-beatin~ Rem ove supematant ( 400 ~L) 50% MeOH & spin
Evaporation Recon in 100 ~L (N2) 10% MeOI-1
1
RP-LC-MS/MSFigure 2.8 Scheme of optimized sample preparation worktlow
2.2.6 Comparison ofThree Chromatography Columns
In order to maxim ize the metabolome coverage of yeast, which can't be fully achieved by any analytical methods as described in Chapter 1, three columns including BetaBasic TM C18, HSS T3 and PFP were compared. Figure 2.9 illustrates the
total ion chromatograms (TIC) for these three columns in both positive and negative modes. Three internai standards, L-tyrosine-1 3C9, 1 5N, L-phenyl-1 3C6-alanine and anthranilic acid-ring-13C6, were used for normalization. Extracted ion chromatograms
34
of them (overlaid) for HSS T3 columns in negative mode showed good resolution and
peak shapes (Figure 2.1 0). Table 2.1 lists the information of these three internai
standards for HSS T3 colurnn in negative mode.
6.0e6 BetaBasicTM C 18 (+) 5.5e6 BetaBasicTM C 18 (-) "' a. ~ :: ·;;; r::: ~ .: 10 15 10 15 5.0e6 HSS T3 (+) 5.0e6 HSS T3 (-) "' a. ~ :: ·;;; r::: "' .Ë 10 10 15 8.0e6 PFP (+) 6.0e6 PFP (-) "' a. ~ ·~ r::: ~ .: 5 Time(min) 10 15 10 15
Figure 2.9 Total ion chromatograms for BetaBasic
™
C18, HSS T3 and PFP columns"' a. ..!:. > .... 'iii r:: QI .... r:: 2.0 4 '0 Time (min) G.O • 13C9, 15N-tyrosine • 13Cçphenylalanine • 13Cçanthranilic a cid 8.0 10.0
Figure 2.10 Representative extracted ion chromatogram of three internai standards (overlaid) for HSS T3 colurnn in negative mode
Talbe 2.1 Information of three internai standards for HSS T3 colurnn in negative mode
IS name RT (min) Mode Calculated Measured ppm
mlz mlz
C9, N-tyrosme 1.4 negative 190.0938 190.0939 0.6 3.3 negative 170.0918 170.0920 0.9 13
C6-anthranilic acid 6.0 negative 142.0605 142.0608 1.6
From colurnn comparison, HSS T3 colurnn in positive mode (+) and PFP
colurnn in negative mode(-) showed best metabolome coverage (nurnber ofMETLIN
hits) with complementary results (Figure 2.11 ). MarkerView™ agreed with
MetabolitePilot™ according to the overlap of non-redundant features between them
(Table 2.2). More overlap of non-redundant features was found between three tested
1800 VI .~ 1600 ~
~
1400 1-LU ~ 1200....
0 1000 VI QI....
::J 800...
Ill ~ 600-
0 Qj 400 ..0E
::Jz
200 0 C18 (+) HSS T3 (+) 36 • MV features• METLIN hits from MV features
• MP features
• METLIN hits from MP features
PFP (+) C18 (-) HSS T3 (-) PFP (-)
Figure 2.11 Number of non-redundant features from MarkerView™ and MetabolitePilot™, and their METLIN hits for BetaBasic TM C18, HSS T3 and PFP
colunms in both positive and negative modes
Table 2.2 Overlap of non-redundant features between MarkerView™ and MetabolitePilot™ for BetaBasic
™
C18, HSS T3 and PFP columns in both positiveand negative modes
Column Mode Overlap
CYo)
ill
e a asie 18 pOSI IVe
B tB