BIOINFORMATICS
APPLICATIONS NOTE
Vol. 25 no. 5 2009, pages 682–683doi:10.1093/bioinformatics/btp005Systems biology
Prequips—an extensible software platform for integration,
visualization and analysis of LC-MS/MS proteomics data
Nils Gehlenborg
1
,2,3
, Wei Yan
1
, Inyoul Y. Lee
1
, Hyuntae Yoo
1
, Kay Nieselt
2
,
Daehee Hwang
1
,4,5,∗
, Ruedi Aebersold
1
,6
and Leroy Hood
1
1
Institute for Systems Biology, Seattle, USA,
2Center for Bioinformatics Tübingen, University of Tübingen, Tübingen,
Germany,
3European Bioinformatics Institute, Wellcome Trust Genome Campus, Cambridge, UK,
4I-Bio Program,
5
Department of Chemical Engineering, POSTECH, Pohang, Republic of Korea and
6Institute for Molecular Systems
Biology, ETH and Faculty of Natural Science, University of Zürich, Zürich, Switzerland
Received on October 19, 2008; revised on December 18, 2008; accepted on December 30, 2008 Advance Access publication January 6, 2009
Associate Editor: John Quackenbush
ABSTRACT
Summary: We describe an integrative software platform, Prequips,
for comparative proteomics-based systems biology analysis that: (i) integrates all information generated from mass spectrometry (MS)-based proteomics as well as from basic proteomics data analysis tools, (ii) visualizes such information for various proteomic analyses via graphical interfaces and (iii) links peptide and protein abundances to external tools often used in systems biology studies.
Availability: http://prequips.sourceforge.net Contact: [email protected]
1
INTRODUCTION
Recently, liquid chromatography (LC) coupled tandem MS-based
proteomics technologies have been extensively used in systems
biology studies. The improved reliability and widespread use of
such LC-MS/MS approaches have led to huge amounts of large
datasets together with a growing number of software tools for
diverse analyses of MS data (Trans-Proteomic Pipeline (TPP), Keller
et al., 2005). Despite such software tools, effective integration,
visualization and analysis of MS data for systems biology
investigations are still complicated due to lack of (i) integration of
diverse data types from different MS platforms and analytical output
data types from various software tools—MS
nspectra, peptides
(sequences, search outputs, abundances and modifications) and
proteins (coverage, abundances, modifications and significances),
(ii) effective visualization of such complex integrated data for
various analyses of MS data to examine characteristics and quality
of data and optimize experimental conditions in comparative
proteomics and (iii) automatic exchanges of such integrated
information with software used in systems biology. The first problem
is still challenging due to the complex relationships among data
from multiple samples, despite several tools having been developed
for MS data analysis (e.g. TPP). There is still a lack of tools
for visualizing information from multiple samples to facilitate
various analyses in comparative proteomics. Pep3D (Li et al., 2004)
resolved the second problem in part, especially for a single sample.
∗To whom correspondence should be addressed.
Moreover, only few tools with limited functionalities to resolve
the third problem have been introduced. Therefore, there has been
a need for a computational framework providing functionalities
for (i) integration of complex MS data, (ii) visualization of the
complex data using spectrum/chromatogram and tabular viewers,
peptide feature maps and (iii) network modeling and analysis (e.g.
Cytoscape and its plug-ins) and statistical analyses such as data
normalization, identification of differentially expressed proteins,
functional enrichment analyses and classification/clustering. Here,
we present Prequips, a Java-based workbench of computational tools
efficiently achieving these three tasks.
2
METHODS AND FEATURES
Prequips provides the following three key features. To demonstrate the features in Prequips, we used four datasets obtained from LC-MS/MS analysis of samples to examine changes in sub-cellular localization after chemical treatment.
2.1
Integration of multiple MS data and diverse
proteomic information
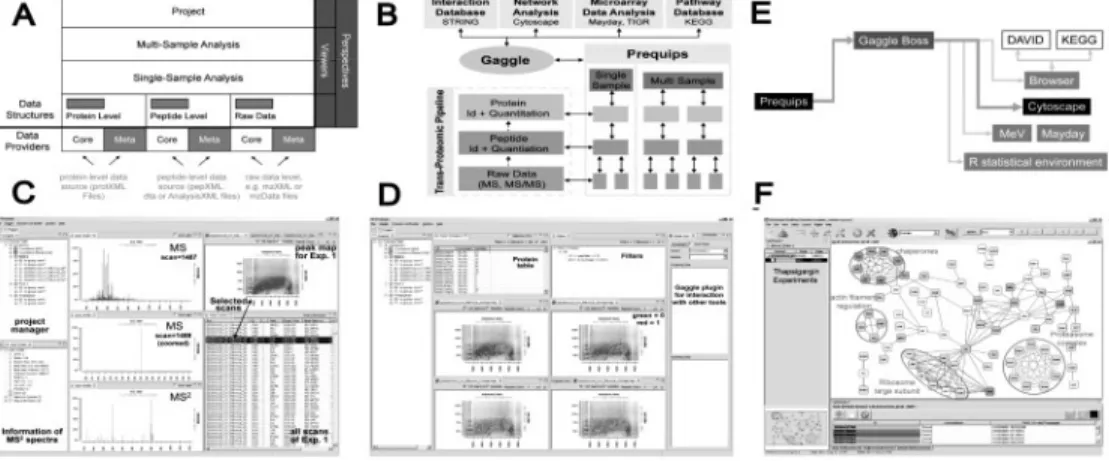
Prequips is built on a generic data model with two main parts, core data and meta information elements obtained from the data sources shown in Figure 1A. Core data refers to key information from MS experiments with hierarchical structure—spectra, peptide sequences and protein IDs (Fig. 1B). Meta information represents data generated by the basic data analysis pipeline (e.g. SEQUEST and TPP) at all stages and in various forms, which describes the core data more closely. Meta data of peptides include DB search outputs (sequences, SEQUEST outputs such as Xcorr, PeptideProphet probabilities; Keller et al., 2002), abundances and modifications, while those of proteins include sequence coverage, abundances, modifications and ProteinProphet probabilities. These core data and meta information are integrated via the data model of Prequips (Fig. 1A). In ‘single sample analysis’, both core and meta data for a single dataset are organized in a data model including spectrum-, peptide- and protein-level information (Fig. 1A). In ‘multi-sample analysis’, the core and meta information for multiple samples can be combined in the data model based on any kinds of unique proteins (Fig. 1B). A vector of values including all spectrum- and peptide-level data and related meta data over all samples can be created for each protein. To effectively load core data and meta information, Prequips employs so-called ‘data providers’, which enhances data integration capabilities (Fig. 1A). Data providers, designed in plug-in interfaces, separate Prequips
Prequips—an extensible software platform
Fig. 1. Overview of Prequips’ design and functionality. (A) Data model structure. (B) Schematics of data structure and exchange. (C) Spectrum, peptide
feature map and table viewers in single sample analysis. (D) Peptide feature maps in multi-sample analysis. (E) Broadcasting to Cytoscape via the Gaggle interface. (F) Network analysis using broadcasted proteins in Cytoscape.
from the data sources (e.g. mzXML, pepXML and protXML; Fig. 1A) and make the software independent of data formats.
2.2
Visualization of integrated core data and meta
information
Prequips supports interactive data exploration through a graphical user interface (GUI) permitting to efficiently interact with the data through graphical viewers and data filters. Figure 1C shows summary windows, spectrum viewers, peptide feature maps and a tabular viewer showing integrated core and meta information for ‘single sample analysis’: (i) the project manager allows users to select a particular sample (e.g. a chemical-treated sample) or a group of samples (e.g. control samples); (ii) a spectrum summary window showing core and meta information (peak numbers, retention time, etc.) for the MS2 scan being displayed in the spectrum
viewer; (iii) MS/MS2 spectrum viewers; (iv) chromatogram viewers (not shown); and (v) peptide feature map. Note that the data being displayed are all connected across the viewers through the integration of core and meta information in the data model (see the linked selection in Fig. 1C). Also, a sophisticated filtering framework has been implemented in Prequips, based on Boolean operators AND, OR and XOR (exclusive-or), by which a group of objects can be selected using multiple data filters. For instance, users can select peptides whose PeptideProphet probabilities are larger than 0.95. Once those peptides were selected in the tabular viewer, the corresponding peptides and scans are highlighted in the other viewers. Prequips enables users to open a virtually arbitrary number of viewers to investigate the data based on the Model-View-Controller architecture. Figure 1D shows four peptide feature map viewers from four MS datasets, as an example of a ‘multi-sample analysis’. Exploring multiple MS datasets using the viewers and data filters assist users to examine characteristics and quality of data, thus aiding optimizing experimental conditions to improve particular aspects of results (e.g. increase the detected proteome size).
2.3
Mapping proteomic information into systems
biology tools
Besides data integration and visualization tools for data exploration, Prequips also provides extensive support for systems biology analyses of MS-based proteomic data. Prequips employs the Gaggle (Shannon et al., 2006) to exchange core and meta data of interest (e.g. a list of proteins detected from multiple experiments) with external software tools (Fig. 1B) being used for network analysis (Cytoscape, Biotapestry and String) and statistical analyses (TIGR MeV; Saeed et al., 2003). Prequips is able to broadcast both lists of names and matrices via the Gaggle plug-in. Figure 1E schematically shows
broadcasting protein IDs from Prequips to Cytoscape via the Gaggle. As shown in Figure 1F, we can reconstruct a network model for the broadcasted proteins using protein–protein interactions obtained by Cytoscape plug-ins. The network shows cellular processes (see circled network modules) enriched by the proteins whose sub-cellular locations were changed after the chemical treatment. The Gaggle in Prequips also passes protein IDs via Firefox to web-based tools (DAVID) for functional enrichment analysis and also to R-package as inputs to R-scripts for sophisticated analyses.
3
IMPLEMENTATION
Prequips is open-source software implemented in Java based on
the Eclipse Rich Client Platform and released under the GNU
GPL. The modularity of Prequips enables third party developers
to adapt it into their specific software environment or add their
own functionalities to Prequips as plug-ins (e.g. the Inclusion List
Builder; Schmidt et al., 2008). The use of Java renders the software
platform-independent. To efficiently handle large datasets, the data
providers were designed to dynamically load data from data sources
into memory: Prequips could load a 589 MB mzXML in 1.5 min on
an iMac with 2.16 GHz and 2 GB RAM.
Conflict of Interest: none declared.
Funding: GAES (grant 0321,
DAMD17-03-1-0425); NIH (grant NS41997); NHLBI (grant N01-HV-28179); DOD
(grant DAMD17-3-1-0321); Korean MEST (grant FPR08A1-050,
SC-2120); BioGreen21 (grant 20080401-034-041-008-02-00).
REFERENCES
Keller,A. et al. (2002) Empirical statistical model to estimate the accuracy of peptide identifications made by MS/MS and database search. Anal. Chem., 74, 5383–5392. Keller,A. et al. (2005) A uniform proteomics MS/MS analysis platform utilizing open
XML formats. Mol. Syst. Biol., 1, 1–8.
Li,X.-J. et al. (2004) A tool to visualize and evaluate data obtained by liquid chromatography-electrospray ionization-mass spectroscopy. Anal. Chem., 76, 3856–3860.
Saeed,A. et al. (2003) TM4: a free, open-source system for microarray data management and analysis. Biotechniques, 34, 374–378.
Shannon,P.T. et al. (2006) The gaggle: an open-source software system for integrating bioinformatics software and data sources. BMC Bioinformatics, 7, 176. Schmidt,A. et al. (2008) An integrated, directed mass spectrometric approach for
in-depth characterization of complex peptide mixtures. Mol. Cell. Proteomics, 7, 2138–2150.