ORIGINAL PAPER
Simultaneous quantification of ten cytotoxic drugs
by a validated LC
–ESI–MS/MS method
Susanne Nussbaumer&Sandrine Fleury-Souverain&Paola Antinori&
Farshid Sadeghipour&Denis F. Hochstrasser&Pascal Bonnabry&Jean-Luc Veuthey&
Laurent Geiser
Received: 6 August 2010 / Revised: 20 September 2010 / Accepted: 21 September 2010 / Published online: 7 October 2010 # Springer-Verlag 2010
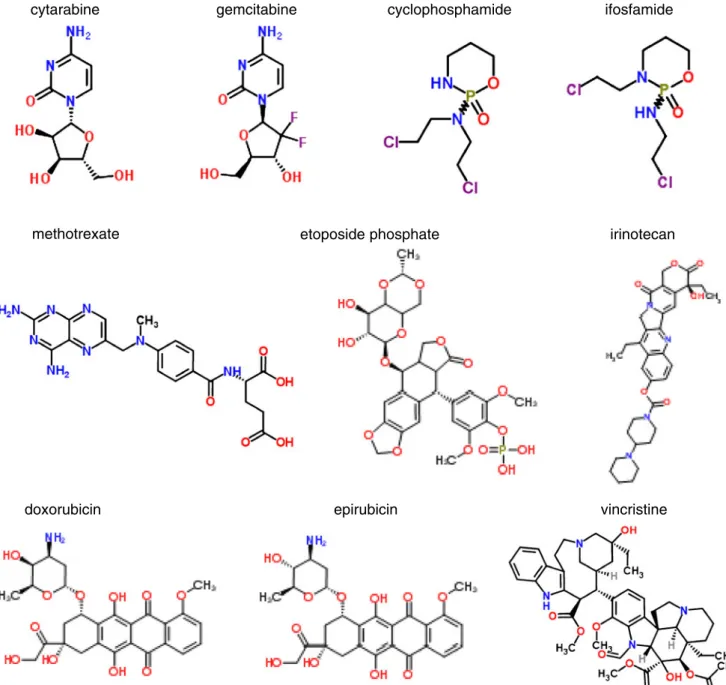
Abstract A liquid chromatography separation with electro-spray ionisation and tandem mass spectrometry detection method was developed for the simultaneous quantification of ten commonly handled cytotoxic drugs in a hospital pharmacy. These cytotoxic drugs are cytarabine, gemcita-bine, methotrexate, etoposide phosphate, cyclophospha-mide, ifosfacyclophospha-mide, irinotecan, doxorubicin, epirubicin and vincristine. The chromatographic separation was carried out by RPLC in less than 21 min, applying a gradient elution of water and acetonitrile in the presence of 0.1% formic acid. MS/MS was performed on a triple quadrupole in selected reaction monitoring mode. The analytical method was validated to determine the limit of quantification (LOQ) and quantitative performance: lowest LOQs were between
0.25 and 2 ng mL−1 for the ten investigated cytotoxic
drugs; trueness values (i.e. recovery) were between 85% and 110%, and relative standard deviations for both repeatability and intermediate precision were always infe-rior to 15%. The multi-compound method was successfully
applied for the quality control of pharmaceutical formula-tions and for analyses of spiked samples on potentially contaminated surfaces.
Keywords Cytotoxic . Antineoplastic drugs . LC–MS/MS .
Pharmaceutical formulation . SRM . Validation
Introduction
During the last decades, the number of patients receiving anticancer chemotherapy treatments based on cytotoxic drugs has steadily increased. Simple analytical methods are thus required in different pharmaceutical fields, such as quality control or environmental monitoring. Different methods have already been published such as simple flow injection analysis and high-performance liquid chromatog-raphy (HPLC)-UV/Vis assays for cytotoxic drugs by Delmas et al. for quality control of cytotoxic preparations
in a centralised parenteral preparation unit [1] or
simulta-neous determination of three anthracycline drugs (doxoru-bicin, daunorubicin and idarubicin) in serum samples by capillary electrophoresis (CE) with laser-induced fluores-cence by Pérez-Ruiz et al. for therapeutic drug monitoring
[2]. Due to their toxicity, the analysis of cytotoxic drugs is
also useful for environmental monitoring and control of cytotoxic traces in wastewater. As an example, a CE-DAD method for the quantification of 5-fluorouracil in
wastewa-ter of hospital effluents was published by Mahnik et al. [3].
Despite safety standards for handling cytotoxic agents, it has been shown that health care professionals are still exposed to these toxic compounds. For instance, several studies reported low-level contamination of these compounds on
workbenches, floors, vials, gloves and isolators [4–12].
S. Nussbaumer
:
S. Fleury-Souverain:
F. Sadeghipour:
P. BonnabryPharmacy, Geneva University Hospitals (HUG), 1211 Geneva, Switzerland
S. Nussbaumer
:
D. F. Hochstrasser:
P. Bonnabry:
J.-L. Veuthey School of Pharmaceutical Sciences, University of Geneva, University of Lausanne,1211 Geneva 4, Switzerland
S. Nussbaumer
:
P. Antinori:
D. F. Hochstrasser:
J.-L. Veuthey:
L. Geiser (*)Swiss Centre for Applied Human Toxicology (SCAHT), 1211 Geneva, Switzerland
e-mail: [email protected] DOI 10.1007/s00216-010-4243-1
Moreover, cytotoxic traces have been found in urine of health
care professionals [12–15]. Rapid, reliable and validated
analytical methods are thus needed for the safety of the operator handling these hazardous drugs and to reduce the
exposure at the lowest possible level [16]. A review about
analytical methods used for biological and environmental monitoring of hospital personnel exposed to antineoplastic
agents was published by Turci et al. [17]. Different
instrumental techniques were used depending on the studied analyte. Most of the presented studies used a specific method for the determination of a single cytotoxic drug. For example, a very sensitive voltammetry for platinum drugs,
as well as GC–MS methods for the quantification of cyclophosphamide, ifosfamide and fluorouracil, was devel-oped by Schmaus et al. for environmental and biological
monitoring [18]. These methods presented very good
quantitative performance and detection limits (i.e. 0.1 to 1 pg per sample) and are thus ideal for establishing target guideline values for cytotoxic contamination or for selecting a single compound as a model marker for potential contaminations. On the other hand, such methods are time consuming and not very cost-effective to get an overview of several cytotoxic contaminations. For the latter, multi-compound methods are required. Different approaches have
gemcitabine
cytarabine cyclophosphamide ifosfamide
methotrexate etoposide phosphate irinotecan
epirubicin
doxorubicin vincristine
been developed using liquid chromatography–tandem mass spectrometry (LC–MS/MS) for the simultaneous determination of gemcitabine, taxol, cyclophosphamide and ifosfamide by
Sottani et al. [19] and for cyclophosphamide, methotrexate and
5-fluorouracil for surface contamination by Sabatini et al. [11].
However, to our knowledge, there is still a lack of simple validated methods for the simultaneous determination of different cytotoxic agents. For drug treatment monitoring or quality control of pharmaceutical formulations, single-compound strategies are often sufficient, but generic multi-compound methods allow simplifying the control. In addition, multi-compound methods are mandatory for environmental analyses. The aim of this work was to develop and validate a simple and sensitive LC–MS/MS method for the simultaneous quantitative determination of ten cytotoxic drugs contained in aqueous samples.
Experimental
Chemicals and reagents
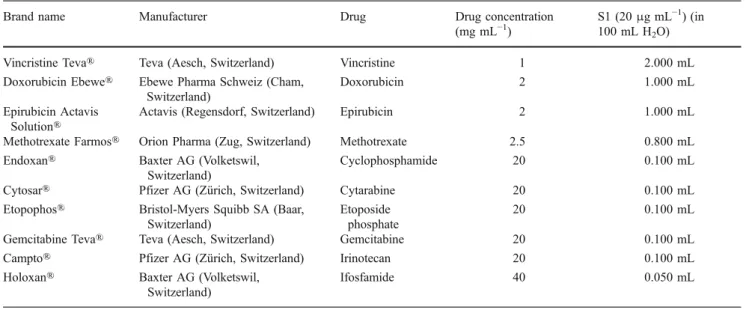
The study was performed with the following commercially
available cytotoxic drugs (see Fig.1 for their structure and
Table1): Campto® (irinotecan, 20 mg mL−1) and Cytosar®
(cytarabine, 20 mg mL−1) were purchased from Pfizer AG
(Zürich, Switzerland), gemcitabine Teva® (gemcitabine
reconstituted in water at 20 mg mL−1) and vincristine
Teva® (vincristine 1 mg mL−1) from Teva Pharm AG
(Aesch, Switzerland), Holoxan® (ifosfamide reconstituted
in water at 40 mg mL−1) and Endoxan® (cyclophosphamide
reconstituted in glucose 5% at 20 mg mL−1) from Baxter
AG (Volketswil, Switzerland), methotrexate Farmos®
(methotrexate 2.5 mg mL−1) from Orion Pharma (Zug,
Switzerland), Etopophos® (etoposide phosphate
reconsti-tuted in water at 20 mg mL−1) from Bristol-Myers Squibb
SA (Baar, Switzerland), Doxorubine Ebewe® (doxorubicin
2 mg mL−1) from Ebewe Pharma (Cham, Switzerland) and
Epirubicin Actavis Solution® (epirubicin 2 mg mL−1) from
Actavis (Regensdorf, Switzerland).
The reconstitution of Etopophos, Gemcitabine Teva and Holoxan was done with water for injectables, obtained from Bichsel Laboratories (Interlaken, Switzerland); glucose 5% for the reconstitution of Endoxan was from Sintetica-Bioren SA
(Couvet, Switzerland). The internal standard (IS) [13C, 2H3
]-methotrexate was purchased from Alsachim (Illkirch, France). Equipment
Analyses were carried out with a high-performance liquid chromatography system Accela from Thermo Fisher Scien-Table 1 Preparation of cytotoxic stock solutions
Brand name Manufacturer Drug Drug concentration
(mg mL−1)
S1 (20μg mL−1) (in 100 mL H2O)
Vincristine Teva® Teva (Aesch, Switzerland) Vincristine 1 2.000 mL
Doxorubicin Ebewe® Ebewe Pharma Schweiz (Cham, Switzerland)
Doxorubicin 2 1.000 mL
Epirubicin Actavis Solution®
Actavis (Regensdorf, Switzerland) Epirubicin 2 1.000 mL
Methotrexate Farmos® Orion Pharma (Zug, Switzerland) Methotrexate 2.5 0.800 mL
Endoxan® Baxter AG (Volketswil,
Switzerland)
Cyclophosphamide 20 0.100 mL
Cytosar® Pfizer AG (Zürich, Switzerland) Cytarabine 20 0.100 mL
Etopophos® Bristol-Myers Squibb SA (Baar, Switzerland)
Etoposide phosphate
20 0.100 mL
Gemcitabine Teva® Teva (Aesch, Switzerland) Gemcitabine 20 0.100 mL
Campto® Pfizer AG (Zürich, Switzerland) Irinotecan 20 0.100 mL
Holoxan® Baxter AG (Volketswil,
Switzerland)
Ifosfamide 40 0.050 mL
Table 2 Gradient elution programme
Time [min] Solvent A (%) Solvent B (%) Solvent C [%]
0 88 2 10 2.0 88 2 10 2.5 69 21 10 10 69 21 10 13 60 30 10 13.5 40 50 10 15.5 40 50 10 16 88 2 10 21 88 2 10
Mobile phase: A water, B acetonitrile, C formic acid 1% Flow rate of 200μL min−1
tific Inc. (Waltham, MA) consisting of a quaternary pump equipped with an online degasser, an auto-sampler and a solvent platform. The chromatographic system was coupled to a triple quadrupole Quantum Discovery MS from Thermo Fisher Scientific equipped with an ion max electrospray ionisation (ESI) interface and operated with Xcalibur software (Thermo Fisher Scientific).
Separations were done on a ZORBAX SB-C18 RR 2.1× 100 mm 3.5-μm column from Agilent Technologies (Waldbronn, Germany).
Solutions
Mobile-phase solutions
Chromatography was performed using Lichrosolv® HPLC-grade acetonitrile (ACN) and ultrapure water from Merck (Darmstadt, Germany) and formic acid (FA) 99% from Biosolve (Valkenswaard, the Netherlands). The mobile phase constituted of three solutions: ultrapure water (solution A), ACN (solution B) and FA 1% (solution C). Table 3 Instrument method for the LC–MS/MS analysis for ten cytotoxic drugs with [13C,2H3]-methotrexate as internal standard
Time segment (min) Scan event Drug Parent (m/z) Product (m/z) CE (eV) Mean RT (min)
0–2.2 1 Cytarabine 244.0 112.3 15 1.9 2.2–4 2 Gemcitabine 264.7 112.3 20 2.6 4–7 3 Methotrexate 455.2 308.0 20 6.0 4 [13C,2H3] methotrexate 459.2 312.2 20 6.0 7–10 5 Etoposide phosphate 691.0 691.0 15 7.5 10–13 6 Ifosfamide 261.1 92.3, 140.2 20 11.4 154.1, 232.9 Cyclophosphamide 261.1 92.3; 140.2 20 12.2 154.1, 232.9 13–14 7 Irinotecan 587.9 587.3 20 13.7 14–21 8 Doxorubicin 544.6 379.2, 397.1 15 14.8 Epirubicin 544.6 379.2, 397.1 15 15.3 9 Vincristine 413.3 353.2 30 15.2 Fludarabine Bortezomib Vincristine Azacitidine
Ifosfamide Selected drugs
Mitomycine Not analyzed
Docetaxel Oxaliplatine Methotrexate Paclitaxel Epirubicin Cytarabine Doxorubicin Irinotecan Carboplatine Gemcitabine Etoposide phosphate Cyclophosphamide Cisplatine Fluorouracil 0 200 400 600 800 1000 1200 1400
Number of preparation per year
Fig. 2 Overview of the 20 most prepared cytotoxic drugs at the pharmacy of Geneva University Hospitals in 2009. Black back-grounds represent the selected compounds
New solvents were prepared for each series of analysis. Washing of the needle and the injection loop was performed with 5% ACN in water after each injection.
Cytotoxic stock solutions, calibration standards, validation standards and internal standard
The operator prepared all solutions (i.e. drug reconstitutions and sample dilution) in appropriate conditions for handling hazardous compounds as cytotoxic agents. Moreover, the development of the method was performed with drug specialities to avoid direct contact of the operator to cytotoxic powder and to minimise contamination risk by preparing working solutions.
A main stock solution (S1) containing the ten cytotoxic drugs was prepared by diluting each compound in water at a
concentration of 20μg mL−1(see Table1). This solution was
further diluted to obtain two independent intermediate stock
solutions: S2 at 2μg mL−1 and S3 at 200 ng mL−1 in FA
0.1%. The calibration standards and validation standards were prepared by diluting S2 and S3 to 12 concentration
levels in FA 0.1% (0.25–200 ng mL−1). All samples were
immediately stored at 15 °C in the LC auto-sampler and analysed within the day.
Aliquots of the IS, [13C, 2H3]-methotrexate, were
prepared with a mixture of ACN and water (75:25v/v) at
250μg mL−1and stored at−22°C for 6 months. No sample
degradation could be observed. Stock solutions of IS were
regularly diluted at 1 μg mL−1 in water, and they were
stable for at least 2 weeks at 2–8 °C. LC–MS/MS conditions
The mobile-phase flow rate was set at 200μL min−1using
the gradient elution programme described in Table 2. The
thermostated auto-sampler was maintained at 15 °C, and
the injection volume was 25μL.
Positive ESI conditions were capillary temperature set at 325 °C, spray voltage at 4 kV and sheath and auxiliary gas (nitrogen) flow rate at 45 and 2 psi, respectively. MS/MS was acquired in selected reaction monitoring (SRM) mode in Q1 and Q3. The Q2 collision gas (argon) pressure was set at 1.5 mTorr. Determination of Q2 potential settings and MS/MS transitions (Q1 and Q3) was carried out by direct 1.97 100 NL: 5.16E5 244 000 [112 200 112 400] 50 Cytarabine 244.000→ [112.200-112.400] 0 4 8 12 16 20 0 NL: 1 54E4 2.62 100 NL: 1.54E4 264.700 → [112.200-112.400] 0 50 Gemcitabine 6.00 0 4 8 12 16 20 NL: 7.86E5 459 200 [312 100 312 300] 50 100 [13C, 2H 3] Methotrexate (IS) 459.200→→ [312.100-312.300] 4 8 12 16 20 0 6 02 Methotrexate (IS) 8 12 16 20 6.02 100 NL: 1.18E6 455.200 → [307.900-308.100] 0 50 Methotrexate 7 49 0 0 4 8 12 16 20 NL: 2.75E4 7.49 50 100 Etoposide 691.000 → [690.900-691.100] 0 4 8 12 20 0 NL: 1.22E5 261 100 [92 200 92 400 11 35 4 8 12 16 20 Relative Abundance 261.100→ [92.200-92.400; 140.100-140.300; 154.000-154.200; 232 800 233 000] 11.35 12.18 50 100 Ifosfamide Cyclophosphamide 232.800-233.000] 0 4 8 12 16 20 0 13.66 4 8 12 16 20 100 NL: 9.49E5 587 900 [587 200-587 400] 50 50 Irinotecan 587.900→ [587.200 587.400] 0 4 8 12 16 20 0 NL: 1.00E4 544.600 → 15.33 100 Doxorubicin 14.81 [379.100-379.300; 397.000-397.200] 0 50 Doxorubicin Epirubicin 15 26 0 0 4 8 12 16 20 NL: 6.21E4 413.300→ 15.26 100 Vincristine 3 300 [353.100-353.300] 4 8 12 16 20 0 Time (min) 4 8 12 16 20 Fig. 3 LC–MS/MS chromato-gram of a sample containing ten cytotoxic drugs and the internal standard at 50 ng mL−1. Column: ZORBAX SB-C18 RR 2.1×100 mm 3.5μm; flow rate 200μL min−1; gradient condi-tions and scan events are reported in Tables2and3, respectively
infusion of each cytotoxic drug solution at a concentration
of 1μg mL−1diluted in 50:50 of water/methanol with 0.1%
FA. Selected m/z transitions and collision energy for each
analyte are reported in Table3. Seven segments with nine
scan events of data acquisition were programmed in the
positive mode during the entire analytical run (Table3).
Chromatographic data acquisition, peak integration and quantification were performed using the Xcalibur software (ThermoQuest, San Jose, CA, USA).
Method validation
Method validation was performed to estimate quantitative performance of the analytical method. The validation was carried out over three series: each series involved (1) freshly prepared calibration, validation samples and solvents, (2) washing of the column and LC system, (3) LC shutoff, (4) cleaning the capillary and cone of the MS with water and methanol and (5) tuning/calibration of the MS system. Calculations were performed using area ratios
of the ten cytotoxic drugs on the IS ([13C, 2H3
]-methotrexate). There were two independent sample prep-arations (calibration and validation samples) at 12
con-centration levels (0.25–200 ng mL−1) with injections in
triplicate.
Application to cytotoxic formulations and environmental samples
For quality control, cytotoxic drugs were determined in formulations prepared at the Geneva University Hospitals pharmacy. Therefore, formulations were diluted in 0.1% FA
to obtain a final concentration of 200 ng mL−1 with
50 ng mL−1of the IS.
For environmental applications, a standard solution of the ten cytotoxic drugs was spiked over a polypropylene infusion bag (NaCl 0.9% 50 mL) and over a stainless steel
surface (100 cm2) to obtain a concentration of 2.5 ng cm−2.
The spiked area was wiped with a blotting paper (Whatman 903®) and an aqueous solution of IS was added. Then, drugs were extracted from the paper in 5 mL of FA 0.1% in glass vials by ultrasonication for 15 min. The procedure was repeated in triplicate (N=3) for each surface.
Results and discussion Method development
Selection of the cytotoxic agents and internal standard The developed LC–MS/MS method allows the determination of ten cytotoxic drugs, namely cytarabine, gemcitabine,
T able 4 V alidation results for the simultaneous analysis of ten cytotoxic drugs by LC –MS/MS Cytarabine Gemcitabine Methotrexate Etoposide phosphate Ifosfamide Cyclophosphamide Irinotecan Doxorubicin Epirubicin V incristine T rueness (%) 99 –102 96 –109 97 –104 99 –106 98 –101 99 –104 90 –106 86 –103 89 –103 91 –100 Repeatability (%) 1– 31 –51 –21 –31 –81 –41 –42 –10 2– 91 –7 Intermediate precision (%) 1– 42 –91 –21 –72 –82 –53 –10 3– 10 2– 13 1– 10 Limit of detection (ng mL − 1 ) 0.025 0.25 0.01 0.5 0.25 0.25 0.025 0.5 0.5 0.25 Limit of quantification (ng mL − 1 ) 0.25 0.5 0.25 1 1 0.5 1 2 2 1 Linearity range (ng mL − 1 )1 –200 1– 200 1– 200 1– 200 1– 200 1– 200 1– 200 2– 200 2– 200 1– 200 Determination coef ficient (r 2 ) 0.9996 0.9994 0.9997 0.9994 0.9993 0.9990 0.9992 0.9962 0.9976 0.9988 T rueness, repeatability and intermediate precision established at 12 concentration levels ranging from lowest to upper LOQ
methotrexate, etoposide phosphate, cyclophosphamide, ifos-famide, irinotecan, doxorubicin, epirubicin and vincristine. These ten compounds were selected among the 20 most prepared cytotoxic drugs at the pharmacy of the Geneva
University Hospitals (Fig.2). The selection was a
compro-mise between the most prescribed drugs and their toxicity and analytical considerations. For example, 5-fluorouracil, which is the most prepared chemotherapy drug in 2008, was not included because it is not classified as a carcinogen for
humans [20], and a contamination of this compound is less
hazardous for exposed personal. Furthermore, 5-fluorouracil is a very polar compound poorly retained in our analytical conditions. Three platinum compounds (i.e., cisplatin, carboplatin and oxaliplatin) presented a high percentage of prescribed chemotherapies and belong to the most toxic compounds, but they need other detection techniques such as
ICP–MS or voltammetry [17,18,21,22] and were thus not
included in this study. Finally, the ten selected drugs belong to different cytotoxic families with different toxicities, giving an excellent overview of possible contamination.
In order to exclude a cross contamination of the IS, a
deuterated compound was chosen: [13C,2H3]-methotrexate
was used as IS as it exhibited high ESI–MS/MS response and was eluted in the middle retention time window of the ten investigated cytotoxic drugs.
Optimisation of LC–ESI–MS/MS conditions
The described method enables the quantification of ten cytotoxic compounds with a mobile-phase composition of water, acetonitrile and 0.1% formic acid. With the selected
gradient (Table2), vincristine and epirubicin were the only
unresolved cytotoxic drugs but presented different scan events in SRM mode. All other compounds were separated in less than 16 min (21 min including the column reconditioning). A typical chromatogram, obtained from the analysis of a
calibration sample with 50 ng mL−1 of each analyte and
50 ng mL−1of IS in FA 0.1%, is shown in Fig.3.
ESI–MS/MS conditions were optimised for each analyte, and the best compromise for all compounds was chosen. All drugs were analysed in positive mode. Different values for capillary temperature, spray voltage, sheath and auxil-iary gas were tested (data not shown). Response signals of compounds increased with capillary temperature, but
cytarabine gemcitabine
30% 30%
0% 0%
30% 30%
0 50 100 150 200 0 50 100 150 200
methotrexate etoposide phosphate
30% 30% 0% 0% 30% 30% 0 50 100 150 200 0 50 100 150 200 ifosfamide cyclophosphamide 30% 30% 0% 0% 30% 0% 30% 0% Biais 0 50 100 150 200 0 50 100 150 200 irinotecan vincristine 30% 30% 0% 0% 30% 30% 0 50 100 150 200 0 50 100 150 200 epirubicin doxorubicin 30% 30% 0% 0% 30% 30% 0 50 100 150 200 0 50 100 150 200 Concentration [ng·mL-1]
Fig. 4 Accuracy profile for the quantification of ten cytotoxic drugs by LC–MS/MS in the concentration range from 1 to 200 ng mL−1, calculated from the trueness and intermediate precision reported in Table4; dashed lines represent the ac-ceptance limits of ±30%
doxorubicin and epirubicin were degraded at temperatures above 325 °C. Final optimised conditions were obtained with a spray voltage of 4 kV, a capillary temperature at 325°C, sheath gas at 45 psi and auxiliary gas at 2 psi. The m/z transitions and collision energy for each analyte were
successfully determined and reported in Table3.
Triple quadrupole instruments provide excellent sensi-tivity and selecsensi-tivity in SRM. Additionally, the MS/MS method can be segmented into various time windows containing different SRM events to increase the signal-to-noise ratio. Thus, seven time segments with nine scan events of data acquisition were used during the entire analytical run. This approach is particularly useful in environmental monitoring because of the relatively low concentration of each individual analyte. With the presented method, cytarabine, gemcitabine, etoposide phosphate and irinotecan were detected in their own time segment with a specific scan event. Doxorubicin and epirubicin, as cyclo-phosphamide and ifosfamide, were analysed with the same scan event in the same segment, but they were well separated by LC. Vincristine was detected in the same segment as doxorubicin and epirubicin, but with another scan event. Therefore, all cytotoxic drugs could be quantified in satisfied analytical conditions.
Method validation
The method was validated with calibration and validation samples in 0.1% formic acid. Quantitative performance was estimated in three separate series at 12 concentration levels, with three repetitions for calibration standard and three repetitions for validation standard. As a result, 72 injections were carried out per series, for a total of 216 analyses. Calibration model and concentration range
From all calibration standards, different regression models were tested to determine the best response function for the ten cytotoxic drugs: a weighted linear regression model with a weight equal to 1/x gave the best quantitative performance in the studied concentration range with a
determination coefficient (r2) of about 0.999 and superior to
0.996 for all tested compounds (Table4).
The limit of detection was set at a signal-to-noise ratio of
3:1. LODs were significantly below 1 ng mL−1for all cytotoxic
drugs (Table4). The lowest limit of quantification (LOQ) was
determined to ensure relative standard deviation (RSD) inferior to 15%. Lowest LOQs were determined between
0.25 and 2 ng mL−1 for all cytotoxic drugs (Table 4). The
upper LOQ was set at 200 ng mL−1for all cytotoxic drugs.
Higher LOQ values could theoretically be used, but in order to avoid unnecessary exposure of the operator to the cytotoxic
agents, concentrations above 200 ng mL−1were not analysed.
T able 5 Analysis of the ten cytotoxic drugs by LC –MS/MS in quality control samples and on a spiked surface Cytarabine Gemcitabine Methotrexate Etoposide phosphate Ifosfamide Cyclophos phamide Irinotecan Doxorubicin Epirubicin V incristine Quality control of drug formulations CYT/10-1 15058 gemcitabine 1,800 mg in 340 mL NaCl 0.9% − 97 ± 2 % −− − − − − − − CYT/10-1 14026 methotrexate 30 mg in 6 2 mL glucose 5% −− 97 ± 2 % −− − − − − − CYT/10-1 13521 ifosfamide 2,316 mg in 1,080 mL glucose 5% −− − − 97 ± 2 % −− − − − CYT/10-1 16360 cyclophosphamide 860 mg in 293 mL glucose 5% −− − − − 100 ± 2 % −− − − CYT/10-1 16778 doxorubicin 44 mg in 72 mL NaCl 0.9% −− − − − − − 106 ± 4 % −− CYT/10-1 15322 epirubicin 190 mg in 145 mL NaCl 0.9% −− − − − − − − 98 ± 4 % − CYT/10-1 16578 vincristine 1 m g in 5 1 m L in glucose 5% −− − − − − − − − 93 ± 2 % Environmental applications W iping sample 1:250 ng of the 10 drugs spiked on a p o ly p ro p y le ne in fu si on bag (NaCl 0 .9% 5 0 mL) 94 ± 10% 91 ± 10% 82 ± 2 % 8 5 ± 2% 84 ± 4 % 8 4 ± 8% 49 ± 12% 33 ± 10% 29 ± 10% 18 ± 12% W iping sample 2:250 ng of the 10 drugs spiked on a stainless steel surface (100 cm 2) 89 ± 10% 89 ± 10% 67 ± 8 % 7 4 ± 12% 86 ± 12% 85 ± 10% 34 ± 18% 25 ± 8 % 2 3 ± 12% 20 ± 14%
Due to practical considerations, the concentration range for all
cytotoxic drugs was limited from 1 to 200 ng mL−1.
Accuracy, trueness and precision
Concentrations of validation standards were calculated from the calibration model. Trueness was expressed in percent as the ratio between theoretical and average measured values at each concentration level. Trueness values were between
85% and 110%, as reported in Table4.
Repeatability and intermediate precision were expressed as RSD of the ratio of the intra-day standard deviation (sr) and between-day standard deviation (sR), respectively. The sr and sR values were obtained using ANOVA analyses. RSD values below 15% were obtained for each compound
(Table4).
To visualise the overall method variability, the accuracy profile of each cytotoxic drug was built from 1 to
200 ng mL−1, combining trueness and intermediate
preci-sion as the confidence interval [23]. As presented in Fig.4,
the total error did not exceed ±30% for all compounds in their quantification concentration range. Only doxorubicin
and epirubicin presented a superior limit at 1 ng mL−1
outside the tolerance of 30%, further justifying the selected
LOQ of 2 ng mL−1for these two compounds (“Calibration
model and concentration range”).
Consequently, the developed LC–ESI–MS/MS method presents quantitative performance fully compatible with environmental monitoring of cytotoxic drugs on surfaces or in combination with a sample preparation for biological sample analyses. Alternatively, the method can be used for quality control or stability studies of pharmaceutical formulations due to the very satisfactory performance at
200 ng mL−1with a total error inferior to 5%.
Applications
In order to demonstrate the applicability of the LC–ESI–MS/ MS method to real samples, determination of the ten cytotoxic agents was achieved in pharmaceutical formulations for quality control and in wiping samples for environmental monitoring. Concentrations of the cytotoxic agents were calculated with reference to a calibration curve constructed the same day with five levels of calibration standard (1, 2, 10, 50 and
200 ng mL−1) containing the ten drugs and weighted linear
regression with a weight equal to 1/x for each compound. For quality control, pharmaceutical formulations were analysed by diluting the samples to a target value of
200 ng mL−1. As shown in Table5, concentrations of the
tested pharmaceutical formulations were found to be ±10% (including both trueness and precision) of the prescribed concentration which corresponds to the acceptance limit for preparations of the HUG pharmacy.
The method was also successfully applied to environ-mental samples. The recovery rate was determined for each cytotoxic compound according to the surface type (see
Table5).
Conclusions
A simple LC–ESI–MS/MS method was successfully devel-oped for the simultaneous quantification of ten cytotoxic drugs (cytarabine, gemcitabine, methotrexate, etoposide phosphate, cyclophosphamide, ifosfamide, irinotecan, doxorubicin, epirubicin and vincristine) in 21 min, gradient equilibration time included. This method was validated and exhibited satisfactory quantitative performance in terms of limit of quantification, domain range, trueness and preci-sion: the accuracy profile showed total errors inferior to ±30% for all compounds in their quantification domain
range, from 1 or 2 ng mL−1 up to 200 ng mL−1, and total
errors inferior to ±5% at 200 ng mL−1. Therefore, the
method can be used for different applications, as shown by its successful utilisation for quality control of pharmaceu-tical formulations and environmental monitoring.
Acknowledgements We kindly thank the Proteomics Core Facility at the Faculty of Medicine, University of Geneva (Switzerland) for the loan of the LC–MS/MS instrument.
References
1. Delmas A, Gordien JB, Bernadou JM, Roudaut M, Gresser A, Malki L, Saux MC, Breilh D (2009) J Pharm Biomed Anal 49:1213–1220
2. Perez-Ruiz T, Martinez-Lozano C, Sanz A, Bravo E (2001) Electrophoresis 22:134–138
3. Mahnik SN, Rizovski B, Fuerhacker M, Mader RM (2004) Anal Bioanal Chem 380:31–35
4. Touzin K, Bussières J-F, Langlois E, Lefebvre M (2009) J Oncol Pharm Pract 15:53–61
5. Turci R, Sottani C, Schierl R, Minoia C (2006) Toxicol Lett 162:256–262
6. BGW (2009) Forschungsprojekt MEWIP http://www.pharma-monitor.de/download_mewip/MEWIP-Abschlussbericht_Sept_2008. pdf. Accessed 20 July 2010
7. Latour JF (2008) Eur J Hosp Pharm Pract ESMO Supplement 23–25 8. Weir PJ, Rigge DC, Holmes A, Fox E (2009) Hosp Pharm Eur
47:58–60
9. Wallemacq P, Capron A, Vanbinst R, Boeckmans E, Gillard J, Favier B (2006) Am J Health Syst Pharm 63:547–555
10. Connor TH, Anderson RW, Sissink PJM, Broadfiled L, Power L (1999) Am J Health Syst Pharm 56:1427–1432
11. Sabatini L, Barbieri A, Tosi M, Violante FS (2005) J Mass Spectrom 40:669–674
12. Sottani C, Porro B, Comell M, Imbriani M, Minoia C (2010) J Chromatogr B 878:2593–2605. doi:10.1016/j.jchromb.2010.04.030 13. Schreiber C, Radon K, Pethran A, Schierl R, Hauff K, Grimm C-H,
14. Pethran A, Schierl R, Hauff K, Grimm C-H, Boos K-S, Nowak D (2003) Int Arch Occup Environ Health 76:5–10
15. Sottani C, Rinaldi P, Leoni E, Poggi G, Teragni C, Delmonte A, Minoia C (2008) Rapid Commun Mass Spectrom 22:2645– 2659
16. Turci R, Minoia C (2006) Ann NY Acad Sci 1076:649–656 17. Turci R, Sottani C, Spagnoli G, Minoia C (2003) J Chromatogr B
789:169–209
18. Schmaus G, Schierl R, Funck S (2002) Am J Health Syst Pharm 59:956–961
19. Sottani C, Turci R, Schierl R, Gaggeri R, Barbieri A, Violante FS, Minoia C (2007) Rapid Commun Mass Spectrom 21:1289–1296 20. IARC (2010) Monographs on the evaluation of the carcinogenic risk of chemicals to humans. IARC, Lyon,http://monographs.iarc.
fr/ENG/Classification/index.php. Accessed 20 July 2010
21. Schierl R (2000) Microchem J 67:245–248
22. Lenz K, Koellensperger G, Hann S, Weissenbacher N, Mahnik SN, Fuerhacker M (2007) Chemosphere 69:1765–1774
23. Geiser L, Rudaz S, Veuthey J-L (2005) Electrophoresis 26:2293– 2302
![Table 3 Instrument method for the LC – MS/MS analysis for ten cytotoxic drugs with [ 13 C, 2 H 3 ]-methotrexate as internal standard](https://thumb-eu.123doks.com/thumbv2/123doknet/14837362.623114/4.892.77.820.105.387/table-instrument-method-analysis-cytotoxic-methotrexate-internal-standard.webp)
