O
pen
A
rchive
T
OULOUSE
A
rchive
O
uverte (
OATAO
)
OATAO is an open access repository that collects the work of Toulouse researchers and
makes it freely available over the web where possible.
This is an author-deposited version published in :
http://oatao.univ-toulouse.fr/
Eprints ID : 18976
The contribution was presented at WFCS 2016 :
http://www.av.it.pt/wfcs2016/admin/index.php
To link to this article URL :
http://dx.doi.org/10.1109/WFCS.2016.7496512
To cite this version :
Wang, Qi and Jaffres-Runser, Katia and Xu, Yongjun
and Scharbarg, Jean-Luc and An, Zhulin and Fraboul, Christian TDMA
versus CSMA/CA for wireless multi-hop communications: a comparison for
soft real-time networking. (2016) In: 12th IEEE World Conference on
Factory Communication Systems (WFCS 2016), 3 May 2016 - 6 May 2016
(Aveiro, Portugal).
Any correspondence concerning this service should be sent to the repository
administrator:
[email protected]
TDMA versus CSMA/CA for wireless multi-hop
communications: a comparison for soft real-time
networking
Qi Wang ∗, Katia Jaffr`es-Runser†, Yongjun Xu ∗, Jean-Luc Scharbarg†, Zhulin An ∗, Christian Fraboul†
∗Institute of Computing Technology, Chinese Academy of Sciences, Beijing, CHINA Email:{wangqi08, xyj, anzhulin}@ict.ac.cn
†Universit´e de Toulouse, IRIT / ENSEEIHT, F-31061, Toulouse, FRANCE Email:{kjr, jean-luc.scharbarg, christian.fraboul}@enseeiht.fr Tel: (+33)534322190
Abstract—Wireless networks have become a very attractive solution for soft real-time data transport in the industry. For such technologies to carry real-time traffic, reliable bounds on end-to-end communication delays have to be ascertained to warrant a proper system behavior. As for legacy wired embedded and real-time networks, two main wireless multiple access methods can be leveraged: (i) time division multiple access (TDMA), which follows a time-triggered paradigm and (ii) Carrier Sense Multiple Access with Collision Avoidance (CSMA/CA), which follows an event-triggered paradigm. This paper proposes an analytical comparison of the time behavior of two representative TDMA and CSMA/CA protocols in terms of worst-case end-to-end delay. This worst-case delay is expressed in a probabilistic manner because our analytical framework captures the versatility of the wireless medium. Analytical delay bounds are obtained from delay distributions, which are compared to fine-grained simulation results. Exhibited study cases show that TDMA can offer smaller or larger worst-case bounds than CSMA/CA depending on its settings.
Keywords—Probabilistic worst-case end-to-end delay, TDMA, CSMA/CA, IEEE802.11 DCF, Wireless multi-hop networks
I. INTRODUCTION
Wireless multi-hop networks (i.e., ad hoc, sensor, mesh networks) are currently being intensively investigated for real-time applications because of their appealing ease of deploy-ment and scalability [1], [2]. Many industrial applications require delay guarantees in their networks: packets of critical flows must arrive at their destination within a fixed delay bound. Guaranteeing hard real-time communications in wire-less networks is difficult due to the unreliability of the wirewire-less channel. However, it is possible to guarantee soft real-time requirements with a dedicated protocol stack design. Such networks can tolerate a really small probability for the end-to-end delay of flows to exceed a fixed time limit. In these networks, it is thus possible to derive a probabilistic worst-case delay bound Dw with a given confidence level.
As for legacy wired embedded and real-time networks, two main types of multiple access methods can be leveraged: (i) time division multiple access (TDMA), which follows a time-triggered paradigm and (ii) Carrier Sense Multiple Access with Collision Avoidance (CSMA/CA), which follows an event-triggered paradigm. So far, wireless real-time networking solutions rely on a mesh topology where TDMA is exploited
for its high determinism [2]. CSMA/CA is the solution chosen for mainstream non time-sensitive wireless networking for its scalability and elastic bandwidth management capability.
Several studies [1] have looked into the benefits of CSMA/CA solutions for soft real-time networking and com-pared their performance to TDMA solutions. Most of these works have evaluated both approaches using simulations and experiments. We propose in this paper to look at the problem from a theoretical point of view. There is still a need for a comprehensive analytical framework capable of calculating the worst-case delay bounds of flows carried on a given wireless network. The problem is not easy since wireless communications have to be modeled with a link transmission probability. Modeling the multi-hop, multi-flow interactions re-quires advanced performance evaluation models (e.g. Markov chain, Z-transforms, etc. ) whose assumptions are not always realistic.
This paper introduces a new method to calculate the delay distribution of a basic TDMA protocol. It relies on an ana-lytical framework that we have previously defined to capture the performance (in average) of multi-hop multi-flow wireless networks [3]. From this delay distribution calculation, we can derive the probabilistic worst-case delay bound of TDMA for any topology and flow pattern. This delay distribution and worst-case bound are validated against extensive simulations. Next, we leverage this new TDMA bound calculation to com-pare the performance of TDMA to the one of CSMA/CA on two elementary network topologies. Therefore, the analytical model of [4] we had validated for CSMA/CA is applied to the selected topologies. Several TDMA configurations are tested. As expected, TDMA can be made more or less efficient than CSMA/CA depending on its settings. Interesting to notice is that our model clearly captures the longer tail of the delay distribution of CSMA/CA compared to TDMA.
This paper is organized as follows. Section II introduces network models and protocols related to both multiple access schemes. Section III pictures the main elements of the ana-lytical models proposed herein for the end-to-end delay dis-tribution computations of TDMA and CSMA/CA. Section IV validates our analytical models against simulation. Following, it compares the performance of TDMA and CSMA/CA on two topologies. Finally, Section V concludes the paper.
S R1 R2 R3 D pR1R2 pR2R3
pR2R1 pR3R2
pR3D
pSR1
(a) 3-relay/1-flow topology
S2 D2 S1 D1 R2 R1 pR1R2 pR2R1 pR2D2 pS2R1 pR2D1 pS1R1 (b) 2-relay/2-flow topology Fig. 1. Investigated topologies.
II. SYSTEM MODEL AND PROTOCOLS A. Multi-hop topologies
In this paper, we investigate two different atomic topologies to highlight different problems that may occur in a wireless hop mesh communication. The first one is a basic multi-hop linear topology, where all packet are forwarded from one source node S to a destination node D using relay nodes. In our case, we choose a topology where three nodes relay the frames from S to D (cf. Fig. 1(a)). The more relays are exploited, the higher the odds for the transmission to fail. Typ-ically, end-to-end communications exceeding four to five hops get difficult to implement in practice. The second topology investigated is the 2-relay/2-flow topology of Fig. 1(b). Here, the two relays have to forward packets that belong to two flows, simultaneously. The first flow is emitted by S1going to D1 and the second flow is emitted by S2, going to D2. This situation is critical since the relays have to listen to both flows and to re-emit them concurrently.
Source nodes generate strictly periodic flows of frames. As we will explain later in the section IV, we set the frame generation period such as there is only one frame in the emission buffer of the source at all times. Thus, the only delay we are computing analytically or measuring by simulation is the MAC delay, i.e. the time for the frame to gain access to the channel. There is no delay related to queuing in this work. B. CSMA/CA network model and protocol
We assume that all nodes of the network follow the state-of-the-art IEEE802.11 DCF MAC protocol. We refer the reader to the standard for a detailed description of the protocol. C. TDMA network model and protocol
A perfectly synchronized TDMA is considered. A super-frame of |T | time slots is repeated indefinitely. For the 2-relay/2-flow scenario,|T | = 4. The source S1emits its frames in time slot 1, S2 in slot 2, relay R1 in slot 3 and R2 in slot 4. Similarly, for the 3-relay scenario,|T | = 4 with the source emitting in time slot 1, and relays Riin time slot number i+1. In our TDMA network model [3], each relay node is characterized by a set of forwarding probabilities xuv
ij that govern its forwarding decisions. Assume node j receives a packet from node i in the current superframe s on time slot u. TDMA scheduling algorithm describing the forwarding and emission decisions taken by any relay node j is that it will decide with probability xuv
ij to emit this packet in time slot v of next superframe s+ 1. Node j only re-emits once as P
vx uv
ij = 1. For the two investigated topologies, the Pareto-optimal forwarding probabilities are derived using a multi-objective optimization problem formulation where capacity-achieving delay and energy are minimized concurrently. The capacity-achieving metrics are calculated such as to achieve perfect transmission (i.e. all packets arrive at their destination).
III. ANALYTICAL DELAY DISTRIBUTION AND WORST-CASE DELAY MODELS
This section introduces the analytical models to derive the delay distributions of both CSMA/CA and TDMA protocols. The probabilistic worst-case end-to-end delay is derived from the delay distribution as defined next.
A. Worst-case delay definition
The delay distribution for a flow ending at destination Dj is given by the probability mass function (PMF) and denoted by the probability P[dj = k], with k ∈ R+ being positive end-to-end delay values. PMF can be computed for each flow. The probabilistic worst-case delay for the flow ending at destination Dj is defined as the delay Dw for which the probability P[dj ≥ Dw] to find a delay larger than Dw is arbitrarily small (for instance smaller than δ = 10−9). Formally, for a flow ending at Dj:
max Dw s.t. P[dj≥ Dw] ≤ δ (1) Next, we concentrate on the PMF derivation for both CSMA/CA and TDMA schemes.
B. Delay distribution for CSMA/CA
To be able to apply the Markov model of [5], where source and relay nodes compete continuously for the channel (we are at network saturation), we have to add supplementary inter-fering nodes. For each single-hop communication, we assume there are a total of n= 5 nodes contending for channel access simultaneously, including the source of interest. To compute the PMF of end-to-end delay in a multi-hop communication, we calculate first the Probability Generating Function (PGF) of the MAC delay for a one-hop communication. We assume that the delay experienced over one hop is independent of the delay of the other hops. This assumption is reasonable as we are in the saturated scenario, where all emitting nodes constantly contend for the medium. Knowing that the PGF of the sum of independent random variables is equal to the product of the PGF of each variable, the analytical PGF of the multi-hop total delay Dmultihop(Z), Z ∈ C can be easily derived as the product of the PGFs of MAC delays calculated for each hop, where C is the set of complex numbers.
Dmultihop(Z) = Dm1st(Z) ∗ Dm2nd(Z) ∗ ... ∗ Dmtst(Z)
(2) with Dmtst(Z) the PGF of the t-est hop MAC delay. To
retrieve the PMF, the numerical Lattice-Poisson inversion method of [6] is applied with accuracy10−8.
C. Delay distribution for our TDMA protocol
In our model, the delay is measured in hops. A packet may experience several paths, each one of different length in number of hops. It takes one superframe duration for the packet to travel one hop further. So all metrics of delay are expressed in hops, and can be easily converted in time units by multiplying them by|T | × τp, with τp the slot duration.
1) Relaying and arrival matrix: The relaying matrix Q gives the probabilities for any emission (i, u) in time epoch s (i.e. superframe) to be emitted as (j, v) at the following time epoch(s + 1) by the relays of the networks. The arrival matrix D is composed of the probabilities to go from any transient state to any absorbing state, i.e. the probabilities for any emission (i, u) at time epoch s to arrive at a destination
0 0.05 0.1 0.15 0.2 0.25 0.3 0.35 0.4 0.45 0.5 0 200 400 600 800 1000 1200 1400 PMF MAC delay (ms) DW = 1170 DW = 536
Analytical PMF of MAC delay for TDMA Analytical PMF of MAC delay for CSMA Worst case delay bound for TDMA (δ=10-5)
Worst case delay bound for CSMA (δ=10-5)
Fig. 2. Worst-case bounds (δ=10−5) for 2-relay topology and a slot of 10ms.
Dj in time slot v at time epoch (s + 1). The relaying matrix Q is structured as follows: Q= 0 Q12 · · · Q1N Q21 0 · · · Q2N .. . ... QN1 · · · QN−1N 0
0 is a|T |-by-|T | zero matrix representing the fact that node i never forwards a packet to itself. The matrix Qij is a|T |-by-|T | matrix that gives the probabilities of j to transmit a packet sent by node i for all possible combinations of time slots:
Qij= Q11ij · · · Q 1|T | ij .. . ... Q|T |1ij · · · Q|T ||T |ij (3) where Quv
ij is the probability for a node j to retransmit on time slot v a packet that has been transmitted by node i on time slot u. From our network model, it equals to Quv
ij = puijxuvij. The arrival matrix Dis given by:
D= D1D1 · · · D1D |D| .. . ... DN D1 · · · DN D |D| DiD
j is a|T |-by-|T | diagonal matrix whose diagonal elements
Du
iDj give the probabilities for a packet transmitted by a node
iin time slot u to arrive at destination Dj and DuiDj = p
u iDj.
QS and DS are the relaying and arrival matrices for the packets sent by the sources. They have the same structure as Q and D, where QSijfollows the pattern given by (3) and DSiDj is a|T |-by-|T | diagonal matrix whose diagonal elements are Du
SiDj = p
u SiDj.
2) Delay distribution: We assume that one hop introduces a delay of one time unit. Consequently, a h-hop transmis-sion introduces a delay of h units. The delay distribution P(d(Dj) = h) is the probability for a transmission towards Dj to be done in h hops. After s time epochs, a packet can travel up to h= s+1 hops. Thus, the probability mass function
(PMF) is given by, P(d(Dj) = h) = ( DS·ID(Dj) f(Dj) h= 1 QS·Qh−2·D·ID(Dj) f(Dj) ∀h ≥ 2
ID(Dj) is a selection vector of dimension |D||T | where the |T | elements relative to destination Dj are equal to 1 and the others are equal to 0. ID(Dj) accumulates the packet arrival rate in each time slot at destination Dj. f(Dj) gives the total packet arrival rate obtained in Dj: f(Dj) = P
∀Si∈QSf(Si, Dj). The normalized rate provided by source
Si, f(Si, Dj) : f (Si, Dj) = P
∀p∈PP(p) · τSi where P is
the set of all possible paths from Si to Di, and P(p) is the probability for a packet emitted by Si to arrive in Di. This probability is directly obtained from Q and D matrices.
IV. RESULTS
This section validates the delay distribution models and compares Dw for TDMA and CSMA/CA wireless multi-hop networks for the topologies of Fig. 1. Several settings related to TDMA slot duration and the chosen energy-delay trade-off configuration are investigated.
A. Simulation settings
Wireless topologies and protocols are simulated using the realistic discrete event-driven network simulator WSNet1. In all topologies, sources only generate frames and destinations only receive them. The sources emit a periodic flow of frames whose period is set differently according to the protocol in use. The end-to-end delay is the duration between arrival of the frame in the source buffer and the arrival of the frame in destination buffer. Frames have a constant size of 2560 bytes of payload and 24 bytes of PHY header (it is the standard maximum IEEE802.11 frame size). The data rate is 11Mbps. Simulations are performed for the duration necessary to complete the transmission of 100 000 frames.
1) TDMA settings: Results are given assuming an AWGN channel and a BPSK modulation without coding providing a bit error rate of BER(γ) = Q(√2γ) = 0.5 ∗ erfc(√γ), with γthe per bit signal to noise and interference ratio experienced on the link. In all topologies, only two nearby nodes com-municate with each other (no other node is interfering), they experience a perfect link quality. Moreover, a perfect TDMA is considered, where all nodes are perfectly synchronized. The duration of each time slot is sufficient for emitting a complete frame. The time slot durations τp values are considered here: (i) τp = 2.1ms, the minimum slot duration for sending the maximum frame size of IEEE802.11 at 11 Mbps, ii) τp= 10ms, the regular slot duration chosen by WirelessHART or ISA100.11a TDMA protocols. Note that both slot durations are long enough to carry a frame of 2584 bytes, whether using IEEE802.11 at 11Mbps or IEEE802.15.4 at 250kbps.
2) CSMA/CA settings: Presented results for the IEEE 802.11 DCF MAC delay are given with RTS/CTS mechanism. DSSS-PHY layer is assumed and main DCF timing as in [4]. By setting the source periodicity to the average end-to-end delay obtained by the Markov chain model, the simulation reaches the steady state assumed analytically. All nodes of the network have to be in the range of four nodes that are constantly competing for channel access.1http://wsnet.gforge.inria.fr/
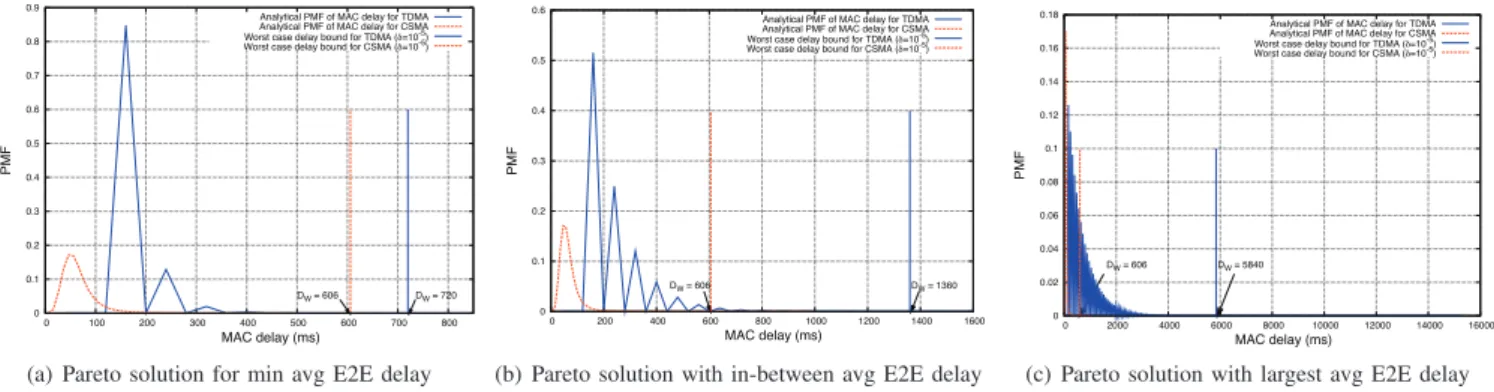
0 0.1 0.2 0.3 0.4 0.5 0.6 0.7 0.8 0.9 0 100 200 300 400 500 600 700 800 PMF MAC delay (ms) DW = 720 DW = 606
Analytical PMF of MAC delay for TDMA Analytical PMF of MAC delay for CSMA Worst case delay bound for TDMA (δ=10-5) Worst case delay bound for CSMA (δ=10-5)
(a) Pareto solution for min avg E2E delay
0 0.1 0.2 0.3 0.4 0.5 0.6 0 200 400 600 800 1000 1200 1400 1600 PMF MAC delay (ms) DW = 1360 DW = 606
Analytical PMF of MAC delay for TDMA Analytical PMF of MAC delay for CSMA Worst case delay bound for TDMA (δ=10-5)
Worst case delay bound for CSMA (δ=10-5)
(b) Pareto solution with in-between avg E2E delay
0 0.02 0.04 0.06 0.08 0.1 0.12 0.14 0.16 0.18 0 2000 4000 6000 8000 10000 12000 14000 16000 PMF MAC delay (ms) DW = 5840 DW = 606
Analytical PMF of MAC delay for TDMA Analytical PMF of MAC delay for CSMA Worst case delay bound for TDMA (δ=10-5)
Worst case delay bound for CSMA (δ=10-5)
(c) Pareto solution with largest avg E2E delay Fig. 3. The comparison of worst case delay bound (δ = 10−5) for 3-relay TDMA and CSMA/CA networks - time slot duration of 10ms.
TABLE I. DWFOR ALL TOPOLOGIES (UNIT:MS) Scenario δ DW for TDMA
(τp= 2.1ms) DW for TDMA (τp= 10ms) DW for CSMA/CA (IEEE802.11 DCF) 2-relay 10−5 246 1170 536 10−7 347 1650 1286 10−9 435 2070 1596 3-relay (smallest E2E delay) 10−5 152 720 606 10−7 185 880 1586 10−9 219 1040 1926
B. Delay distribution andDw comparative analysis
The analytical delay distribution for TDMA and CSMA/CA protocols are verified by simulations. For the 2-relay TDMA networks, there is a single Pareto-optimal solution. As seen in Fig. 2, the analytical delay distribution for one source-destination pair compared with the simulation results for 2-relay TDMA network matches well for most of the delay values that appear the most frequently. The tail of the distribution is very difficult to validate with simulations since such delays are very rare events, with very small probabilities (y-axis of plot is in logscale). However, looking at the overall fit, and the RMSE of 1.7069 ∗ 10−3 for the computed values, we can conclude that the model seems to be accurate enough (for soft real-time guarantees). For the 3-relay TDMA networks, there are several Pareto solutions and we have picked three Pareto optimal solutions to show their delay distribution. Their distributions are plotted in Fig. 3(a), Fig. 3(b) and Fig. 3(c), respectively. The RMSE between analytical and simulated delay PMF is of 4.9428 ∗ 10−3 for the Pareto optimal solution with smallest delay. For largest and the one in between, RMSE is of 4.9523 ∗ 10−3 and of 1.0803 ∗ 10−2, respectively. For the 2-relay and 3-relay CSMA/CA network, from the Fig. 2 and Fig. 3, the analytical and simulated delay distribution match well, even for the tail of delay distribution. The RMSE is of 4.7666 ∗ 10−2 for the 2-relay scenario and of6.1348 ∗ 10−2for the 3-relay scenario. The worst case delay bound Dw comparisons for TDMA and CSMA/CA networks has been derived for two time slot duration values. Dw for the 2-relay and 3-relay scenarios are given for different values of δ in Table I. As shown in Fig. 2, we can see that Dw of TDMA network is larger than the one of CSMA. This plot has been derived for a time slot duration of 10ms. For a time slot duration of2.1ms, however, TDMA is faster than CSMA/CA. This fact highlights that the efficiency of TDMA can be largely improved by adjusting to a smaller period of course. But in practice, synchronization
errors are overcome by oversizing the slots at the cost of overall performance. However, the tail for TDMA systems is shorter than the one of CSMA. Thus, TDMA systems exhibit a slower increase in Dw if δ values drop.
V. CONCLUSION
This paper provides an overview of two models whose aim is to calculate the worst-case delay bounds Dwfor TDMA and CSMA/CA-based wireless multi-hop networks. Original to this work is the analytical delay distribution model for TDMA. The CSMA/CA analysis stems from previous works of ours. Both models are validated by simulations for two elementary topologies. After calculating the Dw bounds for TDMA and CSMA/CA for both topologies, we have investigate the impact of the TDMA slot duration on Dw. We can show that this choice clearly impacts the worst-case bound performance of TDMA, as expected. In future works, we will concentrate on adding synchronization overhead into our TDMA model. Moreover, for both TDMA and CSMA/CA, we plan to intro-duce a more precise analytical model to capture the physical layer of mainstream sensors.
VI. ACKNOWLEDGMENTS
This work is supported by Important National Science and Technology Specific Projects (2014ZX03006-003) and Prospective Research Project on Future Networks of Jiangsu Future Networks Innovation Institute (BY2013095-4-21).
REFERENCES
[1] S. Zhuo, Z. Wang, Y. Q. Song, Z. Wang, and L. Almeida, “iqueue-mac: A traffic adaptive duty-cycled mac protocol with dynamic slot allocation,” in 2013 IEEE International Conference on Sensing, Communications and
Networking (SECON), June 2013, pp. 95–103.
[2] S. Petersen and S. Carlsen, “Wirelesshart versus isa100.11a: The format war hits the factory floor,” Industrial Electronics Magazine, IEEE, vol. 5, no. 4, pp. 23–34, Dec 2011.
[3] Q. Wang, K. Jaffr`es-Runser, C. Goursaud, J. Li, Y. Sun, and J.-M. Gorce, “Deriving pareto-optimal performance bounds for 1 and 2-relay wireless networks,” in IEEE IC3N, Nassau, Bahamas, August 2013.
[4] Q. Wang, K. Jaffr`es-Runser, J.-L. Scharbarg, C. Fraboul, Y. Sun, J. Li, and Z.-C. Li, “A thorough analysis of the performance of delay distribu-tion models for IEEE 802.11 DCF,” Elsevier Ad Hoc Networks Journal, vol. 24, pp. 21–33, 2015.
[5] G. Bianchi, “Performance analysis of the ieee 802.11 distributed coordi-nation function,” Selected Areas in Communications, IEEE Journal on, vol. 18, no. 3, pp. 535–547, 2000.
[6] H. Vu and T. Sakurai, “Accurate delay distribution for IEEE 802.11 DCF,” Communications Letters, IEEE, vol. 10, no. 4, pp. 317–319, 2006.