HAL Id: pastel-00967913
https://pastel.archives-ouvertes.fr/pastel-00967913
Submitted on 31 Mar 2014HAL is a multi-disciplinary open access archive for the deposit and dissemination of sci-entific research documents, whether they are pub-lished or not. The documents may come from teaching and research institutions in France or abroad, or from public or private research centers.
L’archive ouverte pluridisciplinaire HAL, est destinée au dépôt et à la diffusion de documents scientifiques de niveau recherche, publiés ou non, émanant des établissements d’enseignement et de recherche français ou étrangers, des laboratoires publics ou privés.
Carbon-Based Nanomaterials as an Anode for Lithium
Ion Battery
Fei Yao, Costel Sorin Cojocaru
To cite this version:
Fei Yao, Costel Sorin Cojocaru. Carbon-Based Nanomaterials as an Anode for Lithium Ion Bat-tery. Micro and nanotechnologies/Microelectronics. Ecole Polytechnique X, 2013. English. �pastel-00967913�
Carbon-Based Nanomaterials as an Anode
for Lithium Ion Battery
Fei YAO
LPICM-École Polytechnique, CNRS (UMR 7647)
Laboratoire de Physique des Interfaces et Couches Minces
Route de Saclay; 91128 PALAISEAU Cedex , France
The Graduate School
Sungkyunkwan University
Department of Energy Science (DOES)
IBS Center for Integrated Nanostructure Physics
THÈSE
Présentée pour obtenir le grade de DOCTEUR DE L’ ÉCOLE POLYTECHNIQUE
Spécialité: Physique Par
Fei YAO
Carbon-Based Nanomaterials as an Anode
for Lithium Ion Battery
Soutenue le 27 / 06 / 2013 devant le jury constitué de :
M. Jean-Pierre Pereira-Ramos Directeur de Recherche CNRS Rapporteur
M. Kee Seok Nahm Professor à Chonbuk National University Rapporteur
M. Won Sub Yoon Professor à Sungkyunkwan University Examinateur
M. Marc Chatelet Directeur de Recherche CNRS Examinateur
M. Costel-Sorin Cojocaru Chargé de recherche au CNRS Enseignant à l’École polytechnique
Directeur de Thèse
M. Young Hee Lee Professor à Sungkyunkwan University Directeur de Thèse
LABORATOIRE DE PHYSIQUE DES INTERFACES ET COUCHES MINCES (LPICM) CNRS, UMR7647, ÉCOLE POLYTECHNIQUE
The Graduate School
Sungkyunkwan University
ACKNOWLEDGMENTS
First and foremost, I would like to express my greatest gratitude to Prof. Young Hee Lee and Dr. Costel Sorin Cojocaru, my advisors of graduate research, for their patient guidance and continuous support throughout the last three years. They taught me strict sense of research, humble attitude of study, and correct path in life. I feel so lucky and honored for being their student in the most important days of my growth. Their great fairness, concern and understanding will be appreciated through all my life.
My sincerely thanks are extended to all my coworks, Dr. Fethullah Güneş, Mr. Bing Li, Dr. Kangpyo So, Mr. Huy Quang Ta, Mr. Jian Chang, Mr. An Quoc Vu, Mr. Seung Jin Chae, Dr. Hongyan Yue, Prof. Didier Pribat and Prof. Sishen Xie, in Sungkyunkwan University. And also Dr. Seung Mi Lee from Center for Nanocharacterization, Korea Research Institute of Standards, Dr. Kyeu Yoon Sheem from Science and Samsung SDI Corporate R&D Center.
I would like to dedicate this thesis to my parents and sister for their continuous understanding, support, and love. My deepest appreciation to my beloved husband, Humin Li, for his love, encouragement and accompanying all the time!
I
ABSTRACT
In this thesis work, carbon-based nanomaterials using as an anode for lithium ion battery have been generally investigated. Compared to typical micron-sized carbon materials, nanosized carbon materials exhibited great potentials not only in practical anode application but also in the fundamental science exploration of Li ion diffusion. In the case of practical application, one dimensional carbon nanofibers (CNFs) fabricated by electrospinning was prepared for anode material. The structure involves neither a metal substrate nor binders and therefore eventually benefited the capacity and long term stability. Yet, the energy density is still limited to 370 mAh/g of conventional carbon. In order to improve the capacity of raw carbon nanofibers, silicon, a high Li storage material, was incorporated by electrochemical deposition. The resulted Si/CNF mat improved clearly the capacity of carbon materials more than twice for most of cases.
In the case of fundamental study, chemical vapor deposition (CVD)-synthesized two dimensional graphene was chosen to be a media to reveal the diffusion pathways of Li ion. Compared to typical graphite which contains both basal and edge planes, a well defined basal plane with large area can be realized in graphene to provide a comprehensive picture of lithium diffusion mechanism. We have discovered that electrochemical reaction of electrode (substrate/graphene) not only is related to the number of graphene layers but also relies on the defect sites on the basal plane of graphene. Combing the experimental results and density functional theory calculations, we proved that basal plane hindered lithium ion diffusion with a high diffusion barrier height, whereas divacancies and higher order defects can be shortcuts for lithium ion diffusion.
Keyworks: nanocarbon materials, lithium ion battery, carbon nanofiber, silicon,
II
RESUME
Dans ce travail de thèse, nous avons exploré l’utilisation des nanomatériaux à base de carbone comme anode pour les batteries lithium-ion. Par rapport aux matériaux d’anode classiques qui sont de type carbone graphitique a des tailles de grains de l’ordre du micromètre, les matériaux de carbone de taille nanométrique présentent un grand potentiel non seulement pour l'application pratique en tant que matériau d'anode, mais aussi du point de vue de la science fondamentale car permettent l'exploration fine des phénomènes de diffusion des ions lithium. Dans le cadre de l'application pratique, nous avons exploré les nanofibres unidimensionnelles de carbone (CNF) en tant que matériau d'anode. Cette structure d’anode comporte un substrat métallique comme collecteur de courant mais n’avons pas utilisé des liants ce qui bénéficie a la stabilité à long terme. Pourtant, la densité d'énergie que nous avons obtenu était encore limitée à 370 mAh /g similaire à celle du carbone conventionnel. Afin d'améliorer la capacité des nanofibres de carbone bruts, nous les avons recouverts de silicium (par dépôt électrochimique), un matériau d’insertion de lithium avec une bien plus importante capacité de stockage. Le tapis hybrides Si / CNF ont permis d'améliorer nettement la capacité des matériaux de carbone jusqu'à deux fois de plus pour la plupart des cas.
Du point de vue des études fondamentales, le graphène matériau bidimensionnel, a été synthétisé par dépôt chimique en phase vapeur (CVD) et utilisé comme un support pour mettre en évidence les chemins de diffusion des ions lithium. Par rapport à du graphite classique qui contient à la fois les deux plans de type basal et prismatique, seulement un plan basal bien défini et d’une grande surface spécifique peut être réalisé dans le cas du graphène. Nous avons découvert que la réaction électrochimique a l'électrode (substrat / graphène) est non seulement liée au nombre de couches de graphène mais s'appuie également sur la présence de défauts dans le plan de graphène. Combinant les résultats expérimentaux et les calculs de théoriques, nous avons pu prouver que le plan basal empêche la diffusion des ions de lithium avec une hauteur de barrière de diffusion élevé, alors que les divacancies et les défauts d'ordre supérieur peuvent constituer des raccourcis pour la diffusion des ions de lithium.
Keyworks: Matériaux des nanocarbonés, batterie lithium-ion, nanofibre de
III
Table of Contents
Introduction
1
Bibliography of Introduction
4
Chapter 1. Overview of Rechargeable Lithium Ion Battery
1.1
Electrochemical Energy Storage Systems
6
1.2
Rechargeable Lithium Based Battery
8
1.3
Rechargeable Lithium Ion Battery
11
Bibliography of Chapter 1
13
Chapter 2. Carbonaceous Materials as An Anode of Li-Ion Battery
2.1
Operation Mechanism of Li-Ion Battery
16
2.2
Classification of Carbonaceous Materials
21
2.2.1
Graphitic Carbon
21
2.2.2
Non-graphitic Carbon
22
2.3
Lithium Intercalation into Carbonaceous Materials
24
2.3.1
Lithium Intercalation into Graphitic Carbon Materials
24
2.3.1-1 Description
24
2.3.1-2 Charge/Discharge Profile of Graphitic Carbon Materials
26
IV
2.3.2-1 Low Specific Charge Carbon
29
2.3.2-2 High Specific Charge Carbon
31
2.4
Summary of Chapter Two
36
Bibliography of Chapter 2
38
Chapter 3. Silicon-Coated Carbon Nanofiber Mat for Anode of Lithium
Ion Battery
3.1
One Dimensional Carbon Materials as an Anode Material for
LIB
51
3.1.1
General Introduction of CNFs and CNTs
51
3.1.2
CNFs and CNTs Using as an Anode Material for LIB
56
3.1.3
Fabrication Methods of CNFs and CNTs
58
3.1.3-1 Chemical Vapor Deposition for Both CNFs and CNTs
58
3.1.3-2 Electrospinning Method for CNFs Mat
63
3.2
Electrospinning Fabricated CNFs Mat as an Anode Material
for LIB
66
3.2.1
SEM and Raman Characterization of CNFs Synthesized
Through Electrospinning
67
3.2.2
Anode Performance of CNFs Synthesized Through
Electrospinning
69
V
3.4
Summary of Chapter Three
95
Bibliography of Chapter 3
97
Chapter 4. Diffusion Mechanism of Lithium Ions through Basal Plane of
Layered Graphene
4.1
Brief Introduction of Two Dimensional Graphene
105
4.1.1
General Physical Properties of Graphene
105
4.1.2
Synthesis Methods of Graphene
110
4.2
Diffusion Mechanism of Lithium Ions through Basal Plane of
Layered Graphene
113
4.2.1
Material Preparation
116
4.2.2
Transfer Process of Graphene
116
4.2.3
Characterization of Graphene
117
4.2.4
Anode Performance of Graphene
121
4.3
Summary of Chapter Four
140
VI
List of Tables
Table 3.1 Anode performance comparison of silicon/CNF composites fabricated by different methods. CNF film is usually fabricated by mixing CNF powder with a binder. CNF mat is binder-free freestanding film fabricated by electrospinning method.
89
Table 4.1 Defects related Li adsorption energy, and Li atomic charges calculated by Mulliken, Hirshfeld, and electrostatic potential (ESP) at the minimum energy configurations (M) and the barrier states (B). Positive charge indicates charge depletion from lithium atom.
VII
List of Figures
Fig. 1.1 Ragone plot showing energy density vs. power density for various energy storage devices.
7
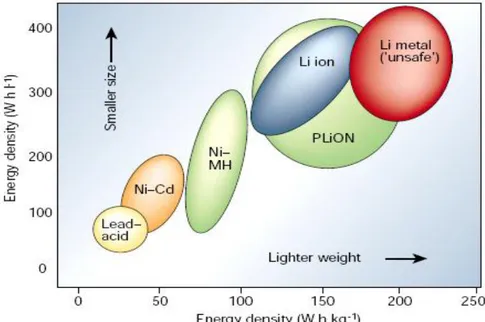
Fig. 1.2 Comparison of the different battery technologies in terms of volumetric and gravimetric energy density.
8
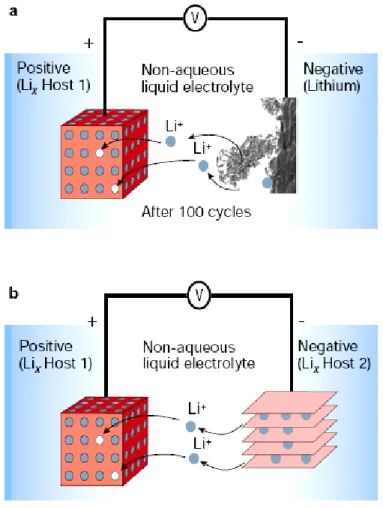
Fig. 1.3 Schematic representation of lithium batteries. a, Rechargeable lithium-metal battery, dendrite formation was shown in the negative electrode. b, Rechargeable lithium-ion battery.
10
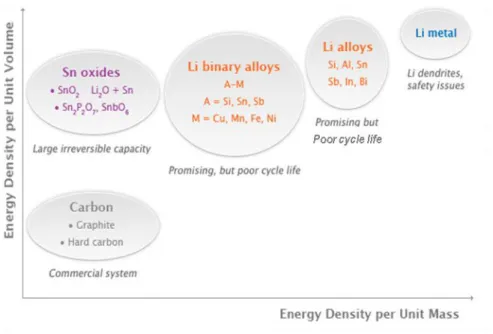
Fig. 1.4 Current issues remaining in different types of anode materials. 12 Fig. 2.1 Schematic illustration of detailed charge/discharge process in
Li-ion battery.
15
Fig. 2.2 Potential profile of anode and cathode during charge/discharge. 17 Fig. 2.3 Charge curves of different metals (M) with respect to highly
oriented turbostratic pitch carbon fibers.
18
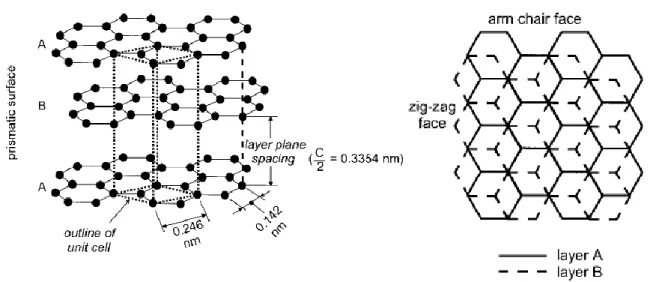
Fig. 2.4 Left: Schematics of the crystal structure of hexagonal graphite with an AB stacking order. Right: view perpendicular to the basal plane of graphite. Edges can be subdivided into arm-chair and zigzag faces.
20
Fig. 2.5 Schematic indications of (a) graphite and (b) non-graphitic (disordered) carbonaceous material.
23
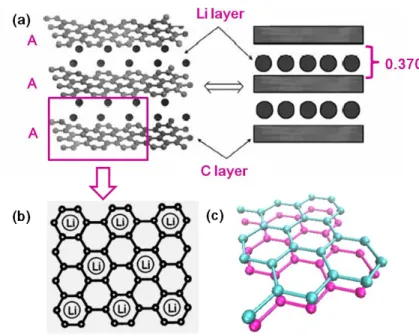
Fig. 2.6 Structure indications of LiC6. (a) Left: schematic drawing
showing the AA layer stacking sequence with Li intercalation. Right: simplified representation. (b) Perpendicular view to the basal plane of LiC6. (c) Enlarged schematic of AA stacking
order.
VIII
Fig. 2.7 Schematic indication of stage formation during Li ion intercalation into graphite layers.
26
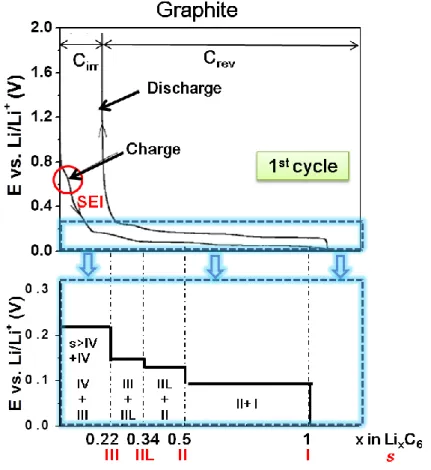
Fig. 2.8 Constant current charge/discharge curves of the graphite (Timrex KS 44, Cirr is the irreversible specific charge, and Crev is
the reversible specific charge).
27
Fig. 2.9 Constant current charge/discharge curves of a coke (Conoco). (Cirr is the irreversible specific charge, Crev the reversible
specific charge).
31
Fig. 2.10 a) Storage mechanisms of Li ions in graphite. b) Li storage in a form of Li2 covalent molecules. c) Schematic model of Li
storage in cavities and nanopores. d) Li adsorption on the two sides of an isolated graphene sheet.
33
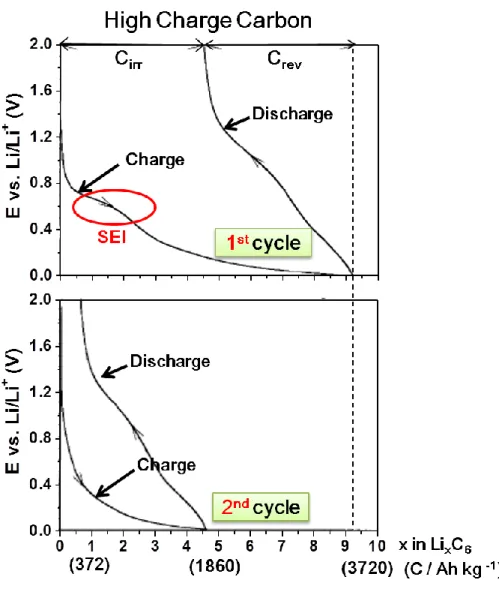
Fig. 2.11 Constant current charge/discharge curves (1st and 2nd cycle) of a high specific charge carbon material after heat treatment at 700 °C. (Cirr is the irreversible specific charge, Crev the reversible
specific charge).
34
Fig. 3.1 Schematic comparison of the diameter dimensions on a log scale for various types of fibrous carbons.
52
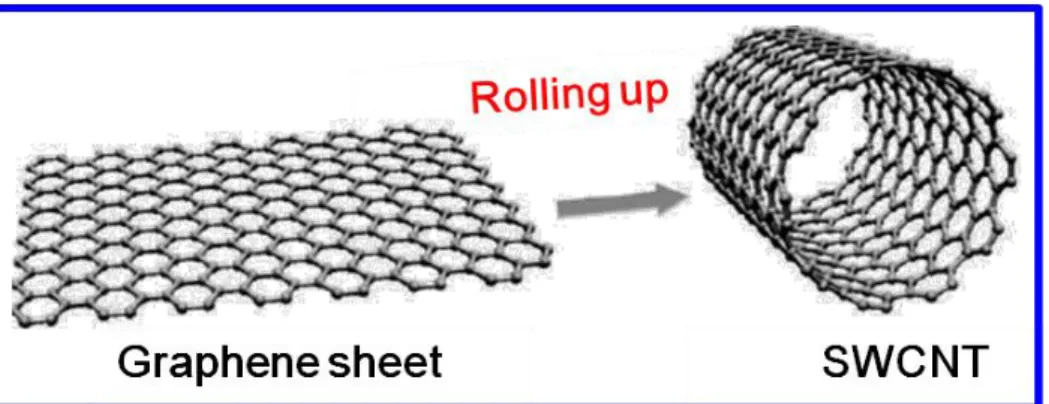
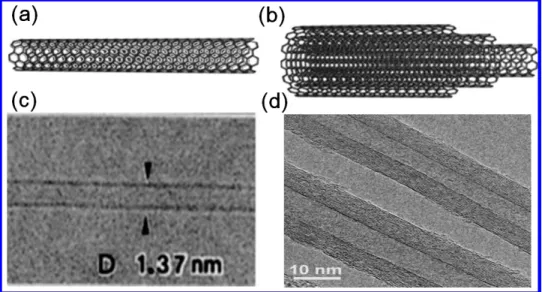
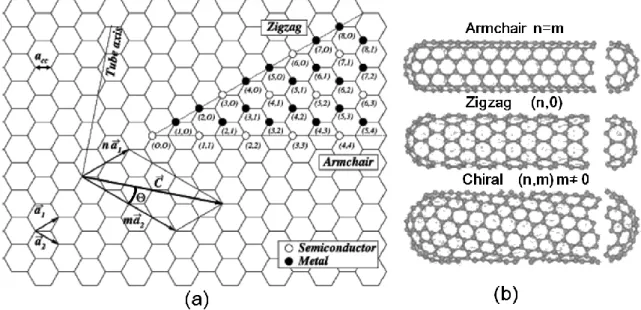
Fig. 3.2 Wrapping of graphene sheet to form SWNT. 53 Fig. 3.3 Schematic indications of (a) SWCNT, (b) MWCNT, and the
corresponding TEM images in (c) and (d).
54
Fig. 3.4 Chiral vector and chiral angle θ definition for a (2, 4) nanotube on graphene sheet. and .are the unit cell vectors of the two-dimensional hexagonal graphene sheet. The circumference of nanotube is given by the length of chiral vector. The chiral angle θ is defined as the angle between
IX chiral vector and the zigzag axis.
Fig. 3.5 CVD process-fabricated (a) CNT power, (b) vertically aligned CNTs, and (c) CNF planar network.
59
Fig. 3.6 Typical anode assembling based on CVD process fabricated carbon powder.
62
Fig. 3.7 Schematic of CNF mat fabrication processes: (a) schematic of electrospinning apparatus and (b) the fabricated nanofiber network.
65
Fig. 3.8 SEM images of as-synthesized CNFs with (a) top view and (b) cross-sectional images.
68
Fig. 3.9 Micro Raman spectra of CNFs mat fabricated by electrospinning method.
68
Fig. 3.10 (a) Voltage profiles electrospinning fabricated CNF mat between 0.01 and 2 V at a charging rate of 0.1 C. The cycle numbers are indicated in the figure. (b) Rate performance and columbic efficiency of the above sample.
70
Fig. 3.11 (a) Structure deformation indication of Si based film/particles before and after charge/discharge cycling. (b) SEI images of CVD deposited Si thin film on Cu stustrate after 1st and 30th cycles of charge/discharge.
73
Fig. 3.12 Schematic of the apparatus for electrodeposition of Si. The cell consists of three electrodes: woking electrode (as-fabricated CNF mat), counter electrode (Pt wire) and reference electrode (Ag/Ag+). During the deposition, a Si-containing electrolyte (SiCl4 in PC) was add into the cell and a cyclic voltage scan (20
mV s-1) was applied to the electrodes.
X
Fig. 3.13 (a) Cyclic voltammograms of silicon electrodeposition in PC solution with/without SiCl4 at a scan rate of 20 mV s-1. (b) Mass
and thickness of Si/CNF mat with respect to different silicon deposition cycles. The error bar is added in the figure.
76
Fig. 3.14 (a) Micro-Raman spectra of bare CNF mat and Si/CNF mat with 200 cycles of Si deposition before/after annealing, indicated as Si-200-p and as Si-200-a in the figure. (b) XPS spectra of the electrode surface with active materials consisting of Si-200-p and Si-200-a, respectively.
78
Fig. 3.15 SEM images of (a) Si-200-p and (b) Si-200-a samples. Dark color portion indicates electrolyte residues on the surface of CNF mat. After 1000 °C annealing, the uniform mat surface was observed by the removal of electrolyte, as shown in (b).
79
Fig. 3.16 (a) SEM images of as-synthesized bare CNFs and (b) Si-200-a. The cross-sectional images are shown in the insets. (c) AFM image of Si-200-a. The high resolution image of dashed square in (c) is shown in (d).
80
Fig. 3.17 (a) TEM image of Si-200-a. The EDS line profile along the dashed line is shown in (b).
81
Fig. 3.18 High-resolution XPS spectra of Si/CNF with 200 cycles of Si deposition before and after annealing. Figure (a) and (c) are C 1s and Si 2p fitted peaks before annealing. (b) and (d ) are C 1s and Si 2p fitted peaks after 1000 °C annealing. Peak positions and relative ratios are shown in the figure.
83
Fig. 3.19 (a) CV profile comparison between bare CNF mat and CNF mat after 1000 °C annealing. The curves were recorded after 1st CV scan between 0.01 to 2 V at a scan rate of 0.1 mV s-1. (b) AC
XI
impedance spectra of the above two electrodes. The spectra were recorded right after the cell assembling before cycling.
Fig. 3.20 (a) The 2nd and 10th cyclic voltammograms of CNF-a (square), Si-200-p (dashed line) and Si-200-a (solid line) mats between 0.01 and 2 V at a scan rate of 0.1 mV s-1. (b) and (c) are voltage profiles of Si-200-p/Si-200-a and CNF-a/Si-200-a between 0.01 and 2 V at a charging rate of 0.1 C. The cycle numbers are indicated in the figure. (d) Charge/discharge capacity and Coulombic efficiency of Si-200-a for the first 80 cycles.
86
Fig. 3.21 (a) Charge (filled symbols)/discharge (open symbols) capacity in terms of different numbers of silicon deposition cycles after high temperature annealing. Capacity was calculated based on silicon mass only. Sample indications are shown in the right dashed square. (b) AC impedance spectra of the above five electrodes. The spectra were recorded right after the cell assembling before cycling. The equivalent circuit is shown in the inset. The related resistance value in Figure (b) was plotted in Figure (c) with respect to different silicon deposition cycles.
90
Fig. 3.22 SEM images of (a-b) Si-1500-p and (c-d) Si-1500-a samples. 92 Fig. 3.23 Charaterizations of Si-200-a electrode after 80 cycles
charge/discharge. (a) Top-view SEM image, (b) Cross-sectional SEM image, (c) High resolution TEM image, and (d) AFM image. The SEI layer was selectively removed by washing the sample with acetonitrile and diluted HCl.
94
Fig. 4.1 Graphene is a basic 2D building block for other carbon allotropes with different dimensionalities.
106
XII
unit cell. b) Tight-binding band structure of graphene π-bands, considering only nearest neighbor hopping. c) Band structure near K point showing the linear dispersion relation.
Fig. 4.3 Electronic Structure of: a) Metal: Finite Density of States (DOS) at Fermi energy. b) Semiconductor: Gap at Fermi energy. c) Graphene: Zero gap Semiconductor. Zero DOS metal.
109
Fig. 4.4 Production techniques of graphene: a) Micro-cleavage method, isolating graphitic layers from graphite into monolayer graphene flakes with the help of a cohesive tape, b) epitaxial growth of graphene by decomposition of SiC into graphene, c) chemical vapor deposition method by decomposition of hydrocarbon gases on metal substrates, and d) chemical exfoliation of graphite oxide by weakening van der Waals cohesive force via insertion of reactants into interlayer space.
112
Fig. 4.5 Schematic of fabrication process with Cu-grown SLG or Ni-grown MLG (left panel). Bilayer and trilayer graphene can be fabricated by transferring monolayer graphene repeatedly. Photograph of as-prepared monolayer graphene (PMMA on top) floating in water and CR 2032 coin cell case (right panel).
117
Fig. 4.6 Schematic of a coin cell structure with Cu-grown SLG or Ni-grown MLG. Bilayer and trilayer graphene coin cells were fabricated by transferring monolayer graphene repeatedly.
118
Fig. 4.7 Optical micrographs of (a) Cu-grown SLG and (b) Ni-grown MLG on SiO2/Si substrate. White dashed lines indicate wrinkles.
Some portion of thicker graphene is indicated by arrows. (c) Schematic of (i) SLG with a well defined basal plane and (ii) edge plane enriched MLG. (d) Micro-Raman spectra of SLG and MLG. Confocal Raman mapping of D/G intensity ratio of (e)
XIII
SLG and (f) MLG from squared positions of (a) and (b). The contrast is normalized to 0.4 to visualize the defect distribution for both images. (g) Wavelength-dependent transmittance (values are provided at a wavelength of 550 nm) and (h) optical photographs of different number of graphene layers on PET substrate.
Fig. 4.8 (a) Cyclic voltammograms of different number of graphene layers samples at a scan rate of 0.1 mV/s. SUS-related redox reaction peaks (SO, SR) and lithium intercalation/deintercalation
related peaks (LiIn/LiDe) are marked in the figure. (b) 1st and (c)
2nd galvanostatic charge/discharge profiles of different number of graphene layers at a current density of 5 µA/cm2. (d) The related layer-dependent capacities. Two regimes of corrosion-dominant and lithiation-corrosion-dominant are indicated.
123
Fig. 4.9 Cyclic voltammograms at a scan rate of 0.1 mV/s (a) and 2nd galvanostatic charge/discharge profiles at a current density of 5 µA/cm2 (b) of bare CR2032 coin cell case and foil SUS 316.
125
Fig. 4.10 AC impedance spectra obtained by applying a sine wave with an amplitude of 10 mV over a frequency range from 100 kHz to 10 mHz. The inset shows impedance at higher frequency region to demonstrate charge transfer resistance.
128
Fig. 4.11 Theoretically estimated capacity based on LiC6 intercalation. No
absorption of Li ions occurs at monolayer graphene.
130
Fig. 4.12 (a) Raman spectra, (b) cyclic voltammograms at a scan rate of 0.1 mV/s, and (c) 2nd galvanostatic charge/discharge profiles at a current density of 5 A/cm2 for monolayer graphene treated by Ar plasma with different plasma powers (15 W and 100 W). (d) Capacity of 2nd charge as a functional of number of graphene
XIV
layers under different Ar plasma powers. Absolute slopes according to different plasma powers and critical layer thickness (lc) are indicated in the figure. (e) Schematics of proposed Li
diffusion mechanism through defects on the basal plane with different defect population. Broad down arrows indicate Li ion diffusion through defect sites of basal plane. Red glows represent steric hindrance for Li ion diffusion formed by the accumulated Li ions or functional groups. The inset in the right indicates the relative magnitude of diffusion coefficient. (f) Relationship of D/G ratio with the extracted slope from (d). Fig. 4.13 Side and top views of atomic configurations (top panel),
isosurface images of electrostatic potential (second panel), bond lengths and local charge distributions at the barrier states (third panel), and the diffusion barrier profiles of Li (bottom panel) through (a) graphene hexagonal site (H site), (b) Stone-Wales (SW) defect (c) monovacancy (V1), and (d) divacancy (V2). Isovalue for rendering isosurfaces is 0.25 e/Å3. The insets in the third panel show isosurface image of electrostatic potential for each corresponding structure without Li ion. Bond lengths (yellow color) and electrostatic potential charges (white color) are in units of Å and electrons, respectively.
137
1
I
NTRODUCTIONThe issue of the sustainability of energy supply has attracted worldwide concern due to the crisis in rapid depletion of fossil energy resources along with serious environmental pollution issues. Over the past several decades, tremendous efforts have been made in developing alternative technologies to harvest and store sustainable clean energy. Thanks to the development of nanoscience and nanotechnology, clean energy technologies are progressing impressively which makes them more practical and price competitive with fossil fuels. Clean energy technology covers production, storage, and conversion. Researches on energy production from renewable natural resources include solar energy conversion, wind, geothermal and hydraulic energy and involve often heavy engineering works. Our main concern using nanoscience from basic science point of view is energy storage. Among all different kinds of energy storage systems, rechargeable lithium-ion battery (LIB) is one of the greatest successes of modern material electrochemistry. It has drawn the most attention not only because of its higher energy density and longer cycle life compared to any existing battery systems but also its lightweight and compact which benefit the application in hybrid vehicles and portable electronics [1].
LIB consists of an anode (negative electrode) and a cathode (positive electrode). These two electrodes are capable of reversibly hosting lithium in ionic
2
form. Common candidates for the cathode are lithiated metal oxides and carbonaceous materials for the anode. Prior to the discovery of graphite anode materials, lithium metal had been used. However, possibility of thermal runaway caused by the internal shorts triggered by the formation of lithium dendrites has been a long standing issue [2]. The use of graphite as an anode material for intercalating lithium ions in rechargeable LIB was then proposed [3]. It is still the main stream of anode material for commercial LIB up to now due to its well defined layered structure for lithium intercalation, low operating potential, and remarkable interfacial stability [4]. Unfortunately, the intercalation capacity of lithium ions in graphite is limited to 372 mAh/g with LiC6 stoichiometry. Numerous efforts have been made to increase this value by modifying the crystallinity, the microstructure, and the micromorphology of the carbonaceous material [5-8]. These structural parameters play a crucial part in determining and optimizing the electrochemical performance of carbon anodes.
The exploration of nanomaterials and nanocomposites provides us new opportunities to improve the anode performance of LIB. Compared to micrometer-scaled carbon material, nanostructured carbon exhibits differences not only in dimensionality and morphology, but also in the distribution of chemical bonding which allows the mixtures of local electronic structures between sp2 and sp3 [9] Therefore, carrier transport properties are different from classic carbon material when nanometer-scaled carbon is in contact with
3
reactants. Nanostructured carbon materials with high accessible surface areas and short diffusion time for lithium ions open new perspectives for high energy density and high power density LIB.
In order to fully develop the potential of nanoscaled carbon as an anode for LIB, a systematical study is needed. In this thesis work, after a brief overview of LIB (chapter one), fundamentals that provide the basic idea of operation mechanism in LIB, types of conventional carbon anode materials, and their anode performance will be reviewed in chapter two. Chapter three will mainly focus on studying the one dimensional carbon nanofiber anode material. An easy fabrication process, electrospinning, which is a good for mass production is introduced for raw carbon nanofiber synthesis. In order to improve the performance of raw carbon nanofiber, Si, a high Li storage material, is incorporated through electrochemical deposition method. Using nanoscaled carbon material for fundamental research of lithium ion diffusion pathway is given in chapter four. Here, two dimensional graphene synthesized by chemical vapor deposition is chosen to study the nature of Li ion diffusion since it is the basic building block of graphite which is the most common material for anode.
4
Bibliography of Introduction
[1] J. M. Tarascon, M. Armand, Nature 2001, 414, 359.
[2] F. Orsini, et al., J. Power Source 1999, 81, 918.
[3] M. Armand, P. Touzain, Materials Science and Engineering 1977, 31, 319.
[4] M. Winter, O. J. Besenhard, E. M. Spahr, P. Novák, Adv. Mater. 1998, 10, 725.
[5] M. Winter, J. O. Besenhard, Lithium Ion Battery: Fundamentals and
Performance 1998 (Eds.: M. Wahihara, O. Yamamoto), Wiley-VCH,
Weinheim.
[6] A. Mabuchi, K. Tokumitsu, H. Fujimoto, T. Kasuh, J. Electrochem. Soc. 1995, 142, 1041.
[7] W. Ruland, J. Appl. Phys. 1967, 38, 3585.
[8] M. Endo, C. Kim, K. Nishimura, T. Fujino, K. Miyashita, Carbon 2000,
38, 183.
5
Outline of Chapter One
Overview of Rechargeable Lithium Ion Battery
1.1
Electrochemical Energy Storage Systems
6
1.2
Rechargeable Lithium Based Battery
8
1.3
Rechargeable Lithium Ion Battery
11
6
C
HAPTERO
NEOverview of Rechargeable Lithium Ion Battery
1.1 Electrochemical Energy Storage Systems
Systems for electrochemical energy storage convert chemical energy into electrical energy. Electrochemical energy storage devices basically include batteries, fuel cells, and electrochemical capacitors (ECs). Although the mechanisms for energy storage and conversion are different, similarities do exist among these three systems. Common features are that batteries, fuel cells, and ECs consist of two electrodes which in contact with electrolyte. Requirements upon electron and ion conduction in electrodes and electrolyte are valid for all three systems. Furthermore, electron and ion transport are separated during the charge/discharge processes which take place at the phase boundary of the electrode/electrolyte interface [1]. The main difference between battery, fuel cell and ECs is the way of elec trical energy generation. In batteries and fuel cells, electrical energy is produced by conversion of chemical energy via redox reactions (Faradic process) at the anode and cathode. On the other hand, in ECs, energy may not be delivered via redox reactions but rather via the formation of electrical double layers (non-Faradic process) by orientation of electrolyte ions at the electrode/electrolyte interface, and thus the use of the terms anode and cathode may not be appropriate [2].
7
In order to value the energy contents of a system, terms of “energy density” (or “specific energy”) and “power density” (or “specific power”) are used. “Energy density” is expressed in watt-hours per liter (Wh/L) [or in watt-hours per kilogram (Wh/kg)] and “power density” is expressed in watt per liter (W/L) [or in watt per kilogram (W/kg)] [2]. To compare the performance of various energy storage devices, a reprehensive chart known as the Ragone plot was developed. In such a plot, the values of specific energy (in Wh/kg) are plotted versus specific power [3], as shown in Figure 1.1. It is clear to see that fuel cell can be considered as high energy density system and supercapacitor as high power density system. However, battery has intermediate energy and power characteristics. Compared to fuel cells and supercapacitors, batteries have realized the biggest application markets so far. Whereas supercapacitors have found its own position as memory protection in several electronic devices and instantaneous power backup systems, fuel cells are basically still in the development stage [1].
8
Figure 1.1. Ragone plot showing energy density vs. power density for various energy storage devices. Cited and modified from Ref. [3].
1.2 Rechargeable Lithium Based Battery
There are two types of batteries: primary batteries that are designed to be used once and discarded, and secondary batteries that are designed to be recharged and used multiple times. Therefore, they are also named as disposable batteries and rechargeable batteries. Common types of disposable batteries such as zinc–carbon battery cannot be reliably recharged, since the chemical reactions are not easily reversible and active materials cannot recover to the original forms
[4]. On the other hand, electrochemical reactions in rechargeable batteries such as nickel-cobalt battery and lithium-based batteries are electrically reversible.
9
of volumetric and gravimetric energy density. Cited from Ref. [5].
Considering the requirements of modern society with popular portable electronics, rechargeable batteries are more favorable nowadays. The development of rechargeable batteries is a long story. To this date, among various existing technologies, such as lead-acid, Ni-Cd, nickel-metal hydride (Ni-MeH), Li-based batteries draw the most attention because of their high energy density and possibility of compact-flexible design, as indicated in Figure 1.2. Combining the profound mechanism study and the involvement of advanced materials, they have become the most dominant power source for cell phones, digital cameras, laptops etc. According to the recent market investigation, the share of worldwide sales for Ni–Cd and Ni–MeH batteries are 23 and 14%. However, Li-ion portable batteries take up to 63% of the battery market [5].
The starting point of incorporating lithium metal in battery technology is the fact that lithium is the most electropositive (–3.04 V Vs standard hydrogen electrode) as well as the lightest (specific gravity ρ=0.53 g cm–3) metal which benefits the design of high energy density system [5]. Lithium metal as an anode was firstly reported in 1970 where TiS2 was used as a cathode [6-8]. However, Li-metal cell encountered many problems. One of shortcomings is redeposition of lithium as a form of metal and uneven dendrite formation during subsequent charge/discharge cycle, as shown in Figure. 1.3a. This could lead to a short
10
circuit problem and thus explosion issues [9]. Therefore, even though Li-metal based cells exhibit the highest energy density as shown in Figure 1.2, their practical application is limited. Upon the inspiration of the development on the positive electrode which used LixMO2 (where M is Co, Ni or Mn) as a host material for Li ions [10-11], the Li metal is not necessarily required, therefore a concept so-called Li-ion or rocking-chair battery which introduced a second host material to replace Li metal was emerged to solve the safety issues in rechargeable Li-metal battery, as shown in Figure 1.3b [12-15].
11
Rechargeable lithium-metal battery, dendrite formation was shown in the negative electrode. b, Rechargeable lithium-ion battery. Cited from Ref. [5].
1.3 Rechargeable Lithium Ion Battery
The configuration of Li-ion battery electrodes is two types of lithium host materials (Figure 1.3b). The storage capacity of the battery is given by the amount of Li that can be stored reversibly in these two electrodes. To be clear, for rechargeable Li-metal batteries, the positive host electrode does not need to be lithiated before cell assembly since the use of metallic Li as the negative electrode. In contrast, for Li-ion batteries, the positive host electrode usually acts as a source of Li since the common negative electrode such as carbon, Si, transition metal oxide contains no Li. Thus, air-stable Li-based intercalation compounds in positive electrode are required to complete the cell assembly.
The structural stability of the host material during insertion and de-insertion of Li ions is a critical factor since it determines the long term stability of Li-ion battery. Generally, anode materials can be classified into three categories according to the Li storage mechanisms besides graphite: alloying, insertion, conversion. Most of these materials show different disadvantages compared to graphite, as indicated in Figure 1.4. In the case of Li alloy (Si, Sn, Ge, Al, Pb etc) and conversion-based electrodes (CoO, Fe2O3 etc), the volume change
12
between the Li-containing states and the corresponding lithium-free states is very large due to the mechanical stresses generated during charge/discharge cycles. Therefore, the cracks are easily produced and thus the electrodes collapse. So the cycle life is very much limited. In the case of insertion based materials (TiO2, MoO2 etc), rather low capacity is the key factor needed to be improved. In contrast, materials with two dimensional layered structure such as carbonaceous materials, show good cycling behavior since this kind of Li+ insertion materials exhibits low mechanical strain with small volume changes [2, 5, 12-15]. At the present time, research and development activities are mainly focused on such highly reversible carbonaceous materials.
Figure 1.4. Current issues remaining in different types of anode materials.
13
Bibliography of Chapter 1
[1] M. Winter, R. J. Brodd, Chem. Rev 2004, 104, 4245.
[2] B. E. Conway, Electrochemical Supercapacitors: Scientific Fundamentals and Technological Applications 1999.
[3] The plot shown here is based on the data provided by Maxwell Technologies: http://www.maxwell.com.
[4] Alkaline Manganese Dioxide Handbook and Application Manual, 2008.
[5] J. M. Tarascon, M. Armand, Nature 2001, 414, 359.
[6] T. Ikeda, H. Tamura, Proc. Manganese Dioxide Symp. 1975, Vol. 1, (IC sample Office, Cleveland, OH).
[7] M. S. Whittingham, Science 1976, 192, 1226.
[8] M. S. Whittingham, US Patent 4009052.
[9] F. Orsini, et al., J. Power Sources 1999, 81, 918.
[10] K. Mizushima, P. C. Jones, P. J. Wiseman, J. B. Goodenough, Mat. Res.
Bull.1980, 15, 783.
[11] M. M. Thackeray, W. I. F. David, P. G. Bruce, J. B. Goodenough, Mat.
Res. Bull. 1983, 18, 461.
[12] D. W. Murphy, F. J. DiSalvo, J. N. Carides, J. V. Waszczak, Mat. Res. Bull. 1978, 13, 1395.
[13] M. Lazzari, B. Scrosati, J. Electrochem. Soc.1980, 127, 773.
[14] M. Mohri, et al., J. Power Sources 1989, 26, 545.
14
15
Outline of Chapter Two
Carbonaceous Materials as an Anode of Li-Ion Battery
2.1
Operation Mechanism of Li-Ion Battery
16
2.2
Classification of Carbonaceous Materials
21
2.2.1
Graphitic Carbon
21
2.2.2
Non-graphitic Carbon
22
2.3
Lithium Intercalation into Carbonaceous Materials
24
2.3.1
Lithium Intercalation into Graphitic Carbon Materials
24
2.3.1-1 Description
24
2.3.1-2 Charge/Discharge Profile of Graphitic Carbon Materials
26
2.3.2
Lithium Intercalation into Non-graphitic Carbon Materials
29
2.3.2-1 Low Specific Charge Carbon
29
2.3.2-2 High Specific Charge Carbon
31
2.4
Summary of Chapter Two
36
16
C
HAPTERT
WOCarbonaceous Materials as an Anode of Li-Ion Battery
2.1 Operation Mechanism of Li-Ion Battery
Carbon as one of the most abundant elements on earth plays a critical role in the development of human society. For thousands of years, human history is closely associated with the struggle to extract and utilize the power from carbon materials. Carbonaceous materials have been adopted in various electrochemical energy storage systems previously. This was motivated by the good electrical conductance of sp2-hybridized solid carbon, its high chemical stability, and its enormous adaptability to different interface processes [1]. Li-ion battery is one typical example to utilize the carbonaceous materials in energy storage devices. Commercialized LIB usually consists of layered LiCoO2 as a cathode and carbonaceous materials as an anode. These two electrodes are usually separated by a porous polymer membrane and the ionic transport within the cell is ensured by an aprotic organic electrolyte which is a good ionic conductor and electronic insulator [2]. Nowadays, the most common electrolyte is a solution of LiPF6 in a mixture of alkyl carbonates such as ethylene carbonate, diethyl carbonate, and dimethyl carbonate which provides high-permittivity and low-viscosity.
In common Li-ion battery cells, during the charging process, Li ions are extracted from the LiCoO2 electrode (cathode) and simultaneously
17
inserted/intercalated into the carbon electrode (anode) by forming a lithium/carbon intercalation compound indicated as LixCn, coupled with negatively charged electrons to keep overall charge neutrality, as shown on the left side of Figure 2.1. During the discharging process, Li ions are reversibly extracted/deintercalated from the negative electrode and simultaneously inserted into the positive electrode, as shown on the right side of Figure 2.1. This charge/discharge process can be summarized by the typical chemical equations as shown below [3]:
Figure. 2.1. Schematic illustration of detailed charge/discharge process in Li-ion battery.
Positive Electrode: LiCoO2 Li1-x CoO2 + xLi+ + xe- Negative Electrode: Cn + xLi+ + xe- LixCn
18
Compared to ECs whose electrodes are composed of same materials which therefore exhibit the same potential, an inherent potential difference exists between LiCoO2 and carbonaceous material in LIB, as simply indicated in Figure 2.2. The original potentials of LiCoO2 and carbon materials are usually ~ 4 V and ~ 0.2-0.5 V (depending on types of carbon) vs. Li/Li+, respectively [2,4]. During the charge process, the cathode will release Li+ under the influence of external power and the potential of cathode will increase to 4.2 V, whereas the anode potential will decrease to approximately 0.01 V vs. Li/Li+ upon Li ion insertion, thus delivering an output voltage of nearly 4 V to the external load. Here, the cut off voltage of LiCoO2 and graphite is usually limited to 4.2 (corresponding to a removal of 0.5 mol Li) and 0.01 V in order to maintain the structural stability [5]. On the other hand, during the spontaneous discharge process, Li0.5CoO2 needs to go back to its original potential state which is more energetically stable therefore Li ions go back to Li0.5CoO2 and the electrode potential goes back to the original state, and the system is thus ready for the next charge process.
19
Figure 2.2. Potential profile of anode and cathode during charge/discharge.
The discovery of different carbon allotropes associated with nanoscience and nanotechnology provided us a room to further improve the performance of anode material. Therefore, carbonaceous material used as an anode in LIB is chosen to be the main focus in this work. Before moving to the details, we summarize one more time the advantages of carbon-based anode material. Compared to transition-metal oxides and chalcogenides, carbonaceous materials such as graphite and hard carbons are more preferable not only because of (1) the unstable inherent nature of the transition-metal oxides and chalcogenides materials as mentioned at the end of Chapter 1 and (2) the dimensional stability and good conductivity of carbonaceous materials, but also (3) the lowest potential versus Li/Li+ which gives higher output cell voltage compared to other composite alloys, three dimensional metal oxides and so on. For instance, the potential of many Li alloys is ~0.3 to ~1.0 V vs. Li/Li+ whereas it is only ~0.1 V vs. Li/Li+ for graphite, as indicated in Figure 2.3 [6].
20
Figure 2.3. Charge curves of different metals (M) with respect to highly oriented turbostratic pitch carbon fibers. Cited from Ref. [6].
One good carbonaceous anode material needs to fulfill high capacity, long cycle life, fast charge etc. in addition to high energy/power density, good conductivity and stability, as mentioned above. A charge/discharge curve can be used as one of the most straightforward tools to demonstrate the storage capability, cyclic ability, rate of charge/discharge. The charge/discharge curve (capacity-voltage curve) is converted from a voltage-time profile with one or several constant current densities that are fixed in advance. The capacity (mAh) therefore equals to the current (mA) multiply the time (h). The charge/discharge curve usually exhibits very different features according to the structure of carbon materials. Thus, in order to further improve the performance of carbonaceous anode and to assist in explaining the phenomenon of nanocarbon-based anode later, the classification of carbon materials upon the structure and also their
21
associated charge/discharge profiles need to be elaborated first. The related topics are explained in detail in the following section.
2.2 Classification of Carbonaceous Materials
Carbonaceous materials that are capable of reversible lithium reaction can be roughly classified into two categories according to their structures: graphitic and non-graphitic (disordered) carbon. The non-graphitic carbon can be further categorized into soft carbon/hard carbon upon annealing and high specific charge carbon/low specific charge carbon according to the capability of reversible lithium storage. Charge/discharge behaviors of each type of carbon are presented and analyzed in detail in the following context.
2.2.1 Graphitic Carbon
Graphitic carbon is a well-defined layered structure. Normally, a number of structural defects could appear in graphitic carbon. The term of “graphite” was derived from crystallographic point of view which should be only applied to carbons whose layered lattice structure follows a perfect stacking order of graphene layers. That is to say it contains the layer stacking order of either the common AB (hexagonal graphite, Figure 2.4 and Figure 2.5a) or the rather rare ABC (rhombohedral graphite). However, since the transformation energy from AB stacking to ABC stacking (and vice versa) is rather small, perfectly stacked graphite crystals are not readily available. Therefore the term of “graphite” is
22
often used regardless of well-defined stacking order [7]. The terms of natural graphite, artificial graphite, and pyrolytic graphite are commonly used, although the materials are polycrystalline [8]. The actual structure of carbonaceous materials typically deviates more or less from the ideal graphite structure. Materials consisting of aggregates of graphite crystallites are called graphites as well.
Figure 2.4. Left: Schematics of the crystal structure of hexagonal graphite with an AB stacking order. Right: view perpendicular to the basal plane of graphite. Edges can be subdivided into arm-chair and zigzag faces. Cited from Ref. [7].
2.2.2 Non-Graphitic Carbon
Non-graphitic (disordered) carbonaceous materials consist of carbon atoms that are mainly arranged in a planar hexagonal network but no crystallographic order in the c-direction compared to graphite, as shown in Figure 2.5c [7,9]. The
23
structure of those carbons is characterized by amorphous areas embedded and cross-linked in the network. Non-graphitic carbons are mostly prepared by pyrolysis of organic polymer or hydrocarbon precursors at temperature below ~1500°C [10-12].
(a) graphite (b) graphitizable carbon (c) non-graphitizable carbon
Figure 2.5. Schematic indications of (a) graphite and (b) non-graphitic (disordered) carbonaceous material.
Heat treatment of most non-graphitic carbons (from ~1500 to ~3000°C) allows us to further classify non-graphitic carbon into two sub-categories: soft carbon and hard carbon. In the case of soft carbons, crosslinking between the carbon layers is weak and therefore the layers are mobile enough to form graphite-like crystallites and develop the graphite structure continuously during the heating process, as shown in Figure 2.5b [9]. In the case of hard carbons, since the carbon layers are immobilized by crosslinking, they show no real development of the graphite structure even at temperatures of 2500 ~ 3000 °C
24
2.3 Lithium Intercalation into Carbonaceous Materials
2.3.1 Lithium Intercalation into Graphitic Carbon Materials
2.3.1-1 Description
Lithium-intercalated graphitic carbon compounds (GICs) are known with the configuration LixCn. It is well known that Li intercalation reaction occurs only at the edge plane of graphite. Through the basal plane, intercalation is possible only at defect sites [13-16]. The maximum lithium content for highly crystalline graphitic carbons is one Li guest atom per six carbon host atoms (i.e. n 6 in LiCn or x 1 in LixC6) at ambient pressure [17]. That is to say it follo ws the equation as below:
6 C + x Li+ +x e- LixC6, where, x = 1 in LixC6 (the maximum Li conte nt).
In LiC6, lithium avoids to occupy the nearest neighbor sites due to the Columbic repulsive force of Li, as shown in Figure 2.6. Two major changes in graphite structure point of view occur when Li intercalats into graphite layers: (1) the stacking order of the carbon layers (i.e. graphene layers) shifts to AA stacking, see Figure 2.6a and Figure 2.6c. (2) The interlayer distance between the graphene layers increases moderately (10.3% has been calculated for LiC6) due to the lithium intercalation, as indicated in the right panel in Figure 2.6a [18-21].
25
Figure 2.6. Structure indications of LiC6. (a) Left: schematic drawing showing the AA layer stacking sequence with Li intercalation. Right: simplified representation. (b) Perpendicular view to the basal plane of LiC6. (c) Enlarged schematic of AA stacking order. Cited and modified from Ref. [20-21].
An important feature of Li intercalation into graphite is the “stage formation”. Stage formation means a stepwise formation of a periodic pattern of unoccupied graphitic layer gaps at low concentrations of Li [23-31]. This stepwise process can be described by the stage index, s (s = I, II, III, IV) which is equal to the number of graphene layers between two nearest guest layers as shown in Figure 2.7. Note that stage IV is not indicated in the figure because Li concentration is too low in graphene layers. It is also known as a dilute stage
26
when s > IV [32]. Two factors determine the formation of stages during Li intercalation into graphite i) the energy required to expand van der Waals gap between two graphene layers [31,33] and ii) the repulsive interactions between guest species. Therefore, compared to a random distribution of Li in the graphitic layers during charge process, Li ions prefer to occupy van der Waals gaps with high density first to reach an energetically stable state [7].
Figure 2.7. Schematic indication of stage formation during Li ion intercalation into graphite layers.
2.3.1-2
Charge/Discharge Profile ofGraphitic Carbon Materials
Stage formation as mentioned above is one of the most important characteristic of charge profile for graphitic carbon. It can be easily observed in the form of plateaus by constant current measurement (i.e. in charge/discharge curve), as indicated in Figure 2.8. The associated stages are marked in bottom
27
panel of the figure. The plateaus indicate the coexistence of two phases [24,34]. The formation of stages II, IIL (a transition stage of stage II and stage III), III, and IV have been identified from experimental electrochemical curves [18,35,37-40] and confirmed by X-ray diffraction and Raman spectroscopy
[17,25,27-28,35-38]. A schematic potential / composition curve for galvanostatic reduction
of graphite to LiC6 isshown in the bottom panel in Figure 2.8.
Figure 2.8. Constant current charge/discharge curves of the graphite
(Timrex KS 44, Cirr is the irreversible specific charge, and Crev is the
28
Ideally, Li+ intercalation into carbons should be fully reversible and the maximum Li storage capacity should not exceed 372 mAh/g according to LiC6 configuration. However, the charge accumulated in the first cycle usually larger than the maximum theoretical specific capacity, as shown in Figure 2.8. Compared to the first charge, the first discharge capacity is much smaller. The excess charge generated in the first cycle which cannot be recovered can be ascribed to a film formation of the solid electrolyte interface (SEI) which is caused by the decomposition of the Li+ containing electrolyte, such as propylene carbonate and ethylene carbonate [41-46]. The decomposition of electrolyte usually takes place at less than 1 V vs. Li/Li+ and appears as the first plateau in the charge curve, as indicated in Figure 2.8 [47]. The advantage of the SEI formation is that it can prevent further electrolyte decomposition and create a rather stable state for the surface of GIC [48-53]. On the other hand, the formation of SEI is a charge-consuming side reaction in the first few Li+ intercalation/deintercalation cycles, especially in the 1st charge cycle. Considering that the positive electrode is responsible to provide the Li ion in LIB, the charge and lithium losses are detrimental to the specific energy of the whole cell and have to be minimized. Because of the irreversible consumption of lithium and electrolyte, a corresponding charge loss exists, so called “irreversible specific charge” as indicated in Figure 2.8. The reversible lithium intercalation is called “reversible specific charge”.
29
2.3.2 Lithium Intercalation into Non-Graphitic Carbon Materials
According to the capability of reversible lithium storage, non-graphitic carbons can be further classified into two categories: high specific charge carbon and low specific charge carbon.2.3.2-1 Low Specific Charge Carbon
(i) DefinitionLow specific charge carbons are carbonaceous materials which incorporate only a considerably lower amount of lithium than graphite. That is to say it follo ws the equation as below:
6C + xLi+ +xe- LixC6, where x = 0.5~0.8 in LixC6 at the maximum stoichiometry.
(ii) Examples of Low Specific Charge Carbon
Cokes [68,77-83] and carbon blacks [81,84-85] are typical disordered carbons with low specific charges. During the charge process, Li intercalation-induced formation of AA stacking is hindered due to the existence of crosslinking of carbon sheets as mentioned in chapter 2.1.2. This will eventually affect the accommodation of a higher Li amount into graphitic sites and deliver a lower specific charge [86-88].
30
Turbostratic carbon [43,86-90] which can also be classified into the category of graphitizing/soft carbon is one type of low specific charge carbon. The lower amount of Li intercalation than graphite is due to not only the effect of crosslinking as mentioned in cokes and carbon blacks, but also larger amount of wrinkled and buckled structural segments existing in the structure, and thus available lithium intercalation sites is rather low therefore the specific charge is lower than graphite [91-92].
(iii) Charge/Discharge Profile of Low Specific Charge Carbon
Figure 2.9 shows the first Li+ intercalation/deintercalation cycle of a coke-containing electrode. The potential profile of low specific carbon differs considerably from that of graphite, as the reversible intercalation of Li+ begins at around 1.2 V vs. Li/Li+, and the curve slopes without distinguishable plateaus. This behavior is a consequence of the disordered structure providing electronically and geometrically nonequivalent sites, whereas for a particular intercalation stage in highly crystalline graphite, the sites are equivalent [93-94].
31
Figure 2.9. Constant current charge/discharge curves of a coke (Conoco).
(Cirr is the irreversible specific charge, Crev the reversible specific charge).
Cited and redrawn from Ref. [7].
2.3.2-2 High Specific Charge Carbon
(i) DefinitionHigh specific charge carbons can store more lithium than graphite. That is to say it follows the equation as below:
32
6 C + x Li+ +x e- LixC6, where x > 1 in LixC6.
Li storage capacity of high specific charge carbons could vary from 400 Ah/kg to ~2000 Ah/kg which corresponding to x = ~1.2 to ~5 in LixC6. The difference in the capacity depends on the heat treatment temperature, organic precursor, and electrolyte. Even though the higher specific capacity (in terms of Ah/kg) is desired in LIB, a larger volume of the carbonaceous matrix is usually needed to accommodate the excess intercalated Li which indicates lower charge density in terms of Ah/L [7].
(ii) Origin of the Excess Charges
Several different scenarios have been proposed in order to explain origin of excess charges. These different models provide the intuitive understanding even though some of them are still debatable [54-58]. A few well known examples are listed below. Extra capacity can be realized through: (1) The formation of Li2 molecules between layers which indicates that lithium molecules occupy the nearest neighbor sites in intercalated carbons [59]. (2) The presence of charged Li+ clusters in the cavities [60]. (3) The “adsorption” of lithium on both sides of single-layer sheets that are arranged like a “falling cards” [61]. All of mechanisms are indicated in Figure 2.10.
33
Figure 2.10. a) Storage mechanisms of Li ions in graphite. b) Li storage in a form of Li2 covalent molecules. c) Schematic model of Li storage in cavities and nanopores. d) Li adsorption on the two sides of an isolated graphene sheet. Cited from Ref. [3].
(iii) Charge/discharge Profile of High Specific Charge Carbon
For both graphitizing (soft) and non-graphitizing (hard) carbons prepared < 1000 oC, the typical charge/discharge profile is shown in Figure 2.11.
34
Figure 2.11. Constant current charge/discharge curves (1st and 2nd cycle) of a high specific charge carbon material after heat treatment at 700 °C. (Cirr
is the irreversible specific charge, Crev the reversible specific charge). Cited
and redrawn from Ref. [7].
It is clear to see a SEI-related plateau appears at around 0.6V and a high specific charge of around 3720 Ah/kg was achieved during the first charge, as
35
shown in the top panel in Figure 2.11. The special feature of this kind of carbon material is that it exhibits a larger voltage hysteresis between charge and discharge processes compared to that of graphite (Figure 2.8). To be more specific, the second charge/discharge is shown at the bottom of Figure 2.11 which does not show the effect of SEI. The potential for Li insertion is close to 0 V vs. Li/Li+ whereas the one for Li de-insertion is much more positive [54-55,62-65] in the second charge/discharge process. According to the previous study, it has been shown that the extent of hysteresis is proportional to the hydrogen content in the carbon since Li is somehow bound near the hydrogen [66-67].
Since hydrogen can be removed with increasing temperature, the specific charges achieved after the removal of hydrogen need to be evaluated. It was found that the value of specific charge after high temperature annealing strongly depend on the structure of the non-graphitic material [55,65,68-75]. (i) In the case of soft carbon, it will deliver a lower value of specific charge (x < ~0.5 in LixC6) which is similar to the low specific charge carbon [54,75-76], when heat treated at ~1000 °C. And the specific charge again increases when the temperature is > 1000 °C [73,74]. (ii) In the case of hard carbon, it can still display a specific charge of several hundred Ah/kg when heat-treated at ~1000 ° C. But Li inserts at a very low potential of a few millivolts versus Li/Li+ and a smaller hysteresis is shown in charge/discharge profile. In contrast to soft carbon, a drastically reduction of specific charge is observed when the temperature is >
36
1000 °C [72,76].
Although the high specific charge carbons show much higher specific capacity than graphite, they have some serious drawbacks such as higher irreversible specific charges, larger hysteresis and poorer cycling performance than graphite [54-55,62,95-96,98,100-101,103-104]. Although the cycling performance of non-graphitizing (hard) carbons heat-treated at ~1000 °C is reasonable and almost no hysteresis occurs, the end of the charge potential of the carbons is very close to metallic lithium [62,75,102]. Under such a charging regime, lithium deposition occurs, which will induce safety issue like Li-metal battery [7].
2.4 Summary of Chapter Two
The operation mechanism of Li-ion battery and the charge/discharge behavior based on different types of carbonaceous materials were generally reviewed in this chapter. This kind of information provides fundamental knowledge to characterize and understand the anodic behavior of nanoscaled carbon materials which will be covered in Chapter 3.
Based on this chapter, it is clear to see that there are so many unsolved issues related to carbonaceous materials. In the case of graphite, it exhibits good cyclic performance and structure stability but the capacity is limited. On the
37
contrary, in the case of high specific carbon, the capacity is higher than that of graphite but the long time stability and safety issues remain unsolved.
Although the current understanding of the origins of excess charge is limited, it is clear that numerous factors such as surface area, crystallinity, defect population, basal/edge plane effects and so on could affect the storage capacity. Compared to graphite, the analysis of non-graphitic carbon is more complicated since so many unpredictable factors exist. Ahead of understanding of Li storage mechanisms and the realization of high capacity anode materials, one preliminary issue still remains unclear, that is the Li diffusion pathway in carbonaceous materials. Therefore, further understanding of Li diffusion pathway through graphene plane and the role of defects in Li diffusion is highly required to provide more information to reveal the mystery of Li-C system. In order to improve the limited capacity of graphite and also to overcome various problems in non-graphitic carbons, incorporation of a second material which contains higher Li storage capacity on rather stable carbon matrix could be an alternative way to satisfy the requirements on anode part. The related issues will be further discussed in Chapter 4.
38
Bibliography of Chapter Two
[1] S. L. Candelaria, Y. Y. Shao, W. Zhou, X. L. Li, J. Xiao, J. G. Zhang, Y. Wang, J. Liu, J. H. Li, G. Z. Cao, Nano Energy 2012, 1,195.
[2] J. M. Tarascon, M. Armand, Nature 2001, 414, 359.
[3] D. S. Su, R. Schlögl, ChemSusChem 2010, 3, 136.
[4] B. Xu, D. Qian, Z. Wang, Y. Meng, Materials Science and Engineering
R 2012, 73, 51..
[5] T. Ohzuku, A. Ueda, N. Nagayama, Y. Iwakoshi, H. Komori,
Electrochim Acta 1993, 38, 1159.
[6] J. O. Besenhard, J. Yang, M. Winter, J. Power Sources 1997, 68, 87.
[7] M. Winter, J. O. Besenhard, M. E. Spahr, P. Novák, Adv. Mater. 1998,
10, 725
[8] H. O. Pierson, Handbook of Carbon, Graphite, Diamond and Fullerenes, Noyes, Park Ridge, NJ 1993, 43.
[9] I. Mochida, S. Yoon, W. Qiao, J. Braz. Chem. Soc. 2006, 17 (6), 1059.
[10] R. E. Franklin, Proc. R. Soc. London A 1951, 209, 196..
[11] K. Kinoshita, Carbon: Electrochemical and Physicochemical Properties 1987 Wiley, New York..
[12] K. Inada, K. Ikeda, Y. Sato, A. Itsubo, M. Miyabashi, H. Yui, in Primary
and Secondary Ambient Temperature Lithium Batteries (Eds: J.-P.
Gabano, Z. Takehara, P. Bro), Electrochemical Society, Pennington, NJ 1988, 88-6, 530.
[13] T. Tran, K. Kinoshita, J. Electroanal. Chem. 1995, 386, 221.