En vue de l'obtention du
DOCTORAT DE L'UNIVERSITÉ DE TOULOUSE
Délivré par :
Institut National Polytechnique de Toulouse (Toulouse INP)
Discipline ou spécialité :
Réseaux, Télécommunications, Systèmes et Architecture
Présentée et soutenue par :
M. SAMER EL ZANT
le vendredi 6 juillet 2018
Titre :
Google matrix analysis of Wikipedia networks
Ecole doctorale :
Mathématiques, Informatique, Télécommunications de Toulouse (MITT)
Unité de recherche :
Institut de Recherche en Informatique de Toulouse (I.R.I.T.)
Directeur(s) de Thèse :
M. DIMA SHEPELYANSKY MME KATIA JAFFRES-RUNSER
Rapporteurs :
M. MARIO ARIOLI, UNIVERSITA LUM JEAN MONNET M. PIERRE BORGNAT, CNRS
Membre(s) du jury :
M. PIERRE BORGNAT, CNRS, Président
M. DIMITRI SHEPELYANSKY, CNRS TOULOUSE, Membre M. JOSE LAGES, UNIVERSITE DE FRANCHE COMTE, Membre
Mme KATIA JAFFRES-RUNSER, INP TOULOUSE, Membre Mme SANDRINE MOUYSSET, UNIVERSITE TOULOUSE 3, Membre
iii
Acknowledgments
Sincere gratitude to my supervisors Dr. Katia Jaffrès-Runser and Prof. Dima L. Shepelyansky for encouraging my research and supporting my PhD years while also providing the opportunity to enrich my knowledge through participation in international conferences. I thank him for enrolling me in a doctoral courses and schools and giving me the chance for teaching which improved my teaching and research skills.
Furthermore, I would like to thank my PhD committee members, Prof. Pierre Borgnat, Prof. Mario Arioli, Dr. Sandrine Mouysset and Dr. José Lages for reading and reporting my manuscript.
My thanks and appreciations also go to my colleagues in the "IRIT" for their help, support and collaboration to succeed my PhD. It was a pleasure working with all the partners in the project.
Special thanks to Dr. Farouk, Dr. Aziz, Dr. Karim and Eng. Fouad for helping me during my PhD years. Big thanks to all my friends for all their moral and professional support.
Deep appreciation to my family for the great assistance and extended support. I am especially grateful to my mother Samira and my father Amid for their unconditional support during my three years of working hard to complete my thesis and also achieving my career objectives. Thank you both for giving me strength to chase my dreams.
I would like to give special thanks to my brothers and sisters, Nahla, Abir, Manal, Majed, Bassem for encouraging me in all of my pursuits. Sin-cere words of gratitude and respect are preserved for my eldest sister Dr. Nahla for providing the necessary financial and academic support. Besides, I want to thank my sister Manal and my brother Bassem for being my family in a foreign country working on my thesis and building my future.
A tender thought to my nieces and nephews, Fadi, Ayman, Ryma, Samer, Sirine, Lara, Amid, Lyne, Amir, Sarah and Clara who embellished my life by their innocence.
v
Résumé
Cette thèse s’intéresse à l’analyse du réseau dirigé extrait de la structure des hyperliens de Wikipédia. Notre objectif est de mesurer les interactions liant un sous-ensemble de pages du réseau Wikipédia. Par conséquent, nous proposons de tirer parti d’une nouvelle représentation matricielle appelée matrice réduite de Google ou "reduced Google Matrix". Cette matrice ré-duite de Google (GR) est définie pour un sous-ensemble de pages donné (c-à-d un réseau réduit). Comme pour la matrice de Google standard, un composant de GR capture la probabilité que deux nœuds du réseau réduit soient directement connectés dans le réseau complet. Une des particular-ités de GR est l’existence d’un autre composant qui explique la probabilité d’avoir deux nœuds indirectement connectés à travers tous les chemins pos-sibles du réseau entier.
Dans cette thèse, les résultats de notre étude de cas nous montrent que GR offre une représentation fiable des liens directs et indirects (cachés). Nous montrons que l’analyse de GR est complémentaire à l’analyse de "PageRank" et peut être exploitée pour étudier l’influence d’une variation de lien sur le reste de la structure du réseau. Les études de cas sont basées sur des réseaux Wikipédia provenant de différentes éditions linguistiques. Les interactions entre plusieurs groupes d’intérêt ont été étudiées en détail : peintres, pays et groupes terroristes. Pour chaque étude, un réseau réduit a été construit. Les interactions directes et indirectes ont été analysées et confrontées à des faits historiques, géopolitiques ou scientifiques. Une anal-yse de sensibilité est réalisée afin de comprendre l’influence des liens dans chaque groupe sur d’autres nœuds (ex : les pays dans notre cas). Notre analyse montre qu’il est possible d’extraire des interactions précieuses entre les peintres, entre les pays et entre les groupes terroristes. On retrouve par exemple, dans le réseau de peintres issu de GR, un regroupement des artistes par grand mouvement de l’histoire de la peinture. Les interactions bien con-nues entre les grands pays de l’UE ou dans le monde entier sont également soulignées/mentionnées dans nos résultats. De même, le réseau de groupes terroristes présente des liens pertinents en ligne avec leur idéologie ou leurs relations historiques ou géopolitiques.
Nous concluons cette étude en montrant que l’analyse réduite de la matrice de Google est une nouvelle méthode d’analyse puissante pour les grands réseaux dirigés. Nous affirmons que cette approche pourra aussi bien s’appliquer à des données représentées sous la forme de graphes dynamiques. Cette approche offre de nouvelles possibilités permettant une analyse effi-cace des interactions d’un groupe de nœuds enfoui dans un grand réseau dirigé.
Abstract
This thesis concentrates on the analysis of the large directed network repre-sentation of Wikipedia. Wikipedia stores valuable fine-grained dependencies among articles by linking webpages together for diverse types of interactions. Our focus is to capture fine-grained and realistic interactions between a sub-set of webpages in this Wikipedia network. Therefore, we propose to lever-age a novel Google matrix representation of the network called the reduced Google matrix. This reduced Google matrix (GR) is derived for the subset of webpages of interest (i.e. the reduced network). As for the regular Google matrix, one component of GR captures the probability of two nodes of the reduced network to be directly connected in the full network. But unique to GR, another component accounts for the probability of having both nodes indirectly connected through all possible paths in the full network.
In this thesis, we demonstrate with several case studies that GR offers a reliable and meaningful representation of direct and indirect (hidden) links of the reduced network.We show that GR analysis is complementary to the well-known PageRank analysis and can be leveraged to study the influence of a link variation on the rest of the network structure. Case studies are based on Wikipedia networks originating from different language editions. Inter-actions between several groups of interest are studied in details: painters, countries and terrorist groups. For each study, a reduced network is built, direct and indirect interactions are analyzed and confronted to historical, geopolitical or scientific facts. A sensitivity analysis is conducted to under-stand the influence of the ties in each group on other nodes (e.g. countries in our case). From our analysis, we show that it is possible to extract valu-able interactions between painters, between countries or between terrorist groups. Network of painters with GR capture art historical fact such a painting movement classification. Well-known interactions of countries be-tween major EU countries or worldwide are underlined as well in our results. Similarly, networks of terrorist groups show relevant ties in line with their objective or their historical or geopolitical relationships.
We conclude this study by showing that the reduced Google matrix anal-ysis is a novel powerful analanal-ysis method for large directed networks. We ar-gue that this approach can find as well useful application for different types of datasets constituted by the exchange of dynamic content. This approach offers new possibilities to analyze effective interactions in a group of nodes embedded in a large directed network.
Table of Contents
1 Introduction 1
1.1 Complex networks . . . . 1
1.2 Modeling complex networks . . . . 1
1.2.1 Measuring network properties . . . . 2
1.2.2 Models of complex networks . . . . 2
1.2.3 Wikipedia network model . . . . 5
1.3 Google matrix and PageRank . . . . 6
1.3.1 Node centrality metrics . . . . 6
1.3.2 Markov chains . . . . 9
1.3.3 Google Matrix and PageRank . . . . 11
1.4 Motivation . . . . 15
1.5 Contributions . . . . 17
1.6 Publications related to this thesis . . . . 18
1.6.1 Journal articles . . . . 18
1.6.2 Conference proceedings . . . . 18
1.6.3 Talks . . . . 18
1.6.4 Submitted journal articles . . . . 18
2 Reduced Google matrix theory 21 2.1 Introduction . . . . 21
2.2 Reduced Google matrix . . . . 21
2.3 Numerical evaluation of GR . . . . 24
2.4 Decomposition of GR . . . . 25
3 Hidden relationships between painters 27 3.1 Introduction . . . . 27
3.2 Top Painters . . . . 28
3.3 Painter set selection . . . . 31
3.4 Density plots of GR, Grr and Gqrnd . . . . 33
3.5 Building a friendship network . . . . 34
3.5.1 Friendship . . . . 34
3.5.2 Networks of 30 painters . . . . 35
3.6 Conclusion . . . . 36
4 Multi-cultural mining of geopolitics interactions 39 4.1 Introduction . . . . 39
4.2 Matrices of world countries . . . . 41
4.2.1 Selected countries . . . . 44
4.2.2 Density plots of GR, Grr and Gqrnd . . . . 44
4.3 Networks of 40 countries . . . . 48
4.4 Conclusion . . . . 51
5 Sensitivity analysis of networks 53 5.1 Introduction . . . . 53
5.2 Data Description . . . . 54
5.3 Results: GR properties . . . . 57
5.3.1 Reduced Google matrix of country networks . . . . 57
5.3.2 Networks of friends and followers . . . . 60
5.4 Influence analysis of geopolitical ties using GR . . . 63
5.4.1 Sensitivity analysis . . . . 64
5.4.2 Relationship imbalance analysis . . . . 64
5.5 Sensitivity results for country networks . . . . 65
5.5.1 27 EU network of countries . . . . 65
5.5.2 40 worldwide network of countries . . . . 76
5.6 Influence of painters on countries. . . 85
5.6.1 Datasets . . . . 85
5.6.2 Networks of painters and countries . . . . 87
5.6.3 Influence of painters on countries . . . 91
94 5.7 Conclusion . . . . 6 Analysis of world terror networks 97 6.1 Introduction . . . . 97
6.2 Results . . . 101
6.2.1 Network structure of groups . . . 101
6.2.2 Relationships between groups and countries . . . 104
6.2.3 Sensitivity analysis . . . 107
6.3 Discussion . . . 108
7 General conclusion and perspectives 111 7.1 Conclusion . . . 111 7.2 Perspectives . . . 113 115 129 131 A Painters B Countries C Special groups Bibliography 135
List of Figures
1.1 Random vs. Scale-free network. . . . 4 1.2 Network structure of French Wikipedia. . . . 7 1.3 Distribution of out-links for the French Wikipediaedition of 2013. . . . 8 1.4 Directed graph representing a WWW network of seven
nodes. Arrows represent the direction of the hyper-link existing between two webpages. A double-sided arrow represents the presence of two opposite direc-tion hyperlinks. . . . 10 1.5 Directed graph representing a network of seven nodes. 12 1.6 Graphical representation of the resultant PageRank
vector for the network of Figure 1.5. The size of the node is proportional to its PageRank vector value. . . 14 1.7 CheiRank versus PageRank for FrWiki and RuWiki.. 19 2.1 Decomposition of G into reduced network and scattering
net-work.. . . 22 3.1 Geographic birthplace distribution of the top 223 painters
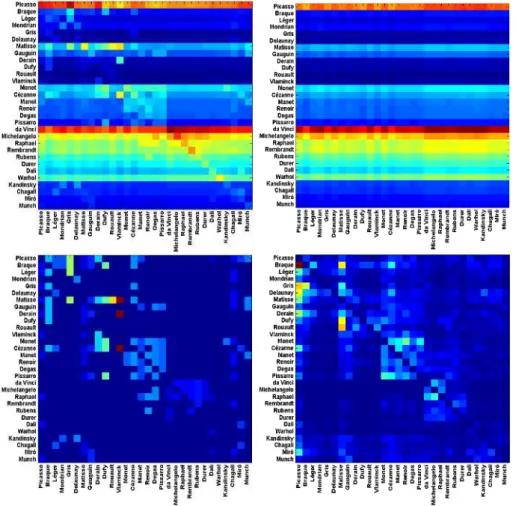
for the painters appearing at least one time in the top 100 of the 6 language editions analyzed. . . . 29 3.2 Density plots of matrices for the reduced network of
30 painters in the EnWiki network. Top left and top
right figures are GR and Gpr, respectively. Bottom left and
bottom right figures are Grr and Gqrnd respectively; Color
scale represents maximum values in red, intermediate in green and minimum in blue. . . 33 3.3 Network structure of friends induced by the top 5
painters of each group in Gqrnd. Results are plotted for
EnWiki (Bottom), FrWiki (Middle) and DeWiki (Top). Red, Blue, Green, Orange and Pink nodes represent Cubism, Fau-vism, Impressionism, Great masters and Modern (20-21), re-spectively. The top painter node points with a bold black arrow to its top-4 friends. Red arrows represent the friends of friends interactions computed until no new edges are added to the graph. All graphs are automatically plotted using
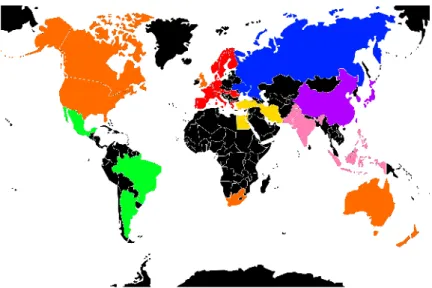
4.1 Geographical distribution of the 40 selected
coun-tries. Color code groups countries into 7 sets: orange (OC)
for English speaking countries, blue (BC) for former Soviet union ones, red (RC) for European ones, green (GC) for Latin American ones, yellow (YC) for Middle Eastern ones, purple (PUC) for North-East Asian ones and finally pink (PIC) for South-Eastern countries (see colors and country names in Ta-ble 4.1 ; other countries are shown in black). . . 40 4.2 Density plots of matrices for the reduced network of
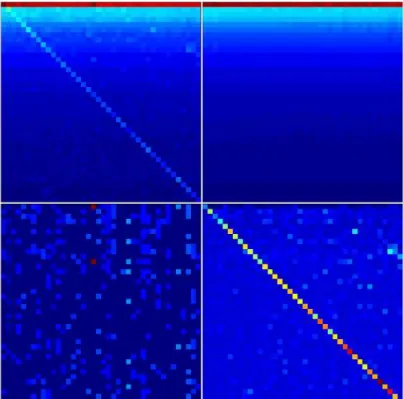
40 countries in the EnWiki network. GR (top left), Gpr
(top right), Grr (bottom left) and Gqr (bottom right). The
nodes Nr are ordered in lines by increasing PageRank index
(left to right) and in columns by increasing PageRank index from top to bottom. Color scale represents maximum values in red (0.15 in top panels; 0.01 in bottom left panel; 0.03 in bottom right panel), intermediate in green and minimum (approximately zero) in blue. . . 41 4.3 Position of countries in the local (K, K∗
) plane of the
reduced network of 40 countries. EnWiki (Bottom),
Ar-Wiki (Middle) and RuAr-Wiki (Top) networks. . . 45 4.4 Density plots of the matrix elements for the reduced
network of 40 countries of EnWiki, ArWiki and RuWiki.
EnWiki (left column), ArWiki (middle column) and RuWiki (right column). first line: GR, second line: Gqrnd and third
line: Grr . The country names are given on the axes in the
order names in Table 1, thus the nodes Nrare ordered in lines
and columns by the reference PageRank of EnWiki. The col-ors represent maximum (red corresponds to: 0.15, 0.19, 0.13 in top panels from left to right; 0.01, 0.03, 0.012 in middle panels and 0.01, 0.011, 0.006 in bottom panels respectively), intermediate (green) and minimum (blue for zero) values for a give matrix. . . 47 4.5 Network structure of friends and followers induced
by the 7 top countries of each geographical area (US, FR, IN, JP, BR, TR, RU) in GR. Friends and followers
network are in top and bottom line respectively. Results are plotted for EnWiki (left column), ArWiki (middle column) and RuWiki (right column). Node colors represent geographic appartenance to a group of countries (cf. Table 4.1 for de-tails). Top (bottom) graphs: the top country node points (is pointed by) with a bold black arrow to its top 4 friends (followers). Red arrows show friends of friends (resp. follow-ers of followfollow-ers) interactions computed until no new edges are added to the graph. Drawn with [1]. . . 49
LIST OF FIGURES xi 4.6 Network structure of friends and followers induced
by the 7 top countries of each geographical area (US, FR, IN, JP, BR, TR, RU) in Gqrnd.Friends and
follow-ers network are in left and right line respectively. Results are plotted for EnWiki (third row), ArWiki (middle row) and RuWiki (first row). Node colors represent geographic appar-tenance to a group of countries (cf. Table 4.1 for details). Top (bottom) graphs: the top country node points (is pointed by) with a bold black arrow to its top 4 friends (followers). Red arrows show friends of friends (resp. followers of followers) interactions computed until no new edges are added to the graph. Drawn with [1]. . . 50 5.1 Geographical distribution of the EU countries. Color
code groups countries into 5 subsets: Blue (BL) for Founders, Green (GN) for 1973 new member states, Orange (OR) for 1981 to 1986 new member states, Pink (PK) for 1995 new member states and Red (RD) for 2004 to 2007 new member states. . . 55 5.2 Position of EU countries in the local (K, K∗) plane.
Networks are extracted from EnWiki (left), FrWiki (middle) and DeWiki (right). Countries are marked by their flags. . . 57 5.3 Density plots of GR, Gqrnd and Grr. GR (first line), Gqrnd
(second line) and Grr (third line) for the reduced network of
EU countries of EnWiki (left column), FrWiki (middle col-umn) and DeWiki (right colcol-umn). The nodes Nrare ordered
in lines and columns by the reference PageRank of EnWiki. The colors represent maximum (red), intermediate (green) and minimum (blue) values. . . 59 5.4 Relationships structure extracted from GR for the
network of EU countries. Friends (top line) and followers
(bottom line) induced by the top 4 countries of each group (FR, GB, ES, SE, PL). Results are plotted for EnWiki (A and D), FrWiki (B and E) and DeWiki (C and F). Node colors represent geographic appartenance to a group of countries. Top (bottom) graphs: a country node with higher PageRank probability has a bigger size and points (is pointed by) with a bold black arrow to its top 4 friends (followers). Red arrows show friends of friends (resp. followers of followers) interac-tions computed until no new edges are added to the graph.
5.5 Relationship structure extracted from Gqrnd for the
network of EU countries. Friends (top line) and followers
(bottom line) induced by the top 4 countries of each group (FR, GB, ES, SE, PL). Results are plotted for EnWiki (A and D), FrWiki (B and E) and DeWiki (C and F). Node colors represent geographic appartenance to a group of countries. Top (bottom) graphs: a country node with higher PageRank probability has a bigger size and points (is pointed by) with a bold black arrow to its top 4 friends (followers). Red arrows show friends of friends (resp. followers of followers) interac-tions computed until no new edges are added to the graph.
. . . 62 5.6 Axial representation of ¯D for a link modification from
{IT} to {FR}. Here ¯D(IT ) = −0.0159 and ¯D(F R) =
0.0701 are not represented. . . . 66 5.7 Map representation of ¯D for links modifications from
{IT} to {FR}. Lower values of ¯D in red, median in
green and larger in blue. Values of ¯D for IT and FR are not
represented. . . 67 5.8 Axial representation of ¯D for link modifications from
{GB} to {FR or DE}. (A): GB to FR (Non represented
values: ¯D(GB) = −0.0124 and ¯D(F R) = 0.0577). (B):
GB to DE (Non represented values: ¯D(GB) = −0.0087 and
¯
D(DE) = 0.0606). . . . 68
5.9 Map representation of ¯D for link modifications from
{GB} to {FR or DE}. (A): GB to FR ( ¯D for GR, FR
are not represented); (B): GB to DE( ¯D for GR, DE are not
represented). Lower values of ¯D in red, median in green and
larger in blue. . . 68 5.10 Axial representation of ¯D for link modifications from
{FR or DE} to {GB or IT}. (A): FR to GB (Non
rep-resented values: ¯D(F R) = −0.0117 and ¯D(GB) = 0.1572).
(B): DE to GB (Non represented values: ¯D(DE) = −0.0081
and ¯D(GB) = 0.1248). (C) FR to IT (Non represented
val-ues: ¯D(F R) = −0.0143 and ¯D(IT ) = 0.1508). . . . 69 5.11 Map representation of ¯D for link modifications from
{FR or DE} to {IT or GB} : Luxembourg is nega-tively impacted here. (A): FR to GB. (B): DE to GB. (C) FR to IT. Lower values of ¯D in red, median in green and
larger in blue; Values of ¯D for FR, DE, IT and GB are not
LIST OF FIGURES xiii 5.12 Axial representation of ¯D for link modifications from
Nordic countries to {FR or DE}. (A): DK to DE (Non
represented values: ¯D(DK) = −0.0050 and ¯D(DE) = 0.0208).
(B): SE to DE (Non represented values: ¯D(SE) = −0.0064
and ¯D(DE) = 0.0313). (C): FI to DE (Non represented
val-ues: ¯D(F I) = −0.0046 and ¯D(DE) = 0.0173). (D): DK
to FR (Non represented values: ¯D(DK) = −0.0077 and
¯
D(F R) = 0.0197). (E): SE to FR (Non represented values:
¯
D(SE) = −0.0100 and ¯D(F R) = 0.0296). . . . 71 5.13 Map representation of ¯D for link modifications from
Nordic countries to {FR or DE}. (A): DK to DE. (B):
SE to DE. (C): FI to DE. (D): DK to FR. (E): SE to FR. Lower values of ¯D in red, median in green and larger in blue.
Values of ¯D for DK, BE, SE and FI are not represented. . . 72
5.14 Axial representation of ¯D for link modifications from
{AT, HU and SI} to {FR or DE}. (A): AT to FR
(Non represented values: ¯D(AT ) = −0.0101 and ¯D(F R) =
0.0373). (B): HU to FR (Non represented values: ¯D(HU ) =
−0.0080 and ¯D(F R) = 0.0205). (C): SI to FR (Non
rep-resented values: ¯D(SI) = −0.0046 and ¯D(F R) = 0.0075).
(D): AT to DE (Non represented values: ¯D(AT ) = −0.0070
and ¯D(DE) = 0.0393). (E): HU to DE (Non represented
values: ¯D(HU ) = −0.0052 and ¯D(DE) = 0.0311). (F):
SI to DE (Non represented values: ¯D(SI) = −0.0034 and
¯
D(DE) = 0.0081). . . . 73 5.15 Map representation of ¯D for link modifications from
{AT, HU and SI} to {FR or DE}. (A): AT to FR. (B):
HU to FR. (C): SI to FR. (D): AT to DE. (E): HU to DE. (F): SI to DE. Lower values of ¯D in red, median in green and
larger in blue; Values of ¯D for AT, FR, HU, SI, DE are notre
represented. . . 74 5.16 Relationship imbalance analysis: F-representation for
27 EU network. F (a, b) is given by the colorbar. X-axis and
Y-axis represent a and b respectively. If F (a, b) is negative, nation a has more influence on nation b than b on a. . . . . 75 5.17 Axial representation of ¯D for link modification from
RU to US. Non represented values: ¯D(RU ) = −0.0089 and
¯
D(U S) = 0.0446. . . . 76
5.18 Map representation of ¯D for link modification from
RU to US. Values of ¯D for RU or US are not represented.
Lower values in red, median blue and larger in green . . . 77 5.19 Axial representation of ¯D for link modification from
CN to US. Non represented values: ¯D(CN ) = −0.0056,
¯
5.20 Map representation of ¯D for link modification from
CN to US. Non represented values: ¯D(CN ) = −0.0056,
¯
D(U S) = 0.0210 and ¯D(T W ) = −0.0087. . . . 78 5.21 Axial representation of ¯D for link modification from
GB to FR. Non represented values: ¯D(GB) = −0.00403
and ¯D(F R) = 0.0368. . . . 79
5.22 Map representation of ¯D for link modification from
GB to FR. Non represented values: ¯D(GB) = −0.00403
and ¯D(F R) = 0.0368. . . . 79 5.23 Axial representation of ¯D for links modifications from
{IL and EG} to US. (A):EG to US (Non represented
val-ues: ¯D(EG) = −0.0080 and ¯D(U S) = 0.0252). (B):IL to US
(Non represented values: ¯D(IL) = −0.0041 and ¯D(U S) =
0.0108). . . . 80 5.24 Map representation of ¯D for link modifications from
{IL and EG} to US. (A):EG to US. (B):IL to US. Values
for EG, US, and IL are not represented. . . 81 5.25 Axial representation of ¯D for link modifications from
{AR and BR} to US. (A): AR to US (Non represented
values: ¯D(AR) = −0.0050 and ¯D(U S) = 0.0094). (B): BR to US (Non represented values: ¯D(BR) = −0.0074 and
¯
D(U S) = 0.0149). . . . 82
5.26 Map representation of ¯D for link modifications from
{AR and BR} to US. (A): AR to US. (B): BR to US. ¯D
values for AR, BR and US are not represented. . . 83 5.27 Relationship imbalance analysis: F-representation for
27 EU network. F (a, b) is given by the colorbar. X-axis and
Y-axis represent a and b respectively. If F (a, b) is negative, nation a has more influence on nation b than b on a. . . . . 84 5.28 Network structure of top 3 country friends for top 40
painter network for EnWiki Painters are selected from the
global rank list of 7 Wikipedia editions from Table 5.4 for top 40 PageRank countries of EnWiki from Table 5.5. Arrows are showing links only from a painter to top 3 countries, they are given by links of matrix elements Grr+Gqrnd, red arrow mark
links when an element Gqrndis larger than element Grr, black
arrows are drown in opposite case. Countries and shown by red circles and painters are shown by yellow circles.. . . 88 5.29 Network structure of top 3 country friends for top 40
painter network for FrWiki Painters are selected from the
global rank list of 7 Wikipedia editions from Table 5.4 for top 40 PageRank countries of EnWiki from Table 5.5. . . 89
LIST OF FIGURES xv 5.30 Network structure of top 3 country friends for top 40
painter network for DeWiki Painters are selected from
the global rank list of 7 Wikipedia editions from Table 5.4 for top 40 PageRank countries of EnWiki from Table 5.5. . . 90 5.31 Sensitivity D of 40 world countries to the link
Picasso-Spain and Picasso-France Top panel: Picasso-Picasso-Spain and
bottom panel: Picasso-France. Data is averaged over 7 Wikipedia editions. For a better visibility sensitivity of Spain (top) and France (bottom) are given in Figure 5.33. . . 92 5.32 Sensitivity D of 40 world countries to the link Van
Gogh-Netherlands and da Vinci-France. Top panel:
Van Gogh-Netherlands and bottom panel: da Vinci-France. Data is averaged over 7 Wikipedia editions. For a better vis-ibility sensitivity of Netherlands (top) and France (bottom) are given in Figure 5.33. . . 93 5.33 Sensitivity D represents the sum of logarithmic
sen-sitivity value of country for two direction (painter to country) and (country to painter) Color bar shows the
sensitivity values. Data is averaged over 7 Wikipedia editions and are shown for top 20 entries of Table 5.4 and Table 5.5. 95 6.1 Density plots of matrices GR, Gpr, Grr and Gqrnd. Top
left and right figures are GR and Gpr respectively ; Bottom
left and right figures are Grr and Gqrnd respectively; color
changes from red at maximum to blue at zero; Here we only plot the matrix for the 95 terrorist nodes of Table 6.1. . . . 102 6.2 Friendship network structure of terrorist groups
ob-tained from Gqrnd+Grr. Colors mark categories of nodes
and top nodes are given in text and Table 6.1; circle size is proportional to PageRank probability of nodes; bold black arrows point to top 4 friends, gray tiny arrows show friends of friends interactions computed until no new edges are added to the graph (drawn with [1,2]). . . 103 6.3 Friendship network structure extracted from Gqrnd+
Grr with the top 4 countries per leading terrorist
group. The leading terrorist groups are marked by their
re-spective colors and countries are marked by cyan color. The network structure is construction with the leading terrorist groups of each category and its top 4 friend countries. Net-works are drawn with [1,2]. . . 105
6.4 Friendship network structure extracted from Gqrnd+
Grr with the top 2 terrorist groups and top 2
coun-tries. The top terrorist groups are marked by their respective
colors and countries are marked by cyan color. The network structure is construction with the leading terrorist groups of each category and its top 2 friend countries and top 2 terrorist groups. Networks are drawn with [1,2]. . . 106 6.5 Wold map of the influence of terrorist groups on
coun-tries expressed by sensitivity D(j→i)(j). Where j is the
country index and i the group index. Left column: Taliban KG3, Hamas KG5, Houthis KG13 (top to bottom). Right column: ISIS KG1, Al Shabaab KG10, IRA KG4 (top to bottom). Color bar marks D(j→i)(j) values with red for
max-imum and green for minmax-imum influence; grey color marks countries not considered is this work. . . 108 6.6 Sensitivity influence D(c→i)(j) for the relation between
a selected country c and a terrorist group i on a world country j. For two c values: USA (left), Saudi Arabia
(right). Terrorist group represented by group index i from Ta-ble 6.1 in horizontal axis and countries represented by coun-try index j from Table 6.2 in horizontal axis, j = c is ex-cluded. Color shows D(c→i)(j) value is changing in the range
(−2.8 · 10−4
, 2.1 · 10−4)) for USA and (−4.8 · 10−3
, 10−3)) for
SA; minimum/maximum values correspond to blue/red. . . . 109 A.1 Network structure of friends induced by the top 5
painters of each group in Gqrnd. Results are plotted for
EsWiki (Top left), ItWiki (Top right) and RuWiki (Bottom). Red, Blue, Green, Orange and Pink nodes represent Cubism, Fauvism, Impressionism, Great masters and Modern (20-21), respectively. The top painter node points with a bold black arrow to its top-4 friends. Red arrows represent the friends of friends interactions computed until no new edges are added to the graph. All graphs are automatically plotted using Gephi [1]. . . 128 B.1 Position of 40 and EU countries in the local (K, K∗)
plane. First row: 40 countries and second row: EU countries.
ArWiki (left) and RuWiki (right) networks. Countries are marked by their flags. . . 129
LIST OF FIGURES xvii C.1 Density plots of matrices GR, Gpr, Grr and Gqrnd. Top
left and right figures are GR and Gpr respectively, Top left
and right figures are Grrand Gqrndrespectively; color changes
from red at maximum to blue at zero; 95 terrorist nodes (from Tab. 6.2) and 64 countries nodes (from Tab. 6.1) are shown. 131 C.2 Followers network structure between terrorist groups
obtained from Gqrnd+Grr. Colors mark categories of nodes
and top nodes are given in text and Table 6.1; circle size is proportional to PageRank probability of nodes; bold black arrows point to top 4 friends, gray tiny arrows show friends of friends interactions computed until no new edges are added to the graph (drawn with [1,2]. . . 132 C.3 Followers network structure extracted from Gqrnd+Grr
with the top terrorist groups and countries. The top
terrorist groups are marked by their respective colors and countries are marked by cyan color. The network structure is shown in case of 2 friends for top terrorist groups of each category and top friend 2 countries for each group. Networks are drawn with [1,2]. . . 133 C.4 Followers network structure extracted from Gqrnd+Grr
with the top terrorist groups and countries. The top
terrorist groups are marked by their respective colors and countries are marked by cyan color. The network structure is shown with the top terrorist groups of each category and their top 4 friend countries. Networks are drawn with [1,2]. 134
List of Tables
1.1 Wikipedia editions and their sizes. . . . 5 3.1 List of 50 top painters from FrWiki, EnWiki, DeWiki,ItWiki, EsWiki, NlWiki and RuWiki by increasing PageRank. . . . 30 3.2 List of names of 30 selected painters and their
PageR-ank order for FrWiki, EnWiki and DeWiki, ordered by category. . . . 32 3.3 Cross-editions friends from Gqrndfor the top-4 painters
of each category. For each top painter, we list the friends
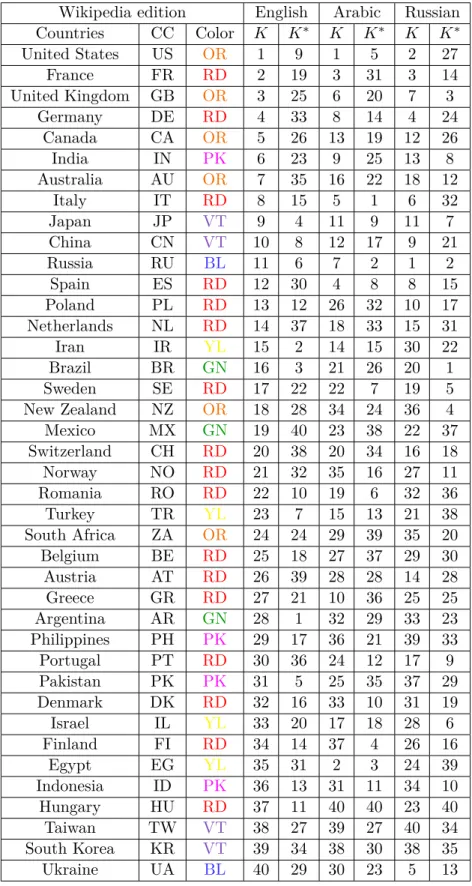
present in the top-4 friends list given by all six Wikipedia editions, the ones present in 5 editions out of 6 and the ones present in 4 editions out of 6. . . 35 4.1 List of 40 selected countries. PageRank K and CheiRank
K∗ for EnWiki, FrWiki and RuWiki. Color code (CC) groups
countries into 7 subsets: orange (OR) for English speaking countries, Blue (BL) for former Soviet union ones, Red (RD) for European ones, Green (GN) for South American ones, Yellow (YL) for Middle Eastern ones, Purple (VT) for North-East Asian ones and finally Pink (PK) for South-North-Eastern countries. . . 43 4.2 Cross-edition direct friends and followers extracted
from GR and Gqrnd matrices for the top countries of
each area. For each top country, we list the direct friends
(followers) present in the direct friends list given by all five Wikipedia editions, the ones present in 4 editions out of 5 and the ones present in 3 editions out of five. . . 48 5.1 List of EU countries. PageRank K and CheiRank K∗ for
EnWiki, FrWiki and DeWiki. Color code groups countries into 5 subsets: Blue (BL) for Founders, Green (GN) for 1973 new member states, Orange (OR) for 1981 to 1986 new mem-ber states, Pink (PK) for 1995 new memmem-ber states and Red (RD) for 2004 to 2007 new member states. Standard country codes (CC) are given as well. . . 56 5.2 Weights of the three matrices components of GR. . . . 57
5.3 Cross-edition friends and followers extracted from Gqrnd
of EU countries per leading country. For each top
coun-try, we list the friends and followers that are identical accros all five Wikipedia editions, in 4 editions out of 5 and in 3 editions out of 5. . . 63 5.4 Top 40 painters . . . 85 5.5 List of PageRank of top 40 countries in EnWiki . . . 86 6.1 List of selected terrorist groups attributed to 6
cat-egories marked by color. Source: [3]. KG gives the local PageRank index of terrorist groups. . . 99 6.2 List of selected countries. . . . 100 A.1 Top 223 painters of 7 Wikipedia editions. It contains
the top 100 painters of each edition. POB, YOB, YOD are place of birth, year of birth and year of death. Other columns list the PageRank order for the 7 Wikipedia editions (FrWiki, EnWiki, DeWiki, ItWiki, RuWiki, EsWiki and NlWiki.. . . . 115
Chapter 1
Introduction
1.1
Complex networks
A network, as described by Newman in [4], is a collection of nodes (vertices) connected by edges. If transitioning is only allowed from a node i to a node j, a direction can be added to the edge. In this case, edges are directed and together with the vertices they define a directed network. Networks exist everywhere:
Our societies can be described as a network of people connected by friendship, familial or professional relations. Internet is a network of routers connected by physical data connections. World Wide Web (WWW) is a network of pages linked together by hyperlinks. About 1011 neurons are
connected by biochemical reactions in human’s brain. Protein interactions, network of Hollywood actors, power grids, highways and many other funda-mentally different systems existing in real life have a network architecture.
According to [5], a complex network is a graph (network) that models real systems with non-trivial topological features. Examples of complex networks are illustrated in Figure1.1, representing the networks created by US highways and US airline routes.
In this thesis our network of interest is the open access encyclopedia Wikipedia. Wikipedia is a collection of articles, each article referencing encyclopedic information on a given topic. Articles are linked together by WWW hyperlinks. The network of Wikipedia is a graph whose vertices represent the webpages and whose edges the hyperlinks. Understanding and modeling the structure of such networks have spawned the last century, and main results will be underlined briefly next.
1.2
Modeling complex networks
The spread ubiquity of networks makes their study indispensable. Impor-tant studies have been led to understand their structure, offer general model to define different types of complex networks and to extract relevant infor-mation from them [6–8]. Such studies build on the definition of network properties (or metrics), the core ones being introduced next.
1.2.1 Measuring network properties
There are three main network-wide metrics that play important roles for the study of a network.
1. The average path length represents the mean distance between two nodes averaged over all pair of nodes. In societies, the average number of friends in the shortest chain connecting two person is the average path length. In most real networks this number is relatively small [9]. 2. The clustering coefficient describes how network nodes are assembled together to form flocks of nodes. In another word, for a node i, the clustering coefficient is the average fraction of its pair of neighbors that are also connected to each other. In network analysis, this coefficient lies between 1, for a network having links between each couple of nodes, and 1/N in a network having a random linkage between nodes [7]. 3. The node degree distribution gives the probability for a node j to have
k connections with other nodes. The node degree metric for a node i is defined by the number of links it shares with other nodes. For the case of directed networks, out-degree and in-degree can be defined as well. The out-degree represents the number of out-links and the in-degree the number of in-links of a node. For a network structured as a regular lattice, a simple degree distribution is obtained where all nodes have the same degree.
1.2.2 Models of complex networks
Different networks exhibit different degree distributions, average path length or clustering coefficients.
Random networks In the late 1950s, the two mathematicians Erdős and
Renyi have defined random networks [6] as a possible way of modeling com-plex networks. A random network is a collection of nodes with edges, con-necting pairs of them at random [10] and whose degree distribution is expo-nential. Referring to [11,12], random graphs exhibit a small average path length (proportional to the network’s size) along with a small clustering co-efficient. An example of a random network is given in Figure1.1on the left panel. However, it has been shown since that real life networks are usually not random and that other generic properties of networks are required to model them.
Small world networks In 1929, Frigyes Karinthy wrote the short story
1.2. MODELING COMPLEX NETWORKS 3 supposed that any two person on earth are connected through five intermedi-aries (or less). The theory means that any two people picked at random from anywhere on the earth will be connected through five intermediary people. In 1960, the six degrees of separation theory had experimental confirmation by Stanley Milgram named small-world experiment [14,15]. Milgram sent out 300 packages to people both in Boston and in Nebraska. Now what he wanted these people to do, was to try to send their package to a target person in Boston. But they weren’t allowed to send it directly to her but had to send it to someone they knew on a first-name basis who they thought had a better chance of knowing the target. Of course, this friend had to for-ward it again on same basis. Practically, only 64 packages out of 300 made it, but the ones arriving experienced an average path length of around five (avg.5.2 ) [16,17].
In 1998, Watts and Strogatz [7] identified the concept of small-world networks that lies between completely regular (i.e. lattice) and random networks. Watts and Strogatz show that three different networks belong-ing to three different fields are small-world networks. Small-world networks are homogeneous and exponential as Erdős and Renyi random networks, but the key difference is the short cut links that exist between some nodes. Small-world networks are highly clustered like regular graphs, yet with small average path length like random graphs. An example of a small world net-work is the collaboration graph of film actors (two actors are joined by an edge if they have acted in a film together).
Scale-free networks In 1999, Barabási and Albert [8], while mapping the WWW, found that few highly connected web-pages are holding the network, and so the probability that a web-page i has k links follows a power law distribution and not a bell shape exponential distribution as Erdős and Renyi and Watts and Strogatz. Barabási in [18] illustrates the differences between an exponential network and a scale-free network by comparing US roadmap network with US internal flighmap, as shown in Fig.1.1. On the US roadmap [19], the nodes are cities that are connected by highways, in which, each major city has at least one link to the highway system, and there are no cities served by hundreds of highways. U.S. highway system resembles to Random networks. A plot of the distribution of node linkages will follow a bell-shaped curve, with most nodes having approximately the same number of links.
In contrast, scale-free networks, like US airline system [20] consists of airports as nodes connected by direct flights among them. Most nodes have just a few connections and some have a tremendous number of links. In that sense, the system has no scale. In such networks, the distribution of node linkages follows a power law. The independence of nodes degree from the network scale explains the term scale-free.
Figure 1.1: Random vs. Scale-free network.
Almost all the nodes in Random distribution have the same number of links, while it is not the case for scale-free networks. Left and right side
1.2. MODELING COMPLEX NETWORKS 5 The two basics attribution of Barabási et al. that form the main ingredi-ents of scale-free networks are: growth and preferential attachmingredi-ents. Indeed, many real networks are not static, they are dynamically formed by contin-uous addition of new nodes and new links. Nodes are added to the network progressively. That is what they define as growth. The second ingredient is the preferential attachment. When creating new edges, the probability of a new node connecting to a node i depends on its degree of importance. As ex-ample, new research papers are more likely to cite a well-known paper than many other less known ones. For directed networks, scale-free properties ap-ply separately to the in and out-degree of nodes. The score of importance of nodes depends on its number of links. However, in directed networks, each node has two scores of importance, one depends on the number of in-links and the other one depends on the number of out-links [21].
1.2.3 Wikipedia network model
“Wikipedia is a free encyclopedia, written collaboratively by the people who use it. It is a special type of website designed to make collaboration easy, called a wiki.“ [22].
Each webpage in Wikipedia is related to a clearly defined topic1. On each
page, there are hyperlinks pointing to other webpages of the same Wikipedia edition that are related to the topic of interest. As such, webpages are interconnected through directed links (i.e. hyperlinks), creating network of webpages. It is common to model this network as a directed graph where vertices represent all webpages and oriented edges represent the hyperlinks. This graph is complex as it can hold up to several millions of vertices and about ten times more edges. In this thesis we have studied the Wikipedia editions listed in Tab.1.1 [23,24]. They differ in terms of language and of the year they’ve been collected.
Wikipedia edition Number of nodes Number of links
Arabic 2013 203 326 1 896 621 English 2013 4 212 493 101 611 731 English 2017 5 416 537 122 232 932 French 2013 1 352 825 34 431 943 German 2013 1 532 977 36 781 077 Italic 2013 1 017 953 25 667 781 Russian 2013 966 284 20 853 206 Spanish 2013 974 021 23 105 758
Table 1.1: Wikipedia editions and their sizes.
1For instance we have https://en.Wikipedia.org/wiki/France for France, https:
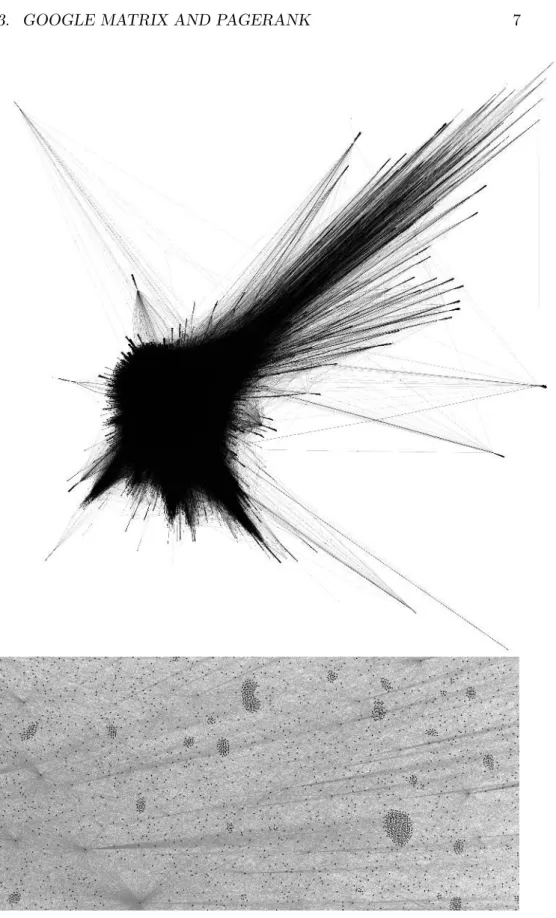
Similarly to web structure, Wikipedia is an interesting target domain for network analysts due to the hyperlinked structure that provides a di-rect relationship between web pages and topics. After studying Wikipedia’s network structure and based on its properties, it can be defined as a scale-free network. We give herein an example of a French edition2 to show that
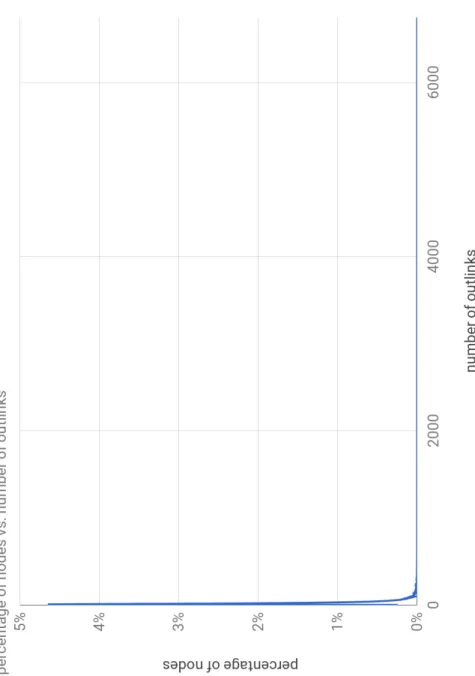
its network structure is non-homogeneous and that it follows a power law distribution. Fig.1.2shows a sample of the French Wikipedia network struc-ture. French Wikipedia network consists of 1 352 825 nodes connected with 34 431 943 hyperlinks. 80% of articles (nodes) have less than 32 out-links, 10% between 33 & 52 out-links, 9% between 53 & 199 and only 1% of nodes have between 200 & 6747 out-links. This distribution (Fig.1.3) exhibits that Wikipedia’s network match with scale-free properties.
Wikipedia is, as presented, a huge network of knowledge. In this thesis, we are interested in extracting valuable hidden information from its struc-ture without reading the content of all articles. In order to retrieve such information automatically, we leverage the Google matrix representation of the network.
1.3
Google matrix and PageRank
Previously introduced network models study how network nodes are inter-connected. In this thesis, we are more interested in studying the relative importance of nodes and edges in the network. This study looks for the nodes or the edges that are central to the network. Different types of node centrality metrics exist offering different way to measure the importance of nodes.
1.3.1 Node centrality metrics
Typically, one of the most common centrality metric is the node degree. A high node degree node is central as it is known by lots of neighbors. In directed networks, there exist two types of importance scores [21]:
1. Sink importance or in-degree: depends proportionally on the number of in-links. A node absorbing a lot of flow is called authority.
2. Source importance or out-degree: depends proportionally on the num-ber of out-links. A node originating a lot of flow is called hub.
Another well-known centrality metric is the betweenness centrality.
Ac-cording to Bavelas [26] and Shimbel [27], degree of centrality (importance/reliability) of a node in a network depends on the number of shortest paths passing
through it to connect pairs of other nodes. In another word, if a particular
1.3. GOOGLE MATRIX AND PAGERANK 7
Figure 1.2: Network structure of French Wikipedia. Top panel: only 700 000 hyperlinks are shown representing 2% of the whole network. Bottom panel: A zoomed snapshot from top panel figure.
Figure 1.3: Distribution of out-links for the French Wikipedia
1.3. GOOGLE MATRIX AND PAGERANK 9 person in a group is strategically located on the shortest communication path connecting pairs of others, then this person is in a central position.
Another important centrality metric has been proposed by Brin and Page in their seminal paper [21,28] introducing the PageRank metric. Each link in a directed network is considered as a recommendation from a node to another one, i.e. a link from node i to node j is i’s endorsement of j. Thus, the more in-links (or recommendations) a node has the more important it is. However, the status of the recommender is also important and an en-dorsement from an important person has more weight (is more significant) than many endorsements from less important ones. However, the weight of each endorsement should be tempered by the total number of recom-mendations made by the recommender, so that, if an important person has written over 50, 000 recommendations in his life, then his recommendation suddenly drops in weight. This idea is captured in the PageRank centrality metric which is derived from the Google matrix. Google matrix is a particu-lar Markov transition probability matrix that describes the world wide web (WWW) network and is used by Google’s PageRank algorithm, a central piece of the Google search engine. Next, we introduce Markov chains, and the specific example of the Google matrix in the context of WWW network modeling.
1.3.2 Markov chains
In 1906, Andrei Andreyevich Markov invented the chains to represent a probabilistic sequence to a process movements between states [29]. Markov chain is a stochastic process. Stochastic process is a set of random variables that describe the state of the process at a time t. The range of available states is referred as state space. Transitions from the current state to the next one are said to be memoryless and thus governed by probabilities usu-ally represented in a transition probability matrix H sized N × N, where N is the size of the state space. The column sum of H is equal to unity and is composed on non-negative elements, H being thus a stochastic matrix.
To describe the process of browsing the WWW, each webpage is ac-counted for as a possible state of the web browsing activity. As such, for an edition of Wikipedia, the state space is composed of all articles. The transi-tion matrix gives the probability of moving from article i to article j using the hyperlinked structure of Wikipedia. An example of transition probabil-ity matrix H construction for WWW browsing is the following. Assuming that ℓi is the number of out-links of node i and that all links have same weight, then Hji = 1/ℓi if i and j are connected and zero otherwise. The resulting transition matrix for the small illustrative example of Figure1.4is
Figure 1.4: Directed graph representing a WWW network of seven
nodes. Arrows represent the direction of the hyperlink existing between two webpages. A double-sided arrow represents the pres-ence of two opposite direction hyperlinks.
the following: H = 0 0 0 1/3 0 0 0 1 0 1/2 1/3 0 0 0 0 1 0 0 0 0 0 0 0 0 0 0 0 0 0 0 1/2 1/3 0 1/2 0 0 0 0 0 1 0 1 0 0 0 0 0 1/2 0
From this matrix, it is possible to derive the steady state probability vector that represents the probability, for the web browsing activity, to end in a specific webpage. This vector Π, composed of N elements, is obtained by solving the following steady state equation:
Π = H Π
Since H is stochastic, its largest eigenvalue equals one and the steady-state vector Π is the corresponding eigenvector. For the example given above, the normalized steady state vector is: Π = [0, 0, 0, 0, 0.25, 0.50, 0.25] for eigenvalue 1. In this case, browsing activity is likely to end with probability 0.5 on node 6, and with probability 0.25 on nodes 5 and 7 if the process is repeated at infinity. Intuitively, this is related to the strong interactions between these 3 nodes that will eventually concentrate all moves of the WWW surfer performing this browsing activity.
This Markov chain model has some limitations:
1.3. GOOGLE MATRIX AND PAGERANK 11 nodes of Brin and Page). A node with no out-links creates a 0-sum column in H, and hence a non-stochastic matrix.
• It doesn’t capture the fact that browsing may not always follow the hyperlink structure of the network.
Next, we show how these limitations have been solved by Brin and Page in their definition of the Google matrix.
1.3.3 Google Matrix and PageRank
PageRank PageRank is the first algorithm, but not the only one, used by
Google to compute the importance of websites in their search engine results. PageRank was named after Larry Page and uses the notion of random surfer. A random surfer is a web surfer who moves randomly between webpages over the hyperlink structure of the network. PageRank vector reflects the probability of the random surfer to end on a given webpage. The decreasing order of PageRank vector gives the PageRank score of a webpage. As such, the lower the PageRank score of a webpage, the larger the probability for the surfer to end on this page. A website’s PageRank score depends not only on the number of in-links but as well on the quality of these in-links. It relies on the Markov chain model introduced previously, but Brin and Page have solved the aforementioned issues in the following way.
In order to solve the problem of dangling nodes, Brin and Page intro-duced the assumption that the random surfer, upon reaching a dangling node, has the same probability to go to any other node (i.e. it can teleport any other webpage with equal probability). Mathematically, the new matrix states as follows:
Sij = Hij + (e/N)aT (1.1) where a is the dangling node vector of size N, with ai= 1 if i is a dangling node and zero otherwise. e/N is a uniform distribution vector of size N.
With this modification, they ensure that the transition matrix S is stochastic and it fits a fine description of the network. By applying this modification to the other example of Figure 1.5where node 2 is a dangling node, we get: S = 0 1/7 0 1/3 0 0 0 1 1/7 1/2 1/3 0 0 0 0 1/7 0 0 0 0 0 0 1/7 0 0 0 0 0 0 1/7 1/2 1/3 0 1/2 0 0 1/7 0 0 1 0 0 0 1/7 0 0 0 1/2 1
This modification solves the problem of dangling node, and then, S de-scribes the case of a random web surfer that follows the hyperlink structure.
Figure 1.5: Directed graph representing a network of seven nodes. However, in reality, a random surfer may visit a new web-page without fol-lowing a link (e.g. by directly typing the URL address of a new webpage). In order to take this fact into consideration, Brin and Page use a damping factor 0 < α < 1, which for a random surfer determines the probability (1 − α) for a random surfer to teleport to a new page without following a hyperlink. The teleportation matrix E = 1/NeeT where eT is e transposed, gives an equal weight 1/N to all links.
With this final step, the Google Matrix G can be defined as follows from S:
Gij = αSij+ (1 − α)/N , (1.2) The Google matrix for the example of Figure 1.5is thus:
G = 3/140 1/7 3/140 32/105 3/140 3/140 3/140 61/70 1/7 25/56 32/105 3/140 3/140 3/140 3/140 1/7 3/140 3/140 3/140 3/140 3/140 3/140 1/7 3/140 3/140 3/140 3/140 3/140 3/140 1/7 25/56 32/105 3/140 25/56 3/140 3/140 1/7 3/140 3/140 61/70 3/140 3/140 3/140 1/7 3/140 3/140 3/140 25/56 61/70
General properties of eigenvalues and eigenstates The PageRank
vector is the right eigenvector of the Google matrix G for the unity eigen-value3.
3The basic equation is Gψ
i = λiψi. λi and ψi represents the eigenvalues and right
1.3. GOOGLE MATRIX AND PAGERANK 13 G, a matrix sized N × N has N eigenvalues (λ1,λ2,λ3,λ4,...,λN) and eigenvectors, where λ1 = 1 in stochastic matrices like G. Since G is primitive
(Gk > 0), λ
2 < 1 and so are λ3,λ4,...,λN [21]. Only the PageRank vector is affected by α while other eigenstates are independent of α due to their orthogonality to the unit left eigenvector at λ = 1.
Perron-Frobenius G is a typical Google matrix of Perron-Frobenius type
[21,31] for a network with N nodes such that Gij > 0 and the column sum normalization PN
i=1Gij = 1 are verified. Following Perron-Frobenius theorem, for a positive square matrix like G, the largest eigenvalue is called perron root. The perron root r is positive and in our case is equal to 1. The perron vector is the eigenvector defined by: Gp = rp, with ||p||1 = 1. The
perron vector is the PageRank vector.
Power iteration method As said, the PageRank vector is the stationary
probability distribution vector of the Markov transition probability matrix G. Brin and Page have chosen the power iteration method to calculate the PageRank vector [21]. In 1960s, the power method became the standard method for calculating eigenvalues and eigenvectors of a matrix using digital computers [32]. The power iteration method algorithm is the following. At each iteration k, the new value of Π, i.e. Πk+1is calculated recursively using
Πk+1 = GΠk relation. At start, Π0 elements are set to equal values with
sum equal to one. Recursive calculation is performed until steady state is reached, i.e. Πk+1 ≃ Πk. Many reasons are in favor of using the power method:
- Programming and implementation are simple, - G could be expressed in term of H which is sparse, - H is storage friendly,
- No method can beat the complexity O(N) of each iteration for the power method (one sparse matrix-vector product).
- The number of iterations until convergence for G is limited.
Indeed, the convergence rate is the rate at which |λ2/λ1|k → 0. In our
case λ1 = 1, then the convergence rate depends on λ2. In [33,34], it is shown
that:
λk= αµk for k = 2, 3, 4, ..N. (1.3) where the spectrums are: σ(S) = {1, µ2, ..., µN} and σ(G) = {1, λ2, ..., λN}. Based on [21], for a WWW structure, |µ2| = 1 and thus the convergence
Figure 1.6: Graphical representation of the resultant PageRank
vec-tor for the network of Figure 1.5. The size of the node is propor-tional to its PageRank vector value.
obtained after 150 iterations (i.e. 9-10 places of accuracy): 0.85150 =
0.0000000000258725.
The resultant PageRank vector for our example of Figure 1.5 depicted in Figure1.6. Its numerical values are:
Π = 0.041660 0.090868 0.032462 0.032462 0.160123 0.246273 0.137128
The corresponding PageRank score vector K indicates the rank of each node obtained by the decreasing order of PageRank vector values:
K = 5 4 6 7 2 1 3
1.4. MOTIVATION 15 K shows that the nodes with identifiers 6, 5, 7, 2, 1, 3 and 4 are in decreasing order of importance in this small network.
CheiRank In addition to the matrix G it is useful to introduce a Google
matrix G∗ constructed from the adjacency matrix of the same network but
with inverted direction of all links [35]. The vector Π∗
is called the CheiRank vector [35,36]. Thus, nodes with many ingoing or outgoing links have small values of K = 1, 2, 3... and K∗ = 1, 2, 3, ... respectively [21,37]. To
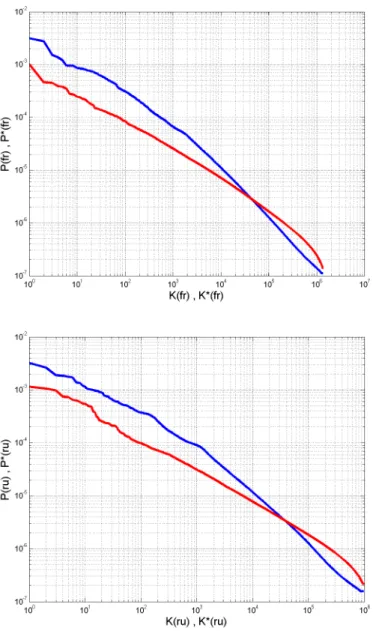
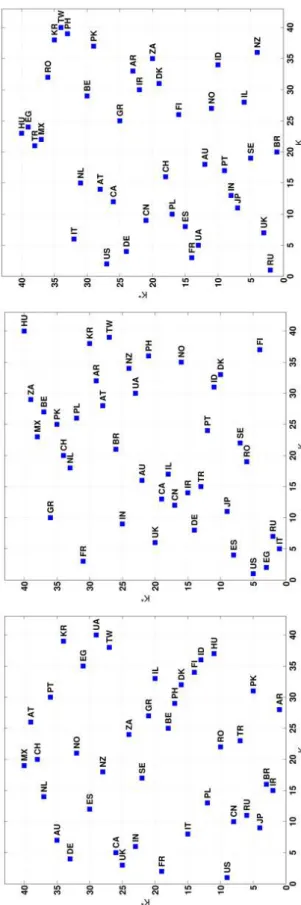
sum-marize, PageRank and CheiRank capture the relative importance of nodes in the network. They are extracted from the Google matrix representa-tion of the network of webpages. The Google matrix lists for each link the probability for directly transitioning from one webpage to the other one. The PageRank probability Π represents the probability of ending on a web-page, eventually. Figure 1.7, shows a plotted CheiRank versus PageRank for French (left) and Russian (right) Wikipedia.
An important study, which was introduced by Ermann et al. in [38], is to see what are the other eigenvectors of a Google matrix of Wikipedia, and to what type of information they correspond. Ermann et al. show in their cited paper two examples of node rank corresponding to two eigenvalues λ2 =
0.97724 and λ80= −0.8165. These results show that important information
are hidden behind other eigenvectors:
1. For λ2 linked to the main article Gaafu Alif Atoll, the first four nodes
are: Gaafu Alif Atoll, Kureddhoo (Gaafu Alif Atoll), Hithaadhoo (Gaafu Alif Atoll), Dhigurah (Gaafu Alif Atoll).
2. For λ80 linked to protein, the first four nodes are: Photoactivatable
fluorescent protein, Kaede (protein), Eos (protein), Fusion protein. However, analyzing the N eigenvectors is not straightforward if N is large.
In this thesis, we will focus on finding and analyzing these hidden infor-mation from Wikipedia networks by using the recent method of K. Frahm and D. Shepelyansky [39] based on Google matrix and called the Reduced Google matrix analysis. A complete definition of the Reduced Google matrix is given in Chapter2.
1.4
Motivation
Networks are part of our life. They are indispensable in the world of culture, business, marketing and many other domains. Social networks are a part of these networks that are changing some of our behaviors.
Academic social networks have become unavoidable for both researchers and research institutions. They are very effective tools and very much used. They transform and improve the visibility of researchers and the work they
need to continue and expand their activities. There are different academic social networks used and created by scientists and researchers that make available, in different ways, pedagogical content or research broadly.
Wikipedia as presented before is one of the existing networks that in-cludes, as gathered by Wikimedia projects [40], about 46 million articles in 299 different languages for a publicly accessible user. The different articles (pages) are linked together. Some links are more important than others and can be of importance in different domains.
Research on such networks has derived content-independent effective metrics to rank nodes and edges of the graph based on their relevance to a given criteria such as clustering, importance ranking, etc.. In this thesis we concentrate on one of the most popular network analysis algorithms: the PageRank algorithm [21,28].
For various language editions of Wikipedia it has been shown that the PageRank vector produces a reliable ranking of historical figures over 35 centuries of human history [23,36,37,41,42] and a solid Wikipedia ranking of world universities (WRWU) [36,43]. It has been shown as well that the Wikipedia ranking of historical figures is in a good agreement with the well-known Hart ranking [44], while the WRWU is in a good agreement with the Shanghai Academic ranking of world universities [45].
In order to better understand Wikipedia networks, we study their struc-tures and we search for the importance score of each node. For that purpose, many algorithms are known to analyze networks structures of connected nodes. However, it is really hard to explain interactions between nodes in such large network of several tens of millions of nodes. Just to capture the complexity of analyzing such large networks, we look at a simple metric commonly used to calculate the importance of nodes in a network called the betweenness. This metrics, as said earlier, computes for each node the number of times it is located on the shortest path of any two pair of nodes in the network. A network of N nodes is composed of N!
k!(N −k)! pairs. Dijkstra,
a Dutch computer scientist, created an algorithm for finding shortest paths from a source node i to all other nodes in the graph. Dijkstra’s shortest path algorithm [46] time complexity is O(sE log(E)+N) [47] where s is the num-ber of sources, N is the numnum-ber of nodes and E is the total numnum-ber of edges. Computing the betweenness centrality [48] for each node has a time com-plexity of O(N.E) once shortest paths are known [47]. Hence, in addition to the existing research works mentioned in1.2.3 that prove the reliability of applying PageRank algorithm on Wikipedia networks, it is clear as well that the time complexity of Google’s PageRank algorithm of O(N) clearly outperforms a well-known graph centrality like betweenness that accounts for all possible paths in the network.
In this thesis, we will be using the Google matrix to describe and under-stand the Wikipedia hyperlinked structure. Moreover, we are interested in discovering information hidden in the Google matrix eigenvectors different
1.5. CONTRIBUTIONS 17 from the one corresponding to the unity eigenvalue. Therefore, in order to better understand the interaction between a small subset of nodes (com-pared to the whole network), we propose in this thesis to use the Reduced Google matrix theory [39] presented in Chapter2.
1.5
Contributions
This section summarizes the scientific contributions of this doctoral research. All contributions listed hereafter have been made with the goal of extracting novel and meaningful knowledge present in different editions of Wikipedia. From these large scale networks collecting many different types of articles belonging to various cultures among the time, we extract fine-grained infor-mation to better understand the specificities of networks formed by subsets of pages extracted from Wikipedia.
This thesis presents the following contributions:
• This thesis gives a clear interpretation of the reduced Google matrix theory [39] presented in Chapter2. It shows that the main derivation steps hold valuable information that be analyzed further and leveraged in the rest of the manuscript.
• From the reduced Google matrix, we can extract a graph of hidden relationships between a chosen subset of nodes. Different types of relationship graphs are studied, originating from the matrix compo-nents of the reduced Google matrix or from the Google matrix itself. They are illustrated for a reduced network of painters in Chapter 3, of countries in Chapter4 and of terrorist groups in Chapter6. • A variational analysis of the reduced Google matrix is presented in 5
that underlines how sensitive our selected nodes are to a link varia-tion intensity in the reduced Google matrix. This variavaria-tional analysis helps us in measuring the impact of a change of relationship intensity between two nodes on the rest of nodes. This study is illustrated for the networks of countries and painters. We show that results obtained by these studies are clearly in line with the common knowledge related to arts history and geopolitics.
• All contributions introduced in Chapters 3, 4 and 5 offer an innova-tive analysis framework that can be applied to any subset of nodes of a network. We have illustrated how this framework captures novel knowledge within Wikipedia in a study on the world terror network. Reduced networks are here composed of nodes corresponding to the articles describing terrorist groups and articles of countries. Interest-ing and meanInterest-ingful ties between terrorist groups and countries are extracted from this study.
These contributions have been published or are under review for possible publication. The list is given below.
1.6
Publications related to this thesis
1.6.1 Journal articles
• K. M. Frahm, S. E. Zant, K. Jaffrès-Runser, and D. L. Shepelyansky, "Multi-cultural Wikipedia mining of geopolitics interactions leveraging reduced Google matrix analysis" Elsevier, PLA, vol. 381, no. 33, pp. 2677 - 2685, September 2017.
• S. E. Zant, K. M. Frahm, K. Jaffrès-Runser, and D. Shepelyansky, "Analysis of world terror networks from the reduced Google matrix of Wikipedia" Springer, EPJB, vol. 91, no.1, pp. 7, January 2018. (Cited among top 5 of ’The Best of the Physics arXiv (week ending October 21, 2017)’ by MIT Technology Review.)
1.6.2 Conference proceedings
• S. E. Zant, K. Jaffrès-Runser, and D. Shepelyansky, "Geopolitical in-teractions from reduced Google matrix analysis of wikipedia" IEEE, MENACOMM, April 2018.
1.6.3 Talks
• S. E. Zant, K. Frahm, K. Jaffrès-Runser, and D. Shepelyansky, "Anal-yse des interactions géopolitiques par la matrice de Google réduite" AlgoTel 2017, Quiberon, France, May 2017.
1.6.4 Submitted journal articles
• S. E. Zant, K. Jaffrès-Runser, K. M. Frahm, and D. Shepelyansky, "In-teractions and influence of world painters from reduced Google matrix of Wikipedia networks" (Submitted to IEEE access).
• S. E. Zant, K. Jaffrès-Runser, and D. Shepelyansky, "Capturing the influence of geopolitical ties from Wikipedia with reduced Google ma-trix" (Submitted to Plos One). https://arxiv.org/abs/1803.05336
1.6. PUBLICATIONS RELATED TO THIS THESIS 19
Figure 1.7: CheiRank versus PageRank for FrWiki and RuWiki. Top and bottom panels are FrWiki and RuWiki respectively. Blue and Red