OATAO is an open access repository that collects the work of Toulouse
researchers and makes it freely available over the web where possible
Any correspondence concerning this service should be sent
to the repository administrator:
tech-oatao@listes-diff.inp-toulouse.fr
This is an author’s version published in:
http://oatao.univ-toulouse.fr/24492
To cite this version:
Blazquez-Alcover, Ignacio and Rousse, Gwenaelle and Alves Dalla Corte,
Daniel and Badot, Jean-Claude and Grimaud, Alexis and Rozier, Patrick
and
Tarascon, Jean-Marie Improving ionic conductivity by Mg-doping of A2SnO3
(A=Li+, Na+). (2017) Solid State Ionics, 308. 16-21. ISSN 0167-2738
Improving ionic conductivity by Mg-doping of A
2
SnO
3
(A = Li
+
, Na
+
)
I. Blazquez-Alcover
a,d, G. Rousse
a,b,d, D. Alves Dalla Corte
a,d, J.C. Badot
c, A. Grimaud
a,d,
P. Rozier
d,e, J.M. Tarascon
a,b,d,⁎aCollège de France, Chaire de Chimie du Solide et de l'Energie, UMR 8260, 11 place Marcelin Berthelot, 75231 Paris Cedex 05, France bSorbonne Universités, UPMC Univ Paris 06, 4 place Jussieu, F-75005 Paris, France
cChimie ParisTech, PSL Research University, CNRS, Institut de Recherche de Chimie Paris, 75005 Paris, France dRéseau sur le Stockage Electrochimique de l'Energie (RS2E), FR CNRS 3459, France
eUniversity of Toulouse III Paul Sabatier, CIRIMAT, CNRS, UMR 5085, 31062, Toulouse Cedex 09, France
A R T I C L E I N F O
Keywords: Ionic conductivity Solid electrolytes All-solid-state batteries Layered oxides Neutron diffractionA B S T R A C T
The search for Li ions conducting ceramics is burgeoning, owing to the regain interest for solid state batteries. Here we investigate the effect of Mg substitutions on the ionic conductivity of the A2SnO3(A = Li, Na) phases.
Pure A1.8Mg0.1SnO3and A2.2Mg0.1Sn0.9O3were structurally characterized and their ionic conductivity was
measured by AC impedance spectroscopy. We show a decrease of the activation energy with increasing the Mg substitution and found ionic conductivities three and two orders of magnitude higher for Li2.2Mg0.1Sn0.9O3and
Na1.8Mg0.1SnO3as compared to pristine Li2SnO3and Na2SnO3, respectively. Neutron diffraction was used to
determine the Mg localization in the crystal structure and to provide a rationale for the ionic conductivity changes. Our results confirm the high sensitivity of the ionic conductivity on chemical substitutions, even limited ones.
1. Introduction
Liquid electrolyte based Li ion batteries are the best candidates to equip electrical devices (vehicles, smart phones…) because of their high energy density[1,2]. However, a major drawback associated to the use of non aqueous liquid electrolytes is safety, with risks of fires under harsh operating conditions[3,4]. Therefore, constant efforts are being made to replaceflammable liquid electrolytes with solid electrolytes, in order to design safer all solid state batteries. Research towards Li(Na) based ionic conducting membranes has been intense in the 1980's, but rapidly falls into oblivion because of i) the lack of suitable high ionic conducting materials, ii) the weak rate and cycling capabilities of assembled batteries due to poor interfaces and iii) the high moisture sensitivity of highly conducting sulfides which renders their manipula tion difficult without mentioning the possible release of toxic H2S or
SO2[5].
Thirtyfive years have passed and research in solid state batteries is getting back momentum owing to the foreseen interests of the auto motive industry. This renaissance has led researchers to revisit the thio LISICON solid solutions with composition Li4−xGe1−xPxS4(x = 0.75).
Recently, Kanno uncovered a new composition with this family with significantly improved Li ion conduction which is now reaching the values usually achieved for liquid electrolytes at room temperature.
This discovery has been made possible by moving towards the tetra gonal solid solution with composition Li11−xM2−xP1+xS12(M = Si, Ge,
Sn) which displays Li+ion conductivities on the order of 10− 2S·cm− 1 at room temperature for Li10GeP2S12and even higher for Li11Si2PS12 [6,7]. Taking a different approach, Holtzmann et al. recently reported
nearly similar ionic conductivity in the layered sulfide phases Li0.6[Li0.2Sn0.8S2] [8]. These findings provide ionic conductors with
high ionic conductivity, but did not address the manipulation issues pertaining to the use of sulfide compounds, neither fully solved the S Li interface stability. For instance, it was shown that Li4−xGe1−xPxS4
degrades into Li3P, Li2S and Li Ge alloy when in contact with Li, hence
leading to an increase of the interfacial resistance[9]. Thanks to their greater stability towards Li, oxides could then appear as an alternative to sulfides, hence our search towards Li(Na) ionic conducting oxides besides the LISICON, NASICON, perovskites or garnet families already intensively studied[10 12].
Interestingly, the phase Li0.6[Li0.2Sn0.8S2] previously mentioned can
simply be viewed as deviating from today's Li rich layered oxides, the so called Li rich NMC (ex: Li1[Li1/3Ru2/3O2]) that are being presently
intensively studied as positive electrodes because of their staggering capacities. The difference simply resides in the facts that we are using i) O rather than S, ii) redox active d metals as opposed to a non reductive one (Sn is 4d10) for ensuring minimum electronic conductivity and iii) a
⁎Corresponding author at: Collège de France, Chaire de Chimie du Solide et de l'Energie, UMR 8260, 11 place Marcelin Berthelot, 75231 Paris Cedex 05, France.
E-mail address: jean-marie.tarascon@college-de-france.fr(J.M. Tarascon).
Patterns were first recorded with a Bruker D8 Advance diffract
Ø = 0.7 mm), with a wavelength of 0.41365 Å at the 11 BM beamline in the Argonne National Laboratory. However, the Na compounds were slightly decomposed because of air exposure and it was not possible to make a reliablefitting. Neutron powder diffraction was carried out for all the samples on the D1B diffractometer at the Institute Laue Langevin with a wavelength of 1.2882 Å and the powder placed in a Ø = 5 mm vanadium can. All the samples were refined using Rietveld method[13]
as implemented in FullProf software[14].
Attempts to use transmission electronic microscopy to perform localized chemical analysis were not successful because of the phase instability under electron beam.
2.2.2. Ionic conductivity
To carry on the impedance measurements, samples of around 250 mg were pressed into pellets with 10 mm diameter and around 1 mm thickness. These pellets were sintered at 950 °C for 6 h and cooled down at 1 °C/min rate. All the sintered pellets have a real density between 70 and 80% with respect to the theoretical density of Li2SnO3
(4.99 g/cm3). Different attempts were made to improve the pellets
density by Spark Plasma Sintering (SPS). However, all of these attempts led to phase decomposition by a reduction reaction occurring during the sintering process. Ionic conductivity of the different materials was determined via impedance spectrometry using a MTZ 35 impedance analyzer (Bio Logic). The measurements were performed using plati num blocking electrodes, in a range of frequencies from 1 MHz to 1 Hz with an applied ac voltage of 500 mV. A thin C foil was placed between the Pt and the pellet in order to improve the electrode contact. Data were collected in a temperature range from 150 °C to 450 °C every 25 °C.
3. Structural characterization
Neutron and synchrotron powder diffraction patterns of Li2SnO3
and Na2SnO3werefitted with the space group C 2/c using the structural
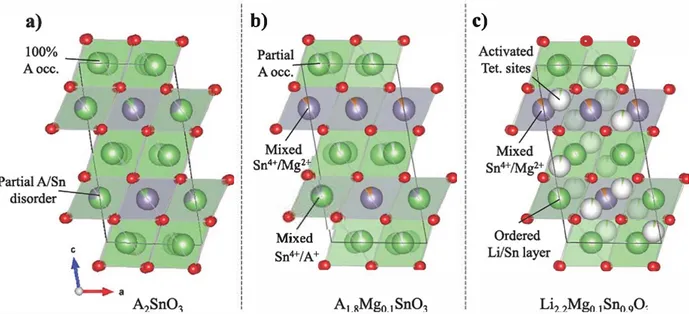
model previously reported in the literature [15,16]. Refined lattice parameters are reported inTable 1and indicate, as expected from the difference in ionic radii, a larger interlayer distance for the Na based compound compared to the Li one. The structure is shown inFig. 1(a) and consists in stacking of octahedral layers of [AO6] (A = Li, Na) and
1/3 [AO6] 2/3 [SnO6] layers arranged in a honeycomb pattern. From
here, these layers will be referred to as“A layer” or “Sn layer”. It is worth to notice the observed differences for the peaks in the 2θ region = [16 22°] for neutrons, [5 6.5°] for synchrotron and related to the Li/Sn ordering in the Sn layers. The broadening observed for
Table 1
Structural and ionic conductivity parameters (activation energies and extrapolation of the ionic conductivities at room temperature) of Li and Na based compounds.
Composition Unit cell parameters Ionic conductivity
a (Å) b (Å) c (Å) γ (°) V (Å3) E a(eV) σ298 (S cm 1) μ298 (σ298∙NLi1V1) Li Li1.8Mg0.1SnO3 5.291(1) 9.172(3) 10.018(9) 100.19(7) 478.55(1) 0.82 1.92·10 11 2.23·10 14 Li2SnO3 5.298(3) 9.183(4) 10.032(2) 100.23(3) 480.37(8) 0.90 6.28·10 13 6.54·10 16 Li2.2Mg0.1Sn0.9O3 5.289(8) 9.195(0) 10.061(2) 100.49(4) 481.19(3) 0.76 2.46·10 10 2.32·10 13 Na Na1.8Mg0.1SnO3 5.504(4) 9.525(2) 11.115(8) 99.49(0) 574.82(1) 0.72 1.97·10 11 1.90·10 14 Na2SnO3 5.525(7) 9.568(4) 11.085(6) 99.64(1) 577.83(9) 0.83 2.13·10 13 1.84·10 16 Na2.2Mg0.1Sn0.9O3 5.511(6) 9.558(4) 11.088(9) 99.74(2) 575.75(7) 0.78 9.02·10 13 –
full Li+ containing layer rather than a deficient one. Gladly, the A 2MO3
(A = Li, Na) family contains other members that are electronic insulator with non reducing metals such as Li2TiO3, Li ZrO2 3 or
(Li,Na)2SnO3. In this work, we use the latter compound as our
playground to check the feasibility of triggering high ionic conductivity within this type of electronic insulating materials. We tried to enhance its ionic conductivity by playing with the alkaline content via either chemical cationic substitution or reducing conditions to create O vacancies.
Since various attempts to create oxygen vacancies via the reduction of Li2SnO3 by CaH2 or milder reducing agents in sealed ampoules
always lead to decomposition into Sn metal, we successfully favor the chemical substitution of either the alkali cation or tetravalent Sn by divalent Mg2+ ions to create cationic vacancies or new cationic
interstitial sites. The aim of this research will be to compare the conductivity mediated by Li vacancies (A deficient A2−2xMgxSnO3
compounds) and the one given by diffusion through interstitial tetra hedral sites (A rich A2+2xMgxSn1−xO3 compounds). We show that the
ionic conductivity of the chemically substituted A2−2xMgxSnO3
(x = 0.1) and A2+2xMgxSn1−xO3 (x = 0.1) with A = Li+, Na+ phases
increased upon Mg substitution and we explain such an increase in light of the crystallographic sites occupied by the substituent as deduced by neutron studies.
2. Experimental section 2.1. Synthesis
Pure A2SnO3, A1.8Mg0.1SnO3 and A2+xMgxSn1−xO3 phases (x = 0.1,
A = Li+ or Na+) were obtained by classical solid state reaction. Li2CO3
(Sigma Aldrich, 99%), Na2CO3 (Sigma Aldrich, 99.5%), SnO2 (Sigma
Aldrich, < 100 nm avg. part. size) and Mg(OH)2 (Sigma Aldrich, 95%)
were used as reactants without further purification. Stoichiometric amounts of precursors were weighted with a 10% Li excess in order to compensate for eventual Li loss during the high temperature treatment. In all the cases mixed precursors were ball milled for 1 h and pressed into a pellet subsequently. The different pellets were heated at 950 °C in a furnace for 36 h, with two intermediate grinding in an agate mortar every 12 h. Note that attempts to further dope A2SnO3 with Mg were
unsuccessful. Doping Mg on the Li site led to the appearance of the double hexagonal phase Li1.6Mg1.6Sn2.8O8, while doping on the Sn site
gave MgO and Li8SnO6 as secondary phases.
All the samples were structurally characterized by complementary laboratory, synchrotron X ray diffraction and neutron powder diffrac tion prior to be measured for their conductivity measurements. 2.2. Characterization
2.2.1. X ray diffraction
ometer equipped with a Cu Kα radiation (λ1 = 1.54056 Å,
λ2 = 1.54439 Å) and a LynxEye detector to check the purity of the
samples. The structural characterization of the different compounds was carefully done by combined neutron and synchrotron X ray powder diffraction. The synchrotron patterns were collected for A2SnO3 and
b)
Sn
4+fMg2+Mixed
c)
0
•
Fig. 1. Structural models of a) A,SnO:,, b) AuMB-0.1SnO3 (A = LI, Sn) and c) Ll:,..MB-O.,Sno.90.. A 1s green, Sn 1s purple, 0 1s red and vacancles are white. (For lnterpretatlon of the
references to color ln thls figure legend, the reader 1s referred to the web version of thls article.)
these peaks is indicative of the presence of stacking faults, as previously described in the literature [16,17].
Let us now consider the structure of the Mg doped samples. At a first sight, patterns do not differ much from the stoichiometric pristine ones, indicating that the overall structure is kept. In the Li case, the unit cell increases regularly with the Li amount, but in the Na case, the compound with the greater Na content doesn't follow the trend (see Table 1). Thus, A1.8Mgo_1SnO3 was obtained for both alkaline metals, whereas A2.2M&o.1Sno.9O3 was only achieved with Li as we will explain in greater details hereafter.
Concerning AL8Mg0_1SnO3, the structure was further explored to precisely determine the magnesium atomic positions in spi te of its low quantity. Different structural models were constructed with magnesium ions sitting i) in the Li positions pertaining to the alkaline or metal layers in emptied octahedral sites, or ü) in the tetrahedral sites present in both layers. The model with Mg2 + in the different tetrahedral sites was quickly discarded, since they lead to thermie agitation values out of physical meaning. Calculations for the other two models (octahedral Mg either in Li or metal layer) lead only to slightly different values between the set of B;,o and �ragg parameters. The best fitted model, having the lowest �mgg and Rwp values of 7.6%, 14.7% and 7.00/4, 11.2% for Li and Na based compounds, respectively, is presented in
Fig. l(b). lt consists of a mixed Sn/Mg and Sn/A metal layer together with a A layer containing the proper amount of cationic vacancies to maintain the material electro neutrality, leading to the overall compo sition of A1.8M&o.1SnO3.
Turning to the A2.2Mgo.1Sno.9O3 compounds, we first note for A = Na the appearanœ of Bragg peaks associated to MgO impurities (see Fig. 2) that we could not eliminate despite of efforts paid on the synthesis conditions (annealing rates, resting temperatures or quench vs. slow cooling temperatures), henœ we concluded that pure phase A2.2Mgo.1Sno.9O3 could not be obtained for Na.
In contrast, the compound of nominal composition "Lh.2M&o.1Sno_9Ü3" shows a diffraction pattern alike pristine Li2SnÜ3 and free of extra peaks. Moreover, a more attentive look at this pattern reveals remarkable differences with namely i) some relative intensity changes between the peaks and ü) the sharpening of the superstructure reflections (insets Fig. 3) with respect to the pristine and the Li deficient samples, indicating an absence of stacking faults. In absence of extra phase, the need to maintain the compound electro neutrality implies the partial occupancy of some tetrahedral sites by Li. Assuming that Mg atoms occupy the same metal layer sites as for the Li deficient
compounds; several models were tested to refine the neutron data. The first idea to corne to mind was to place all the extra Li in tetrahedral sites; nevertheless no satisfactory fitting was achieved using this mode1 The best fit CRs = 5.25%, Rwp = 10.8%) was finally obtained by partially occupying some of the tetrahedral sites but also limiting the occupancy of the Li metal layer position to 90%, henœ leaving some vacancies in this layer. Therefore, the structure can be written as Li1..sCoct.)Li0.25(tetr.)[Li0.4s0,_05Sno.�&o.i1O3. Fig. l(c) shows the final structural model. Such a migration of Li from octahedral metal layer sites to tetrahedral sites does not corne as a total surprise as we have shown that such a migration path can be easily triggered in Li rich NMC during Li uptake removal [18]. Moreover, the absence of stacking faults (the pattern shows well defined and sharp superstructure peaks) might also be attributed to the presenœ of some Li in these tetrahedral sites, as they drive the stacking from one honeycomb LiM2 layer to another. Overall, it results from this structural data that the chemical substitution by Mg leads to the creation of alkaline vacancies which are usually viewed as a possible attribute to enhance ionic conductivity [19].
4. Impedance spectroscopy
We measured the ac conductivity for all compounds as a function of temperature till 450
•c
every 25•c
using samples prepared the way described in the experimental section. Fig. 4 shows typical Nyquist impedanœ plots of the sintered pellets at 300•c
for the Li (Fig. 4(a)) and Na (Fig. 4(b)) series. The spectra recorded for each members of the series can be described by a depressed semicircle at high intermediate frequencies (between 106 and 1Q2 Hz) followed by a low frequency (from 1Q2 Hz) spike characteristic of the blocking of mobile Li ions at the electrode interface with Pt blocking electrode. This low frequency behavior implies that the sample conductivity is inherently ionic; moreover, DC experiments were carried out for the Li rich phase and indicated that the electronic contribution to the total conductivity is negligible (see SI). The depression of the semi circle at high frequency being too high to account for inhomogeneities, it must be decoupled in two different contributions. For clarity, both contributions are shown by two dash semicircles for pristine compounds in Fig. 4. These two components can be assigned to the bulk and grain boundary conductiv ities at high and intermediate frequencies, respectively. The shape of the impedanœ spectra is preserved in all the range of different temperatures here explored, with therefore a shift to higher frequenciesfor both bulk and grain boundary contributions. This behavior implies that bulk and grain boundary conductivity can be distinguished in the whole range of temperatures measured.
All data were fitted according to the equivalent circuit shown in
Fig. 4(c). Bulk conductivities for each temperature were calculated using the following formulaσb= d/(S·Rb), with d, S and Rbbeing the
thickness, the surface of the pellet and the observed resistance, respectively. The temperature dependence of the bulk conductivity is
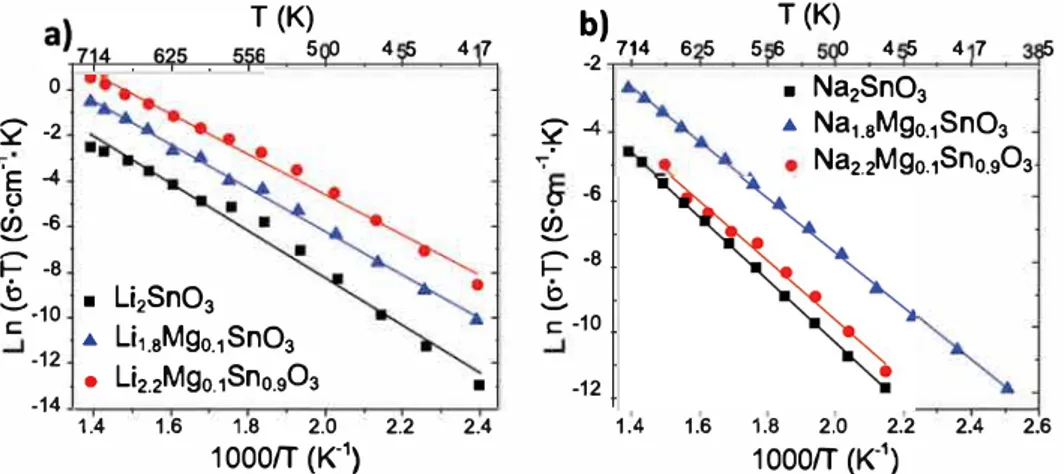
plotted in Fig. 5, showing an Arrhenius behavior with a linear
dependence on 1/T for the bulk ionic conductivity. The activation energies were then extracted from the Arrhenius plots according to the equation: ⎛ ⎝ ⎜ ⎞⎠⎟ Ln(σ·T) = −E k · 1 T + LnA, a b
where kbis Boltzmann constant and T the temperature in Kelvin. All
activation energies as well as the conductivities at room temperature, obtained by extrapolation, are listed inTable 1.
Fig. 2. Fitted neutron diffraction pattern of Na2.2Mg0.1Sn0.9(a). Zoom showing the additional peaks before (down) and after (up) add MgO as impurity (b).
-16 Ê-120 � -8 N -4
a)
U2Sn03 Li1 .8Mgo.18n03 u2_2Mgo. 1sno_903 3 03 10· 1 Hz 2 Hz 4 8Z' (kn·cm)
c)
2·102 Hz 12 16 RI Rb 1 R1 Ê-450 0 è: �-300N
-150b)
Rgb 1 R2 150 300 450 600Z' (kn·cm)
W1 0Fig. 4. Nyquist plots at 300
•c
for LI (a) and Na (b) compounds. Pristlne compounds are represented ln red, A-poor ln blue and A-rich ln red. Dashed senûdrcles point bulle (black) and grain boundary (green) conductivltles for both pristlne compounds. llquivalent circuit used 10 fit the data (c). (For ùtterpretatlon of the referenœs 10 color ln this figure legend, the reader is referred 10 the web version of this article.)For both Li and Na deficient based compounds we usually observe a two orders of magnitude bulk ionic conductivity increase at room temperature as well as a decrease in the activation energy of nearly -0.1 eV with respect to the pristine. Interestingly, an even larger (three orders of magnitude, from 6.28·10-13 to 2.46•10-10s-cm-1) increase is observed for the Li rich compound which also shows lower activation energy with respect to the pristine (from O. 90 to O. 76 eV). Lastly, the Na rich compound does not follow the same trend, as it behaves nearly as the pristine sample. This is not a surprise as we have shown by structural characterization that this phase was not formed.
Assuming the ionic conductivity to follow Nernst Einstein equation
(a = N·qµ, with N the number, q the charge and µ the mobility of the
charge carriers), the difference in conductivity measured for both the Li and the Na solid conductors cannot be explained by the change in charge carriers concentration (from A1.8M&o.1SnO3 to A2.2M&o.1Sflo.9Ü3, with A being Li+ and Na+). Based on the structural model previously unraveled, one can tentatively assign the difference in conductivity to structural features. When increasing the amount of Li+ vacancies going from Li2SnO3 to Li1.8M&o.1SnO3, the overall conductivity increases by an order of magnitude (Fig. Sa). This enhanced conductivity may demonstrate that alkaline cations diffusion in layered compound can be increased by vacancies mediated diffusion. Same applies to Na based layered compounds, going from Na�nO3 to NaL8M&o.1SnO3 (Fig. Sb). Moreover, when triggering the partial occupancy of Li+ into tetrahedral
T (K)
5 0 4 5 4 7 0sz
-2 ";E
-4 0è,
-6i='
-8 t)•
Li2SnO3 �-10 Li1.sM90.1SnO3•
-12 • Li2.2M90.1Sno,9Ü3•
-14 1.4 1.6 1.8 2.0 2.2 2.41000/T (K
1)position (both in the A and the Sn layers), the overall conductivity is further increased as compared to vacancies containing compounds (i.e. going from Lil.8Mgo.1SnO3 to Li2.2M&o.1Sno.9O3, Fig. Sa). This could
indicate that Li+ diffusion mediated by tetrahedral sites would provide
lower energy barrier for Li+ to diffuse for layer compounds. Indeed, it is
well known that occupying additional interstitial sites can lower the
activation barrier for the Li migration in Li ion conductors (20). Hence,
we believe that even if the octahedral sites are full y occupied, partially occupying the tetrahedral sites may significantly enhance the diffusion in layered compounds in the ab planes. Moreover, considering a 3D diffusion between the different layers, the partial occupation of Li in the octahedral sites of the Li(Mg/Snh layer triggered by the Mg substitu tion might further enhance the Li diffusion through these planes.
Similar examples of ionic conductivity improvement by adding Li+ in
interstitial sites have been recently reported (21). This observation is in
line with, for instance, previous computational work for layered
cathode materials where enhanced Li+ diffusion was proposed when
triggering a diffusion mechanism through tetrahedral sites (22,23).
Unfortunately, this observation cannot be made for the Na based layered compounds, since it cannot be synthetized in its over stoichio metric form. lnstead, the conductivity looks like the stoichiometric
Na2SnO3 compound, where no vacancies and no tetrahedral sites take
part to the diffusion process.
Overall, using the layered A2SnO3 family as a model family, some
b)
-2 114 6 5 5 6T (K)
0 4 5 4 7 5 ■ Na2SnO3�
-4 • Na1.5MQ0.1SnO3 Na2.2M90.1 Sno_9Ü3 "; 0 -6è,
i='
-8�
c: -10 -12 1.4 1.6 1.8 2.0 2.2 2.4 2.61000/T (K
1)5. Conclusion
We have reported the partial substitution of either Li(Na) or Sn by Mg into the electronic insulating Li(Na)2SnO3phases to successfully
produce the Mg substituted the Li(Na)1.8Mg0.1SnO3 and
Li2.2Mg0.1Sn0.9O3 phases. From neutron data, we could deduce that
the Mg atoms are constantly located within the metal layer sites independently of whether we are dealing with Li deficient or Li excess phases. Moreover, we show that in both cases the Mg substitution is accompanied by the creation of vacancies located in the Li layer for Li (Na)1.8Mg0.1SnO3 and in the metal layer for the Li2.2Mg0.1Sn0.9O3.
Worth mentioning is also the partial occupancy of the tetrahedral sites pertaining to the Li or metal layers to accommodate the extra Li.
Additionally, we show that the Mg substituted phases have higher ionic conductivities and lower activation energies than the pristine phase with the best values being obtained for the Li2.2Mg0.1Sn0.9O3
which show a room temperature conductivity of 2.46·10− 10S·cm− 1 and activation energy of 0.7 eV. Needless to say those conductivities are quite too low for these materials to be ever considered as ceramic electrolytes for solid state batteries. Moreover, we experienced that these phases are electrochemically instable against Li and decompose in Sn metallic via conversion reactions for voltages below 1 V.
Fundamental wise, the ionic conductivity improvement is most likely rooted in the Mg driven formation of vacancies which act as defects favoring ionic conductivity. Such a simplistic view cannot however explain that the ionic conductivity increase more for the Li rich as opposed to the Li deficient phases, while having the same amount of Mg doping. Although we don't want to over interpret our structural assignment regarding vacancies, we found that they were greater for the Li1.8Mg0.1SnO3phase, the opposite of what we could
have expected. To account for such an explanation, we should recall that the ionic conductivity is defined by σ = neμ with n being the number of defects and μ is the mobility. So most likely, such defect mobility is at the origin of the greater ionic conductivity observed for the Li2.2Mg0.1Sn0.9O3phase.
In short, this study further confirms that changes in the mobile ion contents, which lead to the creation of disorder by vacancies or interstitial sites, is an interesting tool to enhance conductivity proper ties. Therefore, conductivity wise the Li rich layered oxides, in contrast to their Li0.6[Li0.2Sn0.8S2]sulfur counter parts, are not the suitable
playground for spotting practically viable ionic conductors. Acknowledgements
We thank the Réseau sur le Stockage Electrochimique de l'Energie (RS2E) for funding. Use of the 11 BM mail service of the APS at Argonne National Laboratory was supported by the U.S. Department of Energy under Contract No. DE AC02 06CH11357 and is greatly acknowledged. We also thank Vivian Nassif for her help in neutron diffraction experiments performed at the D1B diffractometer at the Institut Laue Langevin.
Appendix A. Supplementary data
Supplementary data to this article can be found online athttp://dx.
doi.org/10.1016/j.ssi.2017.05.013. References
[1] J. Janek, W.G. Zeier, A solid future for battery development, Nat. Energy 1 (2016) 16141,http://dx.doi.org/10.1038/nenergy.2016.141.
[2] D. Larcher, J.-M. Tarascon, Towards greener and more sustainable batteries for electrical energy storage, Nat. Chem. 7 (2014) 19–29,http://dx.doi.org/10.1038/ nchem.2085.
[3] S. Gallagher, Boeing's Dreamliner Batteries“Inherently Unsafe”—And Yours May be Too, Ars Tech, 2013, http://arstechnica.com/business/2013/01/boeings-dreamliner-batteries-inherently-unsafe-and-yours-may-be-too/(accessed November 29, 2016).
[4] F. Meier, C. Woodyard, Feds Review Third Tesla Fire as Shares Fall Again, USA TODAY, (2016) (accessed November 29, 2016),http://www.usatoday.com/story/ money/cars/2013/11/07/third-fire-in-tesla-model-s-reported/3465717/. [5] M. Tatsumisago, M. Nagao, A. Hayashi, Recent development of sulfide solid
electrolytes and interfacial modification for all-solid-state rechargeable lithium batteries, J. Asian Ceram. Soc. 1 (2013) 17–25,http://dx.doi.org/10.1016/j.jascer. 2013.03.005.
[6] N. Kamaya, K. Homma, Y. Yamakawa, M. Hirayama, R. Kanno, M. Yonemura, T. Kamiyama, Y. Kato, S. Hama, K. Kawamoto, A. Mitsui, A lithium superionic conductor, Nat. Mater. 10 (2011) 682–686,http://dx.doi.org/10.1038/nmat3066. [7] S. Hori, M. Kato, K. Suzuki, M. Hirayama, Y. Kato, R. Kanno, Phase diagram of the
Li4GeS4-Li3PS4quasi-binary system containing the superionic conductor
Li10GeP2S12, J. Am. Ceram. Soc. 98 (2015) 3352–3360,http://dx.doi.org/10.1111/ jace.13694.
[8] T. Holzmann, L.M. Schoop, M.N. Ali, I. Moudrakovski, G. Gregori, J. Maier, R.J. Cava, B.V. Lotsch, Li0.6[Li0.2Sn0.8S2]– A layered lithium superionic conductor,
Energy Environ. Sci. (2016),http://dx.doi.org/10.1039/C6EE00633G. [9] S. Wenzel, S. Randau, T. Leichtweiß, D.A. Weber, J. Sann, W.G. Zeier, J. Janek,
Direct observation of the interfacial instability of the fast ionic conductor Li10GeP2S12at the lithium metal anode, Chem. Mater. 28 (2016) 2400–2407, http://dx.doi.org/10.1021/acs.chemmater.6b00610.
[10] N. Anantharamulu, K. Koteswara Rao, G. Rambabu, B. Vijaya Kumar, V. Radha, M. Vithal, A wide-ranging review on Nasicon type materials, J. Mater. Sci. 46 (2011) 2821–2837,http://dx.doi.org/10.1007/s10853-011-5302-5. [11] V. Thangadurai, S. Narayanan, D. Pinzaru, Garnet-type solid-state fast Li ion
conductors for Li batteries: critical review, Chem. Soc. Rev. 43 (2014) 4714–4727,
http://dx.doi.org/10.1039/c4cs00020j.
[12] J.C. Bachman, S. Muy, A. Grimaud, H.-H. Chang, N. Pour, S.F. Lux, O. Paschos, F. Maglia, S. Lupart, P. Lamp, L. Giordano, Y. Shao-Horn, Inorganic solid-state electrolytes for lithium batteries: mechanisms and properties governing ion conduction, Chem. Rev. 116 (2016) 140–162,http://dx.doi.org/10.1021/acs. chemrev.5b00563.
[13] H. Rietveld, A profile refinement method for nuclear and magnetic structures, J. Appl. Crystallogr. 2 (1969) 65–71.
[14] J. Rodríguez-Carvajal, Recent advances in magnetic structure determination by neutron powder diffraction, Phys. B Condens. Matter 192 (1993) 55–69. [15] G. Kreuzburg, F. Stewner, R. Hoppe, Die Kristallstruktur von Li2SnO3, Z. Anorg.
Allg. Chem. 379 (1971) 242–254.
[16] N.V. Tarakina, T.A. Denisova, L.G. Maksimova, Y.V. Baklanova, A.P. Tyutyunnik, I.F. Berger, V.G. Zubkov, G. Van Tendeloo, Investigation of stacking disorder in Li2SnO3, Z. Für Krist. Suppl. 2009 (2009) 375–380,http://dx.doi.org/10.1524/ zksu.2009.0055.
[17] A. Boulineau, L. Croguennec, C. Delmas, F. Weill, Structure of Li2MnO3with
different degrees of defects, Solid State Ionics 180 (2010) 1652–1659,http://dx. doi.org/10.1016/j.ssi.2009.10.020.
[18] M. Sathiya, A.M. Abakumov, D. Foix, G. Rousse, K. Ramesha, M. Saubanère, M.L. Doublet, H. Vezin, C.P. Laisa, A.S. Prakash, D. Gonbeau, G. VanTendeloo, J.-M. Tarascon, Origin of voltage decay in high-capacity layered oxide electrodes, Nat. Mater. 14 (2014) 230–238,http://dx.doi.org/10.1038/nmat4137.
[19] R. Chen, W. Qu, X. Guo, L. Li, F. Wu, The pursuit of solid-state electrolytes for lithium batteries: from comprehensive insight to emerging horizons, Mater. Horiz. 3 (2016) 487–516,http://dx.doi.org/10.1039/C6MH00218H.
[20] T. Asai, S. Kawai, NMR study of Li+-ion diffusion in the solid solution Li 3+x(P1 x,
Six) O4> with theγII-Li3PO4structure, Solid State Ionics 7 (1982) 43–47. [21] M. Amores, S.A. Corr, E.J. Cussen, Synthesis and ionic conductivity studies of
In-and Y-doped Li6Hf2O7 as solid-state electrolyte for all-solid state Li-ion batteries, J. Electrochem. Soc. (2017) A6395–A6400.
[22] Z. Rong, R. Malik, P. Canepa, G. Sai Gautam, M. Liu, A. Jain, K. Persson, G. Ceder, Materials design rules for multivalent ion mobility in intercalation structures, Chem. Mater. 27 (2015) 6016–6021,http://dx.doi.org/10.1021/acs.chemmater. 5b02342.
[23] Y. Wang, W.D. Richards, S.P. Ong, L.J. Miara, J.C. Kim, Y. Mo, G. Ceder, Design principles for solid-state lithium superionic conductors, Nat. Mater. 14 (2015) 1026–1031,http://dx.doi.org/10.1038/nmat4369.
trends can be seen. Even though the ionic conductivity is very limited, we hope that this will bolster further development of layered com pounds as ionic conductors, given that the alkaline vacancies mediated diffusion mechanism as well as the diffusion mediated by tetrahedral sites can be further confirmed for other layered compounds.