délivré en cotutelle par
l'Université Toulouse III - Paul Sabatier (France) et
l'Université Technique de Liberec (Rep. tchéque)
Spécialité: Génie ElectriqueJan KOPRNICKÝ
Modèles de Conductivité Electrique pour
lampes à Décharge
Electric Conductivity Model of Discharge
Lamps
Soutenu le 14 février 2008 devant la commission d'examen:
V. AUBRECHT, Professeur, Brno University of Technology, rapporteur P. CAMBRONNE, Professeur, Université Paul Sabatier
J. J. DAMELINCOURT, Professeur Emérite, Université Paul Sabatier J. NOSEK, Professeur, Technical University of Liberec
A. RICHTER, Professeur, Technical University of Liberec, co-directeur G. ZISSIS, Professeur, Université Paul Sabatier, co-directeur
LAPLACE, UMR 5213 CNRS-INP-UPS, 118 rte de Narbonne, F-31062 Tou-louse cedex 9, France Ecole Doctorale GEET
of Discharge Lamps Doctoral Candidate: Ing. Jan Koprnický
Study programme: 2612V Electrical Engineering and Computer Science Specialization area: 2612V045 Technical Cybernetics
Department: Institute of Mechatronics and Technical Informatics Faculty of Mechatronics and Interdisciplinary Engineering Studies
Technical University of Liberec
Center for Plasma Physics and Applications in Toulouse
University Paul Sabatier Toulouse III Supervisors: Prof. Ing. Aleš Richter, CSc. (FM TUL)
Prof. Dr. Georges Zissis (CPAT UPS) Copyright © 2007 by Jan Koprnický. Typeset in LATEX 2ε
Poděkování
Tato práce vznikla pod trpělivým vedením Prof. Ing. Aleše Richtera, CSc., kterému bych rád poděkoval za mnohé rady, připomínky a nezbytné materi-ální a organizační zajištění v průběhu studia.
Rád bych též poděkoval přátelskému kolektivu katedry elektrotechniky jmenovitě pak Mírovi Novákovi, Honzovi Václavíkovi, Leoši Beranovi, Jiřímu Kubínovi, Tomáši Slukovi, Honzovi Krausovi, Patrikovi Endlerovi, Petrovi Přívratskému, Martinovi Diblíkovi, Pepovi Černohorskému, Honzovi Vodola-novi, Tomáši Mikolandovi, s kterými jsem sdílel slasti i strasti výuky a s nimiž jsem často v plodných diskusích nalézal mnohé odpovědi nejen na technické otázky.
Na tomto místě bych také rád poděkoval přátelům, kteří mi vždy vyšli vstříc, zvláště pak Pavlovi Herajnovi a Honzovi Alešovi, neboť jsou podi-vuhodní.
Děkuji úterním podvečerům a společnosti, která mne provázela celým mým studiem.
Největší dík však patří mé rodině a přítelkyni, bez jejichž podpory a po-rozumění bych se neobešel.
Acknowledgement
I would like to sincerely thank my advisor at CPAT, prof. Georges Zissis, for his guidance and support throughout this work.
I would like to extend my sincerely thanks to colleagues of CPAT Bruno Laffitte, Adrian Harabor, Sounil Bhosle, David Buso, Jasmine Legere and others for their valuable discussions, hospitality and friendly atmosphere at CPAT and outside.
Special thanks to Dr. ir. Pascal Dupuis, whose advises and collaboration gave me a lot.
At last I would like to thank to coordinator of bilateral cooperation be-tween TUL and UPS Mrs. Josiane Poque for her kindness in organisation and official matters.
This work has been supported by the EU COST action n◦529 - Efficient
Lighting for the 21st Century and by the Ministry of Education of Czech
Republic (Project Code MSM 242200002).
Tato dizertační práce se zabývá modelováním světelných výbojů pro popis elektrických obvodů. Nejedná se o modelování plazmatu, ve smyslu mode-lování jeho vnitřních dějů, ale o využití rovnice elektrické vodivosti světelného výboje, která však vychází z jeho fyzikálního rozboru.
Parametry vodivostního modelu jsou určeny z naměřených napěťových a proudových charakteristik v praxi běžně používaných výbojek bez znalosti technologických dat od výrobce. Zpracování naměřených dat u(t), i(t), ap-likace idetifikačního algoritmu a simulace elektrických obvodů je provedena v prostředí Matlab, resp. Matlab Simulink.
Výsledky simulace jsou porovnány s naměřenými údaji. Model je ověřen v simulacích nízkotlakých i vysokotlakých výbojek v zapojení s elektromag-netickými předřadníky.
Klíčová slova: dynamický vodivostní model, identifikace parametrů,
model v Matlabu, nelineární zátěž, simulace elektrických obvodů, světelené zdroje, výbojky.
Annotation
This Ph.D. thesis deals with light discharges modelling for description of electric circuits. It is not modelling of internal behaviour of a plasma, but its equivalent conductivity.
The parameters of conductivity model are determined from measured voltage and current characteristics of discharge lamps. This model does not require any technological data from lamp producers. The Matlab/Matlab Simulink is used for data processing of u(t), i(t), application of identification algorithms and electric circuits simulation.
The simulated results are compared with measurements. The model is tested in simulations of low and high pressure discharge lamps in circuits with magnetic ballasts.
Key words: discharge lamps, dynamic conductivity model, light sources,
Matlab model, nonlinear load, parameter estimation, simulation of electric circuits.
Annotation
1Cette thèse de doctorat est consacrée à la modélisation de décharges lumi-nescentes pour la description de circuits électriques. L’objet n’est pas la modélisation du comportement interne d’un plasma, mais de sa conductivité équivalente.
Les paramètres de la conductivité sont déterminés à partir des carac-téristiques de tension et de courant de lampes à décharges. Ce modèle ne requiert aucune donnée technologiques de la part des fabricants de lampe. L’environnement Matlab/Matlab Simulink est utilisé pour le traitement de
u(t), i(t), l’exécution des algorithmes d’identification et la simulation en
ter-mes de circuits électriques équivalents.
Les résultats des simulations sont comparés avec les données mesurées. Le modèle de conductance est testé dans des simulations de lampes à décharge à basse et haute pression, alimentées par ballast magnétique.
Mots Clés: lampes à décharges, modèle de conductance dynamique,
sources d’éclairage, modèle MatLab, charge non-linéaire, estimation de para-mètres, simulation de circuits électriques.
Contents
List of Figures xvi
List of Tables xviii
List of Symbols xix
List of Acronyms xxiii
Introduction to the COST Action no. 529 1
1 Preface 3
1.1 State of the art . . . 4
1.2 Aims of the thesis . . . 6
1.3 Outline of the thesis . . . 6
2 Electric discharge lamps 9 2.1 Physics of discharge lamps . . . 11
2.1.1 Power balance in a discharge . . . 12
2.1.2 Starting and steady states of a discharge . . . 13
2.1.3 Electric characteristics of discharges . . . 14
2.2 Specification of discharge lamps . . . 16
2.3 Low pressure discharge lamps . . . 16
2.3.1 Fluorescent lamps . . . 17
2.4 High pressure discharge lamps . . . 19
2.4.1 High pressure mercury lamp . . . 20
2.4.2 High pressure sodium lamp . . . 21
2.4.3 Metal halide lamp . . . 22
2.5 Electric circuits for electric discharge lamps . . . 23
3 Discharge lamps modelling 27 3.1 Models of nonlinear discharge characteristics . . . 28
3.2.1 Models based on Francis’ postulates . . . 31
3.2.2 Modelling of energy balance equation . . . 34
3.3 G-model of a discharge lamp . . . . 35
3.3.1 Calculation of the G-model . . . . 35
3.3.2 Analytical solution of the G-model . . . . 37
3.4 Identification of model parameters . . . 38
3.4.1 Solution of the optimum problem . . . 39
3.5 The determination and implementation of numerical model . . 39
4 Experiments – data mining for modelling 41 4.1 Measurement devices . . . 41
4.2 Data processing . . . 43
4.2.1 Conductivity computation . . . 43
4.2.2 Offset in measured signals . . . 44
4.2.3 Parts of electric circuits . . . 46
4.2.4 Phasor diagrams . . . 48
4.3 Low pressure mercury lamps . . . 50
4.3.1 Linear fluorescent lamp 58 W . . . 51
4.3.2 Linear fluorescent lamp 36 W . . . 52
4.3.3 Linear fluorescent lamp 18 W . . . 53
4.4 High pressure mercury lamps . . . 55
4.5 High pressure sodium lamps . . . 57
4.6 High pressure metal halide lamp . . . 59
4.6.1 Lamp with magnetic ballast . . . 59
4.6.2 Lamp with electronic ballast . . . 60
4.6.3 Experiments with lamp operation positions . . . 62
4.6.4 Experiments with lamp operation frequency . . . 64
4.6.5 Experiments with changes of supply voltage . . . 66
5 Identification of lamp models 69 5.1 Computation structure . . . 69
5.2 Lamp system . . . 70
5.3 Lamp model . . . 71
5.4 Iterative computation method . . . 72
5.4.1 Graphical user interface for the lamp model identification 73 5.4.2 Results of identifications . . . 76
5.4.3 Results of the identification of 150 W metal halide lamp 76 5.4.4 Results of the identification of fluorescent lamps . . . . 83
5.4.5 Results of identifications of 400 W HPM and HPS lamps 84 5.5 Non-iterative computation method . . . 85
Contents
6 Simulation models 89
6.1 Simulation model of a discharge lamp with a ballast . . . 89
6.1.1 Simulation model of a discharge lamp . . . 89
6.1.2 Simulation model of a magnetic ballast . . . 91
6.1.3 Simulation model of a power supply . . . 91
6.2 Simulation model of a discharge lamp without a ballast . . . . 92
6.3 Visualisation of electric characteristics . . . 92
6.4 Simulation with parameters . . . 92
6.5 Experimental verification . . . 93
6.5.1 Experimental verification with 150 W MHL . . . 94
6.5.2 Experimental verification with 58 W fluorescent lamp . 98 6.5.3 Experimental verification with 400 W HPML . . . 100
6.5.4 Experimental verification with 400 W HPSL . . . 101
7 Conclusion 103 Bibliography 103 A Appendices 113 A.1 Functions of PEM Toolbox of KEL TUL . . . 113
A.2 Parameters of the data acquisition device EMU-2 . . . 114
A.3 Voltage-current characteristics of discharge lamps . . . 115
A.4 Different frequency of the supply voltage . . . 116
A.5 Parameters of lamp models of MHL . . . 125
List of Figures
2.1 Evolution of luminous efficacy of discharge lamps compared to the incandescent lamp [Gen]. . . 10
2.2 Interaction between plasma and electrodes [Gro67]. . . 12
2.3 The general voltage-current characteristics for self-sustained discharges with schematic current regions, redrawn from ref-erence [Gro67]. . . 13
2.4 Part of the dynamic voltage-current characteristic of HID lamp powered by 50 Hz voltage with magnetic ballast. The part with negative differential resistance (Rdif f < 0) is red lined.
Two arrows show the counterclockwise direction of the char-acteristic evolution. . . 15
2.5 Pressure dependance of gas temperature Tg and electron
tem-perature Te in electric discharge [Miš79]. . . 17
2.6 Structure of a LP rare-gas discharge lamp in DC mode [Wha00a, Way71]. . . 18
2.7 The general construction of a high pressure discharge lamp. . . 20
2.8 An arc tube of a high pressure discharge lamp with the char-acteristics of the electric potential in the plasma. . . 21
2.9 Typical electric circuit for discharge lamp with inductive bal-last, starter and compensating capacitor. . . 25
3.1 Nonlinear lamp resistance at high frequency and fitted models for T8/32 W lamp type running at 50 kHz (Plamp = 30 W, R =
656 Ω, k = 2615, A = 278, B = 5740 [RR98]). The two expres-sions of a parabolic function are sketched. . . 30
3.2 Model of the discharge channel. . . 36
3.3 Parameter identification structure [Mod04]. . . 39
4.1 The layout of the mini-lighting network in configuration with HPMLs [NVR02]. . . 42
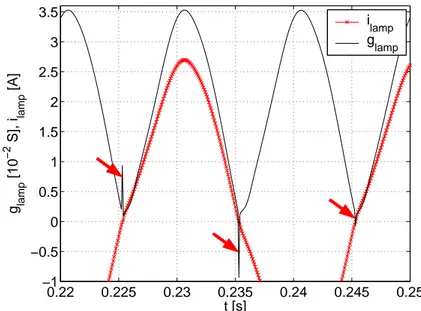
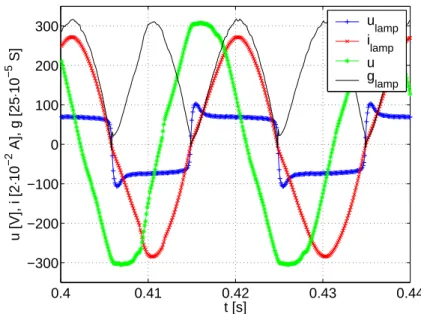
4.2 Peaks in conductivity waveforms after cutdc correction ob-tained on metal halide lamp in circuit with magnetic ballast (sec. 4.6). . . 44
4.3 Waveforms of lamp current and conductivity of metal halide lamp in circuit with magnetic ballast (sec. 4.6). Difference between waveforms of conductivity glamp calculated from
cur-rent with DC part ilamp, and conductivity glampN DC calculated
from current without DC part ilampN DC. . . 45
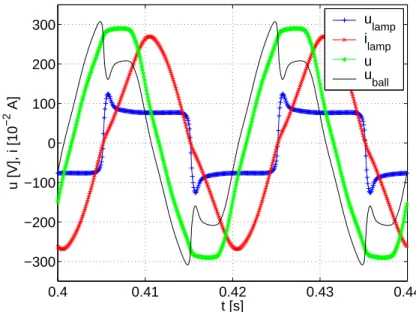
4.4 Wavefoms of voltages and current in circuit of metal halide lamp with magnetic ballast (sec. 4.6). . . 48
4.5 Phasor diagram of rms values of voltages and current first har-monics in circuit of metal halide lamp with magnetic ballast. (sec. 4.6). . . 49
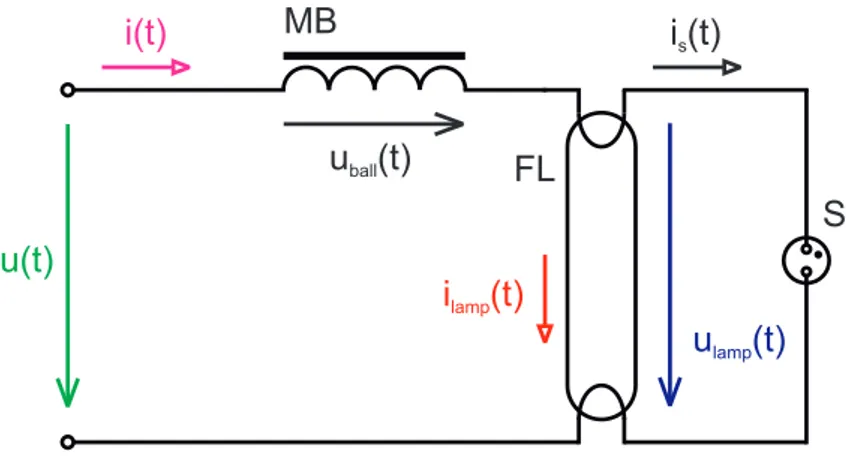
4.6 Electric circuit of fluorescent lamp powered by magnetic bal-last. MB – magnetic ballast; FL – fluorescent lamp; S – glow starter. . . 50
4.7 Measured electric characteristics of 58 W linear fluorescent lamp and waveform of computed conductivity. . . 52
4.8 Measured electric characteristics of 36 W linear fluorescent lamp and waveform of computed conductivity. . . 53
4.9 Measured electric characteristics of 18 W linear fluorescent lamp and waveform of computed conductivity. . . 54
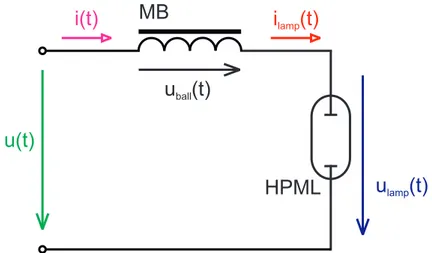
4.10 Electric circuit of HPM lamp powered by magnetic ballast. MB – magnetic ballast; HPML – high pressure mercury lamp. 55
4.11 The electric characteristics of 400 W HP mercury lamp in cir-cuit with magnetic ballast. . . 56
4.12 Electric circuit of HID lamp powered by magnetic ballast. MB – magnetic ballast; HID – high intensity discharge lamp; S – starter (ignitor). . . 57
4.13 Measured electric characteristics of 400 W HP sodium lamp and computed conductivity. . . 58
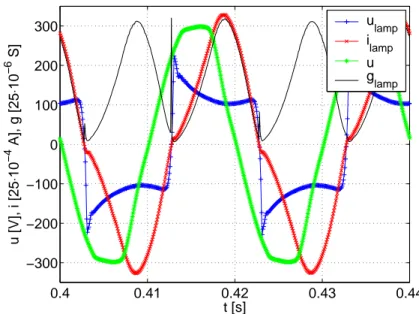
4.14 Measured voltages, current and computed conductivity of 150 W MH lamp in circuit with MB. . . 60
4.15 Electric circuit of HID lamp powered by electronic ballast. . . 60
4.16 Voltages, current and conductivity of 150 W MH lamp powered by electronic ballast. . . 61
4.17 Voltage-current characteristics of 150 W MH lamp in horizon-tal and vertical operation position. . . 62
4.18 Modification of electric circuit for frequency change of supply voltage. . . 64
List of Figures
4.19 Measured voltages, current and computed conductivity of 150 W MH lamp in circuit with resistive ballast and operation fre-quency 50 Hz. . . 65
4.20 Voltage-current characteristics for two frequencies of power supply. . . 65
4.21 Voltage-current characteristics of 150 W MHL with MB with ballast taps switching. . . 66
4.22 Characteristics of 150 W MHL supplied by triangle voltage. . . 67
5.1 Structure of experimental offline identification of a lamp model. 71
5.2 The application window of the graphical user interface for the lamp model identification. . . 74
5.3 Comparison of measured and simulated (lamp model with Best Parameters) conductivity waveforms. . . 78
5.4 Parameters of polynomial lamp model dependence on the vari-ation of the number of analyzed periods of measured signal. . 82
5.5 Parameters of polynomial lamp model dependence on the vari-ation of the number of itervari-ations. . . 83
6.1 Simulation model of an electric circuit with a lamp load. . . . 90
6.2 Universal simulation scheme of a discharge lamp. . . 91
6.3 Linear model of a magnetic ballast. . . 92
6.4 Simulation diagram of a lamp model powered from current source from Matlab workspace. . . 93
6.5 Comparison of experiment and simulation characteristics with the complete electric circuit model with 150 W metal halide lamp. . . 94
6.6 Experimental and simulated lamp voltage and conductivity of 150 W MHL with polynomial (a)–(b); quadratic (c)–(d); exponential (e)–(f) lamp model application. . . 95
6.7 Experimental and simulated lamp voltage and conductivity of 150 W MHL with polynomial model at frequency 50 Hz. . . . 96
6.8 Experimental and simulated lamp voltage and conductivity of 150 W MHL with polynomial model at frequency 100 Hz (a)– (b); 400 Hz (c)–(d); and 999 Hz (e)–(f). . . 97
6.9 Experimental and simulated lamp voltage and conductivity of 58 W fluorescent lamp with polynomial (a)–(b); quadratic (c)–(d); exponential (e)–(f) lamp model application. . . 99
6.10 Experimental and simulated lamp voltage and conductivity of 58 W fluorescent lamp with polynomial lamp model application.100
6.11 Experimental and simulated lamp voltage and conductivity of 58 W fluorescent lamp with polynomial lamp model application.101
A.1 Voltage-current characteristics for measured discharge lamps. . 115
A.2 Function of current and voltage of metal halide lamp on fre-quency of supply voltage. . . 116
A.3 Voltage-current characteristics for frequencies of supply volt-age in range 40 Hz up to 90 Hz. . . 117
A.4 Voltage-current characteristics for frequencies of supply volt-age in range 100 Hz up to 1000 Hz. . . 118
List of Tables
2.1 HID lamps wattage ranges . . . 22
2.2 Influence of voltage frequency on induction ballasts [Wha00a]. 24
4.1 Parameters of KIKUSUI AC power source PCR 2000A [Kik]. . 43
4.2 Parameters of the circuit with 58 W FL . . . 51
4.3 Parameters of the circuit with 36 W FL . . . 52
4.4 Parameters of the circuit with 18 W FL . . . 54
4.5 Parameters of the circuit with 400 W HP mercury lamp . . . . 55
4.6 Parameters of the circuit with 400 W HP sodium lamp . . . . 57
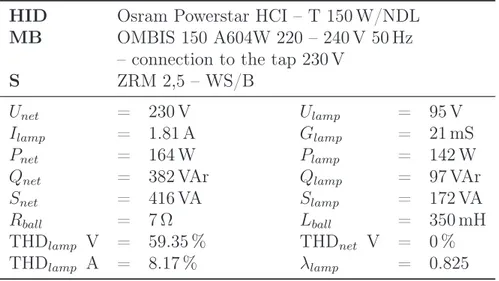
4.7 Parameters of the circuit (fig. 4.12) with 150 W MH lamp and MB . . . 59
4.8 Parameters of the circuit with 150 W MH lamp powered by EB 61
4.9 Parameters of operation position of 150 W MH lamp. . . 63
4.10 Electric parameters of MHL in circuit with MB powered by 50 Hz tiangle supply voltage. . . 67
5.1 Format of m matrix; vectors of sampled t, ulamp, ilamp, unet. . 73
5.2 Identification settings for 150 W MH lamp. . . 77
5.3 Parameters of polynomial model (5.4) with conductivity poly-nomial of third order. . . 79
5.4 Parameters of polynomial model (5.4) with conductivity poly-nomial of second order. . . 79
5.5 Parameters of polynomial model (5.4) with conductivity poly-nomial of first order. . . 79
5.6 Parameters of polynomial model (5.4) without b0. . . 79
5.7 Parameters of polynomial model (5.4) with b0. . . 80
5.8 Parameters of quadratic model (5.6) with conductivity poly-nomial of second order. . . 80
5.9 Parameters of quadratic model (5.6) with conductivity poly-nomial of second order with a1 parameter. . . 81
5.11 Identification settings for models of fluorescent lamps. . . 83
5.12 Parameters of quadratic model (5.6) of fluorescent lamps. . . . 83
5.13 Confrontation of parameters of polynomial models applied to 58 W fluorescent lamps. . . 84
5.14 Identification settings for models of high pressure lamps. . . . 85
5.15 Parameters of polynomial model (5.4) with conductivity poly-nome of second order. . . 85
5.16 Comparison of lamp model coefficients (5.17) for different iden-tification approaches. . . 88
6.1 Settings of simulations with three types of lamp models of 150 W metal halide lamp. . . 94
6.2 Settings of simulations with three types of lamp models of 58 W fluorescent lamp. . . 98
6.3 Settings of simulation with polynomial type of lamp model of 400 W HPML. . . 100
6.4 Settings of simulation with polynomial type of lamp model of 400 W HPSL. . . 101
A.1 Used functions of Power Electronics Matlab Toolbox of KEL TUL. . . 113
A.2 Parameters of EMU-2 measurement device [Nov03]. . . 114
A.3 Parameters for different voltage frequencies of 40–60 Hz for MHL. . . 119
A.4 Parameters for different voltage frequencies of 70–90 Hz for MHL. . . 120
A.5 Parameters for different voltage frequencies of 100–300 Hz for MHL. . . 121
A.6 Parameters for different voltage frequencies of 400–600 Hz for MHL. . . 122
A.7 Parameters for different voltage frequencies of 700–900 Hz for MHL. . . 123
A.8 Parameters for voltage frequency of 1 kHz for MHL. . . 124
List of Symbols
Term Unit Definition
a1−6 Lamp model parameters eq. (3.21), (3.24),
(3.25), (3.26)
a2 J−1 Lamp model parameter eq. (1.1)
A s5A2m−4kg−2 Lamp model parameter eq. (3.14)
A Lamp model parameter eq. (3.3)
A1−4 Lamp model parameters eq. (3.10)
Ap(Plamp) Lamp model power function eq. (3.2)
A, B, C, D Lamp model parameters eq. (3.21)
b1 Hz Thermal losses and the number of elastic
col-lisions eq. (3.33)
b2 V2A−2s−1 Radiation losses eq. (3.33)
bk Lamp model constant eq. (1.1)
B Lamp model parameter eq. (3.3)
B s−1 Lamp model parameter eq. (3.14)
B1−4 Lamp model parameters eq. (3.10)
Bp(Plamp) Lamp model power function eq. (3.2)
C F Capacitance
C Lamp model parameter eq. (3.14)
C1−4 Lamp model parameters eq. (3.11)
d m Distance between electrodes
D Lamp model parameter eq. (3.11)
D Lamp model parameter eq. (3.14)
e C Electron charge
E Vm−1 Scalar of electric field intensity
E Vm−1 Vector of electric field intensity
f Hz Frequency
F kgA−2s−3m−1 Lamp model parameter eq. (3.8)
Term Unit Definition
g S Oscillogram (vector) of measured lamp
con-ductivity
gM S Oscillogram (vector) of simulated lamp
con-ductivity
gs Sm Electric conductivity eq. (3.29)
G S Electric conductivity
Gk Sk kth power of electric conductivity
h m Distance
h Js Planck’s constant
i A Instantaneous value of electric current
ilamp A Instantaneous value of lamp current
ilamp A Oscillogram (vector) of lamp current
ilampN DC A Instantaneous value of lamp electric current
without DC value
I A Electric current
I A Complex current
¯
I(t) A Time-varying phasor of current
In A nth harmonic of current
Ilamp A Phasor of lamp current
Irms A RMS value of current
j Am−2 Vector of electric current density
je Am−2 Vector of electron current density
ji Am−2 Vector of ion current density
J(x) Criterion
k Lamp model parameter eq. (3.4)
k Mathematical parameter
k JK−1 Boltzmann’s constant
K1,2,3 Lamp model parameters eq. (3.7)
L H Inductance
L m Length of discharge channel eq. (3.32)
ne m−3 Electron density
p Pa Pressure
P W Real power
pAr Pa Pressure of argon gas
Pball W Ballast real power
Pcon W Thermal conduction loss
Pdef W Deformation power
Pin W Input power
List of Symbols
Term Unit Definition
Prad W Radiation loss
qu Criterion number
Q VAr Reactive power
Qball VAr Ballast reactive power
Q1 VAr Reactive power of the first harmonic
r m Radius of tube of discharge lamp
R Ω Resistance
R Ω Discharge resistance
Rdif f Ω Differential resistance
Req Ω Lamp model equivalent resistance eq. (3.7)
Rs Ω Lamp model parameter eq. (3.7)
S m2 Cross-section
S VA Complex power
Sball VA Ballast complex power
t s Time
T K Temperature
T s Period of harmonic and inharmonic signal
T0 K Temperature of arc tube wall eq. (3.25)
Tc K Temperature of hot zone
TCS K Cold-spot temperature
Te K Electron temperature
Tg K Gas (heavy particle) temperature
THD A % Total harmonic distortion in current THD V % Total harmonic distortion in voltage
Tp K Temperature around hot zone
uball V Instantaneous value of ballast voltage
ulamp V Instantaneous value of lamp voltage
ulamp V Oscillogram (vector) of lamp voltage
U V Voltage
U V Complex voltage
Ulamp V Phasor of lamp voltage
¯
U(t) V Time-varying phasor of voltage
Uef V RMS value of voltage
Ul V Voltage drop
Un V nth harmonic of voltage
Unet V Mains voltage
Urms V RMS value of voltage
Us V Lamp model parameter eq. (3.7)
Term Unit Definition
Vele V Electrode voltage drop
Wcon J Heat conduction dissipation
Wele J Input electric power
Wdif J Diffusion of particles from discharge
Wh eV Energy of higher energetic state
Wl eV Energy of lower energetic state
Wrad J Radiation dissipation
Wsheath J Dissipations at electrodes
x Mathematical function of a lamp model
x Vector of parameters
¯
x Mean Value
y S Mathematical function of a lamp model eq.
(3.10)
y(t) Output signal of a real system
yM(t) Output signal of a model system
Z Ω Complex impedance
α s2m−5kg−1 Lamp model parameter eq. (3.8)
β s−1 Lamp model parameter eq. (3.8)
∆Uelectrodes V Voltage drop on electrodes
∆W eV Energy difference
∆y Difference of output signals
η lm W−1 Luminous efficacy
λ nm Wavelength
λ Virtual power factor
µe A s2kg−1 Electron mobility
ν s−1 Frequency of electromagnetic radiation
π Ludolph’s number
%e Ωm Electric resistance
σ Standard deviation
σ Sm−1 Electric conductance of a discharge eq. (3.32)
σe Sm−1 Electric conductance of a discharge eq. (2.4)
σe S Electric conductance of a discharge eq. (3.9)
σe S Electric conductivity of a discharge eq. (3.17)
σe Sm−2 Electric conductance of a discharge eq. (3.26)
ξ Mathematical parameter eq. (3.30)
ψion s−1 Ionization function eq. (3.18)
ψdif s−1 Diffusion function eq. (3.19)
List of Acronyms
Institutions
COST European Cooperation in the field of Scientific and Technical Research
CPAT Centre de Physique des Plasmas et de leurs Applications de Toulouse
DIEECS Departamento de Ingeniería Eléctrica, Electrónica, de Com-putadores y Sistemas
ESAT Departement Elektrotechniek
ELECTA Elektrische energie & computerarchitecturen FM Fakulta mechatroniky (Faculty of Mechatronics) KAM Katedra měření (Department of Measurement)
KEL Katedra elektrotechniky (Department of Electrical Engineer-ing)
KU Katholieke Universiteit STSM Short Term Scientific Mission
TUL Technická univerzita v Liberci (Technical University of Liberec)
UPS Université Paul Sabatier
AC Alternate Current
Ar Argon
AVG Average Value
CAD Computer Aided Design CFL Compact Fluorescent Lamp CMH Ceramic Metal Halide Lamp CRI Colour Rendering Index
CCT Corelated Colour Temperature
EB Electronic Ballast
EMU-2 Ethernet Multifunction Unit
HF High Frequency
Hg Mercury
HID High Intesity Discharge lamp
HMI Hydrargyrum Medium-arc Iodide (mercury-halogen lamp)
Ho Holmium
HPL High Pressure Lamp
HPML High Pressure Mercury Lamp HPSL High Pressure Sodium Lamp
FL Fluorescent Lamp
In Indium
IR Infra Red light
Kr Krypton
LED Light Emitting Diode LPSL Low Pressure Sodium Lamp
LS Least Squares
MB Magnetic Ballast
MHL Metal Halide Lamp MLN Mini-lighting Network
Na Sodium
Ne Neon
OLED Organic Light Emitting Diode
PC Positive Column
PCA Polycrystalline Alumina QR Eigenvalue algorithm
RMS Root Mean Square
Sc Scandium
SI The International System of Units
SOX Sodium OXide Lamp
T8 Tubular fluorescent lamp with ∅26 mm THD Total Harmonic Distortion
Tl Thallium
TL Tubular Lamp
TLS Total Least Squares UV Ultraviolet light V-I Voltage-current
Introduction to the COST Action
no. 529 “Efficient Lighting for the
21
st
century”
European Cooperation in the field of Scientific and Technical Research is the intergovernmental framework for coordination of nationally funded research on a European level.
It is based on Actions, which cover basic and pre-competitive research as well as activities of public utility. COST has 35 member countries and enables scientists to collaborate in a wide range of scientific and technological domains (e.g. Chemistry, Physics, Forestry, Materials . . . ).
Funding COST is basically used to cover coordination costs such as con-tributions to workshops/conferences, travel costs for meetings, concon-tributions to publications and Short term scientific missions of researchers to visit other laboratories [COSa].
Our COST Action 529 “Efficient Lighting for the 21st century” was
con-cerned with the light source science and technology.
The main objective of the Action at both the basic breakthrough and the pre-competitive research levels, was to seek new concepts and materials for the lighting industry which avoid any known environmentally harmful substances through the study of the feasibility of high efficacy, novel light source technologies.
Other objective was building up a database of existing knowledge in given field, compiling and transferring the existing information such as experimen-tal results and numerical simulation codes – generally the fundamenexperimen-tal data necessary for forthcoming specific and more focused studies.
This Action enabled the creation of an interdisciplinary expert panel which acts as a consulting body for the industry as well as between specialists from different fields. This concept seems to be valuable especially when one considers the fact that the nature of total light systems (of which the lamp is only one of many elements) is in itself highly interdisciplinary. It includes
knowledge from several major domains such as electrical engineering, plasma physics and chemistry, chemistry and materials science [COSb, Kop05b].
Department of electrical engineering could, thanks to this Action, collab-orate with plasma physicists from CPAT at University of Paul Sabatier in Toulouse, France; electrical engineers from DIEECS at University of Oviedo, Spain, and from ESAT/ELECTA at KU Lueven, Belgium.
In the frame of this action were realized number of STSMs, workgroup meetings or workshops, where were presented results of our laboratory and personally consulted with partners. We participated on the international 10th
Chapter 1
Preface
It might be said that the life without the artificial light is nowadays hardly imaginable. It is now a long time since we stayed in dark and waited for the sunlight to come. The artificial light has become practically omnipresent all across the developed world. It is mainly the product of the electric en-ergy which is transformed into the light by various electrical light sources. Approximately 25 % of the worldwide electricity production is consumed by these light sources [LLLG04]. There are numerous types of electric light sources and they could be classified e.g. according to the way of the light emission [Hab95, Miš79, Zis05]:
• In solid states
– incandescent
∗ vacuum light bulbs,
∗ light bulbs filled by gas – conventional, and halogen;
– luminescence
∗ light-emitting diodes,
∗ organic light-emitting diodes.
• In gases and in metal vapours
– arc discharge
∗ low pressure – fluorescent, sodium, sulphur lamps etc.,
∗ high pressure – mercury, sodium, metal halide lamps, xenon lamps etc.
– glow discharge
It has been estimated that 80 % of electric light sources which are used for indoor commercial, industrial, institutional, and retail applications, is fluorescent. The discharge lamps significantly prevail compared to the other types, mainly due to their efficiency of electrical energy conversion into light [Way71].
Discharge lamps are based on plasma emitting light in visible or invisible luminous spectrum. The principle is very complex and due to it can exist many types of arc discharge tubes. These light sources do not work directly from the mains electricity as the light bulbs do, but rather over special circuits called ballasts. They are required for the lamp starting, arc-current limiting in the steady-state operation and relighting each half cycle (for alternate current operation). The ballast must provide these functions with minimum consumption of electric power, no adverse effect on lamp life and with no negative influence to the mains supply.
To solve such problem is the multidisciplinary task. The luminary system lamp-ballast is the product of many scientific/technical disciplines: plasma physics, chemistry, materials, optics, electrical engineering, electronics . . . etc. [COSb, WWRN03].
The electrical point of view is the main interest of this work. The problem confines then to the field of electrical engineering especially to the electric cir-cuit design, where the most interesting characteristic for the ballast designer is lamp terminal characteristic as an electrical load. This highly nonlinear part of the circuit should be described by the simplified model usable in various CAD systems.
1.1
State of the art
Specialists who focus on discharge lamps is aware of the fact that there is the strong tie between the source and the lamps characteristics, the former having the influence on the parameters of the latter, such as color temperature, operating power or luminous flux. However, there are hardly any analytic models linking the lamps characteristics with their electrical properties.
Numerical simulations must therefor take into account a number of cou-pled phenomenon: fluid motion and convection, heat dissipation, chemical reactions, electric and magnetic field computation . . . etc. Fundamental data like the species cross section (e.g. [LC04]) or the chemical reactions occur-ring at this range of temperatures and pressures are not well known and are subject of the discussion among specialists.
1.1. State of the art
lamps and discussed the modelling of gas discharge. Schematically, this topic can be subdivided into two main branches:
• models based on the plasma equations,
• semiphysical or black box models.
The first one is about solving numerically the plasma equations. So far, numerous groups are working on various aspects of the discharge lamp sim-ulations, like the influence of the electrode on the discharge column [BD04, ABN00, Ben00, Ben01], or the plasma properties inside the lamp [Lis92]. This approach is based upon Finite Elements discretization and delivers re-sults as local variables like ions and electrons densities, temperatures, veloc-ities, etc.
Due to its complexity and computational heftiness, such approach is not suitable for simpler tasks like electric circuits modelling, ballast design, in-fluence of discharge lamps (electric load) evaluation, etc. In this case, semi-physical or black box models are applied, with parameters identified from real lamp data. This approach is said global, as the result is directly expressed in terms of the global electrical properties like voltage and current.
Those models are useful in specialised environments, like e.g. SPICE or Matlab [ZD02]. They are mainly based upon approximation of:
1. non-linear voltage-current characteristics,
2. equivalent conductivity/resistance.
The first approach makes use of a fixed negative resistance describing the negative slope of the voltage-current curve [BYSG02, BYSL02, CFS+01,
VLH+98, NG01]. Such approach is better suited for high frequency
oper-ating mode, as the lamp starts behaving as a linear, constant load. But at mains frequencies, the time scale permits a significant variation of the plasma properties, leading thus to a time-varying formulation as a function of various easily measurable lamp parameters.
For low pressure fluorescent lamps, such conductance variation can read-ily be obtained from the Francis equation [Fra48] complemented by vari-ous relationships between electrons density, temperature, mobility and dis-charge parameters like current, gas properties, thermal emissivity, . . . etc. [LMT+04, LSTD05, MT04c, MT04a, MT04b]. This leads to analytical and
Herrick [Her80] extrapolated the Francis model to HID1 discharges,
ap-plied on data obtained from Hg and Na lamps. Based upon a black box approach, he expressed a Taylor developement of the time derivative of the conductance as a polynomial of the lamp current and conductance.
Other authors [SBY99, ABF+02b, ABF+02a, ABV+04, Sta84, TPP+04]
followed the same path with various adjustments to the basic structure. The model used for our study specified below by (1.1) belongs to this family, and it can be recognised that some function of the conductivity was approximated by a polynomial in the conductivity.
1.2
Aims of the thesis
The aim of the work is to describe discharge lamp (different types) as an elec-tric load for the elecelec-tric circuits simulation. Such model can be used in light net model to observe the behavior and influence onto mains electricity supply and for design of new electronic ballasts.
The lamp will be described by the G-model based on the electric conduc-tivity G(t) of the plasma proposed by Zissis et al. [ZD02]:
dG dt = a2i 2+ N X k=1 bkGk, (1.1)
and other lamp models based on description of equivalent conductivity eg. from works [ABF+02b, ABF+02a].
The optimal structure of lamp models with its parameters will be deter-mined. Such model will be used as the block in Matlab Simulink and verified against experimental results.
1.3
Outline of the thesis
The theory of the electric discharge is briefly explained in the first part of the thesis and the light production principles of different types of discharge lamps are introduced. The summary of widely used discharge lamps is given. Then the presentation of a necessary electric circuit for their operation –
ballast follows.
1High Intensity Discharge or high pressure discharge lamps contain compact arc tubes,
which enclose various gases and metal salts. They operate at relatively high pressures and temperatures. HID is a general term for mercury, metal halide, high pressure sodium lamps and less common, xenon short-arc lamps (more in sec. 2.4).
1.3. Outline of the thesis
Second part deals with mathematical modelling of discharge lamps for lighting. It focuses on electrical description modelling of discharge lamps, on their simulation in electric circuits especially. The calculation and modifica-tion of G-model is noted.
The part with the presentation of experiments deals with measurements on different discharge lamps and their circuits. This step represents the data acquisition (oscillograms of lamp voltage and current ulamp(t), ilamp(t)) for
model verification.
The next chapter describes the process of lamp model identification which is followed by simulation part where the applications of models in the lumi-nary system models are shown.
In the conclusion, the advantages and disadvantages of used methods are discussed and perspectives of electrical modelling approaches are summa-rized.
Chapter 2
Electric discharge lamps
Electric discharge lamps are the most important electric light sources. They are used in virtually all areas of modern lighting technology. They could be found in households as well as in the offices (fluorescent lamps, compact fluorescent lamps), in industry (high intensity discharge lamps), public light-ing (high pressure mercury, sodium lamps, metal halide lamps, low pressure sodium lamps), monument lighting (HIDLs), in medicine (germicidal lamps), automotive headlights (HIDLs), for commercial (neon lamps, HIDLs), for projection (special HID lamps – xenon and HMI), and many more. Their short list with the family of electric light sources is mentioned above.
Discharge lamps, as the artificial sources of visible1 white light, are
pro-duced in wide rage of powers with different levels of luminous efficacy2 η.
According to figure 2.1 it is evident that incandescent lamps (light bulbs) have low efficacy while all discharge lamps have much higher efficacy than the former schematically sketched the evolution in lamp efficiency of dis-charge lamps against incandescent lamp over the years. From figure 2.1 is evident low efficacy of incandescent lamps (light bulbs) and much more higher efficacy of all discharge lamps (e.g. low pressure sodium lamp is up to now the most efficient artificial light source).
Unfortunately the quality characteristics of light sources can not be based on luminous efficacy only. There are other requirements on lamps, which are more or less important, depending on the application. Nevertheless it is possible to summarize how the ”good lamp” should look like [Zis05]:
1. have a high efficiency;
1Visible light has wavelength λ in range 380 to 780 nm.
2The luminous efficacy is defined as the luminous flux related to the electrical power
40 80 120 160 200 luminous efficacy (lm/W) 1880 1900 1920 1940 1960 1980 2000 year major breakthrough high-pressure sodium metal halides low-pressure sodium high pressure mercury low-pressure mercury Incandescent
Figure 2.1: Evolution of luminous efficacy of discharge lamps compared to the incandescent lamp [Gen].
2. have a high CRI3;
3. have a long life;
4. produce a stable light level during its lifetime;
5. avoid flickering;
6. produce its nominal flux instantaneously when turned on;
7. be exchangeable with other types of lamps;
8. be compact and light;
9. avoid harmonic distortion feedback effect to the electric network;
10. avoid environmental harmful materials;
3The general Colour Rendering Index is one of the main characteristic of a light source.
It is a measure of how well the light source reproduce the colours of any object in com-parison to a standard illuminant. The scale is from 0 (monochromatic) to 100 (white).
2.1. Physics of discharge lamps 11. avoid electromagnetic interference with any other electronic equipment;
12. avoid excessive heat and UV4 rejection;
13. be recyclable;
14. be inexpensive.
As an example could be taken a LPS lamp against incandescent lamp. Although LPSL win on the field of luminous efficacy with its 200 against 20 lm/W, completely lose with CRI almost 0 to 100.
2.1
Physics of discharge lamps
All electric discharge lamps convert electrical energy into the light by trans-forming electrical energy into the kinetic energy of moving electrons, which in turn is converted into electromagnetical radiation as a result of some kind of collision process with atoms of gas (vapours) or their mixture.
Some moving electrons make such energetic impacts on atoms that the atoms internal state changes (inelastic collisions). These changes can be of two types : excitations or ionizations.
The excitation collisions excited the atomic electrons from the lower en-ergetic state to a higher enen-ergetic state. This transient state may takes some time ranging from few picoseconds to few seconds in the case of forbidden
transitions, usually it takes around 1 nanosecond. The excited atomic
elec-tron then loses the energy by dropping into the lower energy state. The quantum of energy is emitted as an electromagnetic radiation of a frequency
ν. Equation 2.1 shows that the product hν is proportional to the energetical
difference between higher and lower energetical states:
∆W = Wh − Wl = hν, (2.1)
where h is Planck’s constant.
Each atom allows specific transitions between energetic states, the specific frequency ν of emitted electromagnetic radiation. Therefore the radiation spectrum is formed as the separated spectral lines of atoms.
The ionization collisions generate pairs of electron-ions. This intimate mixture of positive ions and negative electrons is called a plasma. The motion of charged particles in plasma between electrodes positive anode (+) and negative cathode (−)5, is oriented for electrons from cathode to anode and
4Ultraviolet light has wavelength λ in the range 100 to 380 nm.
for positive ions from anode to cathode (c.f. figure 2.2). The electrons move randomly at high speed and the electron cloud drifts in the electric field6.
The electric current is than given by the sum of the current of both particles and its orientation is the same as the motion of positive ions. The electrons
Negative ions
Electrons
Positive ions Heat
Elastic collisions Quick atoms Recombination Excitation Radiation i(t) Anode Cathode Ionization Ionization Excitation Electrons
Figure 2.2: Interaction between plasma and electrodes [Gro67].
are much more mobile than the ions which can be regarded as stationary. So the ions flow is only the small fraction of whole current approximately 0.1 to 1 %.
The type of the electromagnetic radiation of the plasma depends on atoms (filling of a discharge tube) which are possible to be excited by electrons.
2.1.1
Power balance in a discharge
The total input electric power Wele in all gas discharge lamps dissipates
spe-cially through radiation7 W
rad, thermal conduction Wcon, acceleration of ions
in the sheaths at the walls and electrodes Wsheath, and diffusion of particles
from the discharge Wdif, i.e.,
Wele= Wrad+ Wcon+ Wdif + Wsheath. (2.2)
6Imagine of swarm of bees drifting along in gentle breeze is not far from the true
[Wha00a].
2.1. Physics of discharge lamps
2.1.2
Starting and steady states of a discharge
At first, there must be few electrons at the cathode for a discharge to incept. Two approaches of electrons emission are used in discharge lamps.
• thermionic emission;
• high-field emission.
Two types of cathodes can be defined then. A hot cathode that uses thermionic emission and it is typical for arc discharges. A cold cathode operates with high-field emission (autoemission), which is specific for glow discharges.
Free electrons accelerated by electric field gains enough energy for new electrons production during inelastic collisions (ionization) with atoms.
An important factor for a discharge is starting voltage (breakdown
volt-age). It depends on the gas and discharge tube composition, the gas pressure,
electrode’s materials and their distance, and applied electric field. The effi-ciency of ion and electron production is reduced by increasing of the pressure
p either electrodes distance d.
The electric discharge is now in steady-state mode of operation. Its form can be changed by the couple of voltage and current. In figure 2.3 a voltage-current characteristics of self-sustained discharges8 is sketched. Note that
10-12 10-10 10-8 10-6 10-4 104 1 10 10-2 102 10-14 102 103 104 105 1 U[V] I[A] Arc Corona discharge Abnormal Normal glow discharge Townsend discharge Dark discharge
Figure 2.3: The general voltage-current characteristics for self-sustained dis-charges with schematic current regions, redrawn from reference [Gro67].
ranges of currents and voltages are merely illustrative and depends on many factors. In the characteristics are three main regions divided by currents into
• dark discharge;
• glow discharge;
• arc discharge.
The dark discharge includes Townsend and Corona discharges which are given by low currents up to 10−4A and high voltages over kilovolts. They do
not come out by significant luminance.
The glow discharge (normal and abnormal) mode owes its name to the fact that the plasma is luminous. The gas glows because the electron energy and number density are high enough to generate visible light by excitation collisions. The glow discharge is characterized by currents from 10−4 to
10−1A.
If the current increases, the electrodes become sufficiently hot that the cathode emits electrons thermionically and with a constant-voltage power supply the discharge will undergo a glow-to-arc transition. The arc discharge is represented by higher currents over 10−1A in a plasma (cf. figure 2.3).
2.1.3
Electric characteristics of discharges
The electric current density j is induced by the electric field. It is given by the flow of electrons je and ions ji. Since it was already mentioned above on
page 12 that ion flow is considerably small and can be therefore neglected in the sum of the whole flow, it is possible to write
j = je+ ji ' je. (2.3)
The relation between E and j is defined partially by Ohm’s Law
j = σeE, (2.4)
where σe is the electrical conductance of the plasma. It may be represented
by a scalar value, because lighting discharges are generally nonmagnetic. The electrical conductance is defined as
σe= neeµe, (2.5)
where neis the electron density, e is the electron charge and µeis the electron
2.1. Physics of discharge lamps
The electron density ne in plasma strongly depends on input power. The
electrical conductance σeis not constant, but it changes. This is the difference
between plasma and wire conductors, where is the ne fixed. The electric
field increases the current increases, the number of electrons increases (also conductance) the resistance %e decreases, because
σe=
1
%e
. (2.6)
However, if %eis further decreased with a constant voltage source, the current
will increase without bound until something melts or the fuse blows. This is the result of the negative part of the voltage-current characteristic of a plasma (see in figure 2.4). For the discharge stabilisation is necessary to control (limit) the current. An extra circuit element is included in series to the discharge – this is called ballast (control gear ) (more in section 2.5).
0 50 100 150 0 0.5 1 1.5 2 2.5 3 u lamp [V] i lamp [A] ← R diff = dU/dI < 0
Figure 2.4: Part of the dynamic voltage-current characteristic of HID lamp powered by 50 Hz voltage with magnetic ballast. The part with negative differential resistance (Rdif f < 0) is red lined. Two arrows show the
2.2
Specification of discharge lamps
Such a complex phenomena like a discharge can be classified from different points of view and so can be classified also discharge lamps:
• physical (e.g. pressure, temperature);
• chemical (e.g. filling);
• electrical (e.g. current, frequency, power) . . . etc.
Let us mention some certain examples. The specification by current ranges is often used. It was already remarked above (page 14 and fig. 2.3).
The classification into two groups based on pressure is most widely used for discharge lamps:
• low pressure;
• high pressure.
The energy transformation in excitation, ionization, dissociation of gas atoms and molecules, and heat of a plasma, are different in these two groups of discharge lamps. In figure 2.5 is relation of electron (Te) and heavy particle
(Tg) temperature in a plasma on pressure9 p. The different temperature of Te
and Tg is typical for low pressure discharge lamps. When is the pressure high
over approximately 104Pa the particle temperature is in equilibrium what is
typical for high pressure discharge lamps.
Another characterization is by the frequency into low frequency (∼ Hz) and high frequency discharges (∼ kHz and higher). The influence of the higher frequency comes out in higher efficiency, because the recombination of electrons and ions is reduced. With high frequencies (∼ MHz) is possible to make an electrodeless discharge [Gro67, Wha00a].
The light colour as well as some other properties is given by the filling of the tube. There are lamps filled by sodium, mercury, sulphur . . . etc.
2.3
Low pressure discharge lamps
Low pressure discharge lamps are generally characterized by current densities
∼ 10−2A cm−2 and pressures 10−1 to 102Pa. They have different
tempera-tures of plasma particles, wich arises from figure 2.5.
2.3. Low pressure discharge lamps 101 104 103 102 102 103 104 105 106 100 T [K] Tg p [1.33 Pa] Te
Figure 2.5: Pressure dependance of gas temperature Tg and electron
temper-ature Te in electric discharge [Miš79].
LP lamps use luminescence of gas filling and after of solids on a tube wall – low pressure mercury lamps or luminescence of gas filling directly – low
pressure sodium lamps [Miš79].
The following text is focused on low pressure mercury vapour discharge lamps (fluorescent lamps), because measurements were taken on them. That is why LP sodium lamps are not discussed.
2.3.1
Fluorescent lamps
There are variety of FLs in the market. They are produced in wide range of powers (6 up to 80 W), shapes, dimensions, colours . . . etc. FLs can be divided into five groups [PHIa]:
• tubular;
• bent;
• integrated;
• non-integrated;
aaaaaaaaaaaaaaaaaaaaaaaaaaaaaaaaaaaaaaaaaaaaaaaaaaaaaaaaaa aaaaaaaaaaaaaaaaaaaaaaaaaaaaaaaaaaaaaaaaaaaaaaaaaaaaaaaaaa U [V] Anode sheath 0.3 mm ~ Anode fall ~ 5 V Cathode fall ~10-15 V d [m] Anode Negative glow Cathode Faraday dark space Positive column Cathode sheath 10 ?m Fluorescent powder any length Pins Coiled-coil filament Tube
Mixture of a nobel gas and mercury vapours
UV radiation Visible radiation
Figure 2.6: Structure of a LP rare-gas discharge lamp in DC mode [Wha00a, Way71].
Widely used are tubular (linear) FLs. Their construction is described in figure 2.6. The discharge tube has two electrodes (coiled-coil filaments) sealed into the ends and is filled by a noble gas (Ar, Kr, Ne or their combi-nation) at the pressure ∼ 1 torr and rare mercury vapours at 10−3torr. Work
temperature of a gas mixture is 300–700 K and electrons c. 12000 K. About 60–80 % of input electric energy change into UV radiation (two spectral lines 185 nm and 253.7 nm) due to mercury atoms. This invisible light is then transformed with some losses into visible spectrum in the mixture of fluo-rescent powder coating on the tube wall. The fluofluo-rescent mixture properties have great impact on CRI (over 80) and colour temperature CCT of the light source. The efficiency of transformation from the electric energy to visible light is 20–30 % [Miš79, Ric01].
The discharge regions of the lamp and voltage characteristic for a DC mode10are sketched in figure 2.6. This figure is for a better understanding of
physical processes inside the tube. Electrons are accelerated from the cathode through the cathode fall to the negative glow region. This is compensated by a region of low ionization Faraday dark space. The following space with
2.4. High pressure discharge lamps
the constant electric field is the positive column11. The anode fall is space
charge region which ensures that the correct number of electrons fall on the anode to satisfy the requirements of current continuity.
These lamps are produced in a wide range of diameters ∅ 38, 26, 16, 7 mm or T12, T8, T5, T212; different lengths 136–1500 mm; and powers 4–
65 W [Hab95, OSR, PHIb].
Bent FLs look like tubular, but they are shaped in space into U or O
(more in [Miš79]).
Integrated and a non-integrated lamps try to substitute classical
incan-descent lamps. The difference between them is in ballast placing inside or outside of the case. These lamps are more compact than tubular FLs. They can have a number of one or several times bent tubes.
Named FLs can be connected to the power net by two common types of ballasts, by a high frequency13 electronic ballast or by an electromagnetic
ballast with starter (see in sec. 2.5).
Electrodeless fluorescent lamps are based on the induction principle, where
the discharge represents single turn secondary around the primary coil of a transformer. The working frequency varies with lamp design, but popular examples use 13.6 MHz, 2.65 MHz and 250 kHz [Hab95, Wha00a, PHIa].
2.4
High pressure discharge lamps
High pressure or high intensity discharge lamps are characterized in general by compact gas discharges (1–100 mm), current densities ∼ 1 A cm−2 and
pressures 104–106Pa. The temperature of plasma particles is T
e = Tg =
1000 K up to 8000 K (see in figure 2.5) [Way91].
There are three general types of HID lamp distinguished by their plasma forming species:
• high pressure mercury lamp;
• high pressure sodium lamp;
• metal halide lamp.
11PC is the major source of UV radiation in FL.
12Philips marking: T – tubular and 12. . . 2 multiplied by 1/8 inch is the tube diameter,
e.g. T12 → 12 · 1/8 inch = ∅ 38 mm.
Outer bulb Arc tube Lamp base Tungsten electrodes Support frame and lead-in Vacuum or gas fill Plasma forming gas Arc tube to metal seal Getter
Figure 2.7: The general construction of a high pressure discharge lamp.
Typical high pressure discharge lamp (fig. 2.7) is assembled from inner
discharge tube (arc tube). An arc tube can have different shapes (cylinder
or sphere) and can be made of different materials (glass or ceramic). The arc tube with electrodes contains plasma forming gas and is fixed by support
frame and hermetically sealed in outer bulb. The outer bulb protects the
in-ner tube and inin-ner tube seals from oxidation, stabilizes the work conditions around the arc tube, absorbs emitted UV radiation and can be covered by fluorescent powder for the same reason as in fluorescent lamps. On the frame inside the outer bulb can be mounted a getter [BC04] which absorbs impu-rities (oxides, water vapour etc.) remained after the fabrication processes.
A sketch of an arc tube with two main electrodes and one starting electrode inside is in figure 2.8. These electrodes are sealed into the arc tube.
The electrical potential between main electrodes drawn below the arc tube represents voltage drops regions – cathode fall voltage, anode fall voltage and the voltage drop across the plasma column [Ruf05, Fle06]. This characteristic describes a DC operate mode, which changes every half cycle in an AC mode.
2.4.1
High pressure mercury lamp
High pressure mercury lamp is the prototype of the family of HID lamps. The plasma forming gas is mercury vapour and a small admixture of a noble gas (Ar) in the arc tube made of transparent fused silica (known as quartz, see example in figure 2.8). This mixture produce under pressure 105–106Pa
2.4. High pressure discharge lamps U [V] d [m] Anode Cathode Cathode fall Anode fall Starting
Electrode Arc tube
Main electrodes Plasma length Arc tube to metal seal
Figure 2.8: An arc tube of a high pressure discharge lamp with the charac-teristics of the electric potential in the plasma.
405, 436, 546, 577, and 579 nm with temperature typically 6000 K. Beside two main electrodes is sealed in the quartz one start electrode connected over 40 to 70 kΩ resistor to the lead-in. Outer bulb is filled by the mixture of Ar and N under pressure 4.5 to 5.2 105Pa; on the wall can be a phosphor
for UV light conversion to visible spectrum.
In the case of 400 W lamp the input energy dissipates as follows: 12% loss on the electrodes; 38% loss as heat conduction plus wall absorption; and 40% is radiated by the arc. Only 16% of this radiation is visible. The lamp luminous efficacy is maximally 60 lm/W [Hab95, Miš79, Way91, LLLG04].
2.4.2
High pressure sodium lamp
In high pressure sodium lamps is the arc tube made of ceramic – translucent polycrystalline alumina because the plasma forming material sodium is in a liquid or vaporized form very aggressive and quartz would be destroyed very quickly. In the arc tube are two electrodes only (no start electrode). It is filled by amalgam of sodium metal and a noble gas (Xe or Ar) under pressure 3 to 6.5 104Pa. The visible light spectrum is more continuous than by HPML. It is
very strong around 600 nm. Typical temperatures of the plasma column are 3300 to 4000 K. In the outer bulb is typically high vacuum. The construction can be similar to figure 2.7 single ended or double ended to special sockets.
In the case of 400 W lamp the input energy dissipates as follows: 6% loss at the electrodes; 38% loss as heat conduction plus wall absorption; and 56% is radiated by the arc in IR and visible light spectrum. 31 % of this radiation is visible. The lamp luminous efficacy can be up to 150 lm/W [Hab95, LLLG04].
2.4.3
Metal halide lamp
High pressure metal halide lamps are similar to HPML in the principle of the plasma forming gas is mercury vapours. However, in MH lamps are to the Hg vapours added other one or more metal halides (iodides of Na/Sc/In/Tl/Ho . . . etc.). These metals have improving impact to the light emission and of course efficacy, because they have very strong resonance lines in the visible part of the spectrum. The arc tube can be the same as by HPML quartz14
or as by HPSL PCA15. The utilization of ceramic material PCA is a modern
trend for MH lamps. Such lamps are called ceramic metal halide lamps. This material allows higher pressures and temperature operation (quartz 1200 K, PCA 1500 K) of metal vapours which leads to efficacy and colour improve-ments. The temperature of the plasma column reaches 4000 to 6000 K.
In the case of 400 W MH lamp, presented by Lister [LLLG04], the input energy dissipates as follows: 12% loss at the electrodes; 25% loss as heat conduction plus wall absorption; and 57% is radiated by the arc in IR and visible spectrum. A visible radiation is 21%.
Mentioned high pressure lamps are produced in wide ranges of wattage (summarized in the table 2.1); shapes and construction layouts [GE, OSR, PHIb].
Table 2.1: HID lamps wattage ranges
HPML HPSL MHL
P [ W ] 40 – 1000 35 – 1000 20 – 2000
Significant influence on the power balance of HIDs has operational po-sition of the lamp. The horizontally burning lamp is about 1 to 10% more inefficient than the vertically burning lamp [KVR06, LLLG04]. A correction
14Example of the tube is in fig. 2.8. 15The cylindric shape e.g. in figure 2.7.
2.5. Electric circuits for electric discharge lamps
can be done by magnetic field or by operation at high frequencies. Unfortu-nately high frequency above 1 kHz brings problems with acoustic resonances16
[BAC04, Mel, Hu01].
2.5
Electric circuits for electric discharge lamps
Electric discharge lamps need some electric circuits for their correct operation as was mentioned above (page 15). It is realized through ballasts, which can be constructed from classical passive components only (resistive/reactive ballasts) or from semiconductors and passive components R, L, C (electronic ballasts).Majority of discharge lamps are powered by AC circuits. Such circuits have to ensure three general functions:
• start of a discharge lamp;
• a lamp relighting each half cycle;
• control of current through a discharge lamp.
Starting of a discharge was described in sec. 2.1.2. The circuit must provide open circuit voltage to ionize the gas in a discharge lamp. Its value depends generally on the type of the discharge lamp (LPLs need ∼1 kV and HPLs ∼10 kV). A method of a discharge lamp starting has great impact on its life time. Many different techniques are used. Some of them utilizes components which are internal part of a discharge lamp circuit and it is not possible to separate them. In another cases the external components are used. The working time of such circuits can be various. They can work during starting periods or continuously during operational time of the lamp. A typical example of such internal component is starting electrode in-side the discharge tube (fig. 2.8 by HPML and quartz MHL) that helps for thermionic emission of electrons and start voltage decreasing. After ignition sequence work main electrodes only.
The connection of an external starter (ignitor) in combination e.g. with inductive ballast is another approach. The starter can be glow-switch starter17
16In some frequency ranges can occur the standing pressure wave in discharge tube.
This phenomenon depends on the lamp geometry, gas temperature and pressure inside the discharge tube.
17Two bimetallic electrodes enclosed in a glass container filled with noble gas more e.g.
or electronic starter18. They have no impact on the lamp when is the
dis-charge ignited. It can be demonstrated by their taking out of the circuit. The current flows every half period through zero in AC mode. The circuit must provide the higher voltage across the lamp in the beginning of each half period than in the rest of the half period.
The control of a current through a discharge means its limitation and stabilization in operation point. This can be realized by resistor or inductive or capacitive impedance. Most circuits use inductive ballasts (also known as magnetic ballasts) because for mains frequency 50 Hz (60 Hz) are better. For higher frequencies 102 to 103Hz the capacitive ballasts are used. The value
of their impedance (id. size, efficacy, . . . etc.) depends on frequency. It is the reason (not only this indeed) to use electronic ballast, where the frequencies are much more higher than mains frequency. Advantages and disadvantages of MB and EB are summarized in table 2.2.
Table 2.2: Influence of voltage frequency on induction ballasts [Wha00a]. at mains frequency
+ high voltage at relight − weight (L ∼ H)
+ low cost − inefficient
+ reliable − flicker
− low lamp efficiency (FL)
at high frequency (>20 kHz)
+ increased lamp efficiency (FL) − cost
+ no flicker − acoustic oscillations (HPL)
+ increased ballast efficiency + low weight (L ∼mH)
+ simple implementation (half bridge) + plenty of voltage for starting
+ features (dimming, power control)
In figure 2.9 is the typical electric circuit with discharge lamp. The mains voltage u(t) is connected in parallel to the capacitor. In series are inductive (magnetic) ballast and parallel combination of lamp and starter. During the steady operation state the current i(t) induces fall voltage on ballast
2.5. Electric circuits for electric discharge lamps
Starter
Ballast
u
lamp(i(t))
i(t)
u (t)
ballu(t)
C
Lamp
Figure 2.9: Typical electric circuit for discharge lamp with inductive ballast, starter and compensating capacitor.
uball(t) and lamp ulamp(i(t)). Through the opened starter does not flow any
current. Under this condition is possible to write equation 2.7, where ballast is represented by ideal resistance R and inductance L.
ulamp = u − uball,
uball = iR + L
di dt
(2.7)
The functional relationship between ulamp and i is not in accordance with
Ohm’s law (eq. 2.4) as was noted above. It is highly nonlinear. Waymouth presents dependence of the lamp voltage on logarithmic derivative of current and current itself:
ulamp ³ i,1 i di dt ´
A quantitative solution for the equation 2.7 is not in [Way71] offered and has not been successfully proposed until now.
![Figure 2.6: Structure of a LP rare-gas discharge lamp in DC mode [Wha00a, Way71].](https://thumb-eu.123doks.com/thumbv2/123doknet/2221718.14935/41.892.176.698.185.533/figure-structure-rare-discharge-lamp-mode-wha-way.webp)
![Table 2.2: Influence of voltage frequency on induction ballasts [Wha00a]. at mains frequency](https://thumb-eu.123doks.com/thumbv2/123doknet/2221718.14935/47.892.159.710.596.914/table-influence-voltage-frequency-induction-ballasts-mains-frequency.webp)