Development and validation of a multi-residue method for pesticide
determination in honey using on-column liquid-liquid extraction and liquid
chromatography-tandem mass spectrometry
C. Pirarda, J. Widarta, B.K. Nguyenb, C. Deleuzea, L. Heudta, E. Haubrugeb, E. De Pauwa, J.-F. Focanta
a
Mass Spectrometry Laboratory-C.A.R.T., University of Liege, allée de la chimie, 3. B6c Sart-Tilman, B-4000 Liege, Belgium
b
Functional and Evolutionary Entomology, Gembloux Agricultural University, Passage des Déportes 2, B-5030 Gembloux, Belgium Abstract
We report on the development and validation under ISO 17025 criteria of a multi-residue confirmatory method to identify and quantify 17 widely chemically different pesticides (insecticides: Carbofuran, Methiocarb, Pirimicarb, Dimethoate, Fipronil, Imidacloprid; herbicides: Amidosulfuron, Rimsulfuron, Atrazine, Simazine, Chloroturon, Linuron, Isoxaflutole, Metosulam; fungicides: Diethofencarb) and 2 metabolites (Methiocarb sulfoxide and 2-Hydroxytertbutylazine) in honey. This method is based on an on-column liquid-liquid extraction (OCLLE) using diatomaceous earth as inert solid support and liquid chromatography (LC) coupled to mass spectrometry (MS) operating in tandem mode (MS/MS). Method specificity is ensured by checking retention time and theoretical ratio between two transitions from a single precursor ion. Linearity is demonstrated all along the range of concentration that was investigated, from 0.1 to 20 ngg-1 raw honey, with correlation coefficients ranging from 0.921 to 0.999, depending on chemicals. Recovery rates obtained on home-made quality control samples are between 71 and 90%, well above the range defined by the EC/657/2002 document, but in the range we had fixed to ensure proper quantification, as levels found in real samples could not be corrected for recovery rates. Reproducibility is found to be between 8 and 27%. Calculated CCα and CCβ (0.0002-0.943 ngg-1 for CCα, and 0.0002-1.232 ngg-1 for CCβ) show the good sensitivity attained by this multi-residue analytical method. The robustness of the method has been tested in analyzing more than 100 raw honey samples collected from different areas in Belgium, as well as some wax and bee samples, with a slightly adapted procedure.
Keywords: Pesticides; Liquid chromatography; Tandem mass spectrometry; Honey; Diatomaceous earth; On-column liquid-liquid extraction
1. INTRODUCTION
During recent years, some beekeepers were confronted to hush off their beehives in Belgium. As external observers did not find any classical illness in those hives, several hypotheses were proposed to explain the withering: specific illnesses, pesticide contamination, poor beekeeping practices, etc. Although, several projects were conducted in Europe for the study of separated factors such as Imidacloprid levels, no satisfactory
explanation could however be given. A multifactorial study has thus been initiated at the Belgian Walloon Region level. Specialized observers have studied beekeeping practices, common illness in the hives and environmental conditions around hives for selected Belgian locations. Consequently, a list of pesticides including both product types used in apiculture and the surrounding agriculture has been extracted. This list consists in a large number of compounds belonging to different chemical classes of insecticides, herbicides and fungicides, which could be the source of the bee decline. In order to verify this assumption, a wide range of pesticides has to be monitored in different honey, wax and bee samples coming from different injured and safe areas.
In the past decades numerous publications have already reported analytical method for pesticide determination in honey, and a review published 4 years ago has highlighted the most relevant ones [1]. These studies, however, usually focused on the analysis of very few compounds, often belonging to one or two pesticide families at the most, such as organochlorine or organophosphorous residues. As demands of pesticide analysis started to be more motivated accordingly similar agrarian uses rather than similar physico-chemical properties of chemicals, multi-analyte determinations have appeared since the end of nineties, covering several classes of pesticides [2-5]. The challenge of such a strategy is to include in a single procedure a broad range of compounds having widely different structures and properties.
for such difficult matrix as honey [1,6-8]. However, LLE requires large amounts of solvent, is time consuming, laborious and not well suited for automation [1,6]. As an alternative, solid phase extraction (SPE) or matrix solid phase dispersion (MSPD) has been widely developed in the past decades. Their simplicity, robustness, rapidity and low solvent consumption are attractive parameters for the analytical chemist. Whereas SPE is based on the retention of selected analytes on cartridge sorbents and their elution with appropriate solvent, MSPD consists in the dispersion of the matrix on a free-adsorbent and its homogeneous packing on a column prior to elution of compounds with organic solvent allowing the extraction of semi-solid and solid samples [9,10]. The other side of the coin is its poor capability for high sample input [11]. Solid-phase microextraction (SPME) has also been studied for pesticide analysis in honey [2,12] but showed sample input limitations and relatively high limit of detection [11]. Supercritical fluid extraction (SEE) and stir-bar sorptive extraction (SBSE) still remain quite marginal in this area until now [5,13]. In this study, an on-column liquid-liquid extraction (OCLLE) method has been tested as it seemed to combine advantages of LLE, SPE and SPME.
Mass spectrometery represents the most selective detector for pesticides as it provides structural information allowing unequivocal confirmation and its use in a multi-residue screening context. Although GC is often reported as the most powerful separation tool, it involves a derivatization step for thermally unstable compounds. This introduces additional handling and reaction, thus potentially reducing reproducibility and recovery rates [1]. The goals of the present study were to develop and validate under ISO 17025 criteria a multi-residue screening method to identify and quantify 17 widely chemically different insecticides (Carbofuran, Methiocarb, Pirimicarb, Dimethoate, Fipronil, Imidacloprid), herbicides (Amidosulfuron, Rimsul-furon, Atrazine, Simazine,
Chlorotoluron, Linuron, Isoxaflutole, Metosulam), fungicides (Diefhofencarb) and some metabolites
(Methiocarb sulfoxide and 2-Hydroxytertbutylazine) potentially present in honey. This method is based on on-column liquid-liquid extraction and liquid chromatography coupled to mass spectrometry (LC-MS) operating in tandem mass spectrometry mode (MS/MS). This analytical procedure was evaluated according to European Commission advice 2002/657/EC [14] in terms of trueness, reproducibility, sensitivity, specificity and robustness. A slightly adapted procedure was also developed and applied to wax and bee samples.
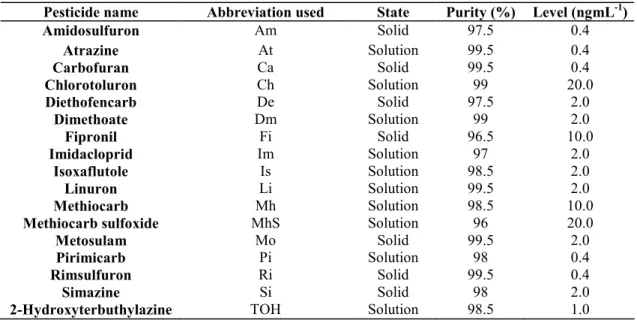
Table 1: List of the pesticide abbreviated names used all along this manuscript as well as method development concentration levels in the surrogate standard solution.
Pesticide name Abbreviation used State Purity (%) Level (ngmL-1)
Amidosulfuron Am Solid 97.5 0.4 Atrazine At Solution 99.5 0.4 Carbofuran Ca Solid 99.5 0.4 Chlorotoluron Ch Solution 99 20.0 Diethofencarb De Solid 97.5 2.0 Dimethoate Dm Solution 99 2.0 Fipronil Fi Solid 96.5 10.0 Imidacloprid Im Solution 97 2.0 Isoxaflutole Is Solution 98.5 2.0 Linuron Li Solution 99.5 2.0 Methiocarb Mh Solution 98.5 10.0
Methiocarb sulfoxide MhS Solution 96 20.0
Metosulam Mo Solid 99.5 2.0
Pirimicarb Pi Solution 98 0.4
Rimsulfuron Ri Solid 99.5 0.4
Simazine Si Solid 98 2.0
2-Hydroxyterbuthylazine TOH Solution 98.5 1.0
2. EXPERIMENTAL 2.1. Reagents and standards
Water was obtained from a Milli-Q® Ultrapure Water Purification Systems (Millipore, Brussels, Belgium). Acetone, ethyl acetate and acetonitrile were Pestanal® reagents (Promochem, Molsheim, France), while NaCl was from Acros Organics (Geel, Belgium) and acetic acid from JT Baker (Deventer, The Netherlands). ChemElut cartridges (5 mL) were purchased from Varian Inc. (Varian, Sint-Katelijne-Waver, Belgium). These disposable cartridges contain cleaned diatomaceous earth packed in pure polypropylene housing and a
hydrophobic membrane at the base of the cartridge to ensure that moisture is excluded from the extract. Liquid nitrogen was purchased from Air Liquide (Liege, Belgium). All pesticide reference standards are produced by Dr. Ehrenstorfer (Augsburg, Germany); their concentrations are listed in Table 1. Linuron D6 (C9H4Cl2N2O2D6)
also produced by Dr. Ehrenstorfer (100 µg mL-1) was used as deuteriated surrogate standard to check extraction step because of its easy commercial availability and its suitable retention time on the LC column. PALL Bulk GHP Acrodic 13 mm syringe filters (pore diameter: 0.2 µm) were purchased from VWR International Belgique (Leuven, Belgium).
Honey, wax and bee samples were collected in 16 hives spread out in Wallonia (Belgium) during the winter 2004-2005.
2.2. Sample preparation
Extraction of pesticides in honey was inspired by the procedure developed by Klein et al. [15] for multi-residue determination in fruits and vegetables. It has been modified to extract the selected chemicals from raw honey samples. Aliquots of 1 g of honey were spiked with 20 µL of surrogate standard (see Table 1 for concentrations) before mechanical transversal agitation with 1.25mL of water and 2.5mL of acetone for 1h. A 20% NaCl solution (1.25 mL) was then added and the mix was loaded on the Chem Elut cartridge. After a waiting period of 15 min, analytes were eluted by gravity twice with 10 mL of ethyl acetate. Extracts were then evaporated at 30 °C until dryness under a gentle stream of nitrogen, and transferred with 200 µL to an acetonitrile-water solution (10:90) in vials suited for LC injection.
Classical LLE was performed as follows: 6.5 mL of acetoni-trile was added to 1 g of honey dissolved in 2 mL of water and mechanically shaken for 30 min. Organic and aqueous phases were separated by centrifugation (15 min at 2000 rpm). Organic layer was then evaporated down to 100 µL and added to 100 µL of water. This final extract was filtered before being injected in LC-MS.
Bee samples were frozen with liquid nitrogen and crushed to obtain a fine homogeneous powder. OCLL extraction was then performed on aliquots of 0.5 g with the same procedure as described for honey.
Wax extraction was quite different. Samples were also frozen and ground to a fine powder. 0.5 g was weighted, spiked with 20 µL of surrogate standard and agitated with 10 mL of hexane and 10 mL of acetonitrile for 1 h. Centrifugation was applied for 20 min, and the organic phase was re-extracted with 10 mL of acetonitrile. Both aqueous phases were evaporated at 30 °C until dryness under a gentle stream of nitrogen. Two hundred microliters of an acetonitrile-water solution (10:90) was added, filtered and transferred in vials suited for LC injection.
2.3. Instrumental analysis
Analysis were carried out on a Quattro Ultima Platinum triple quadrupole mass spectrometer coupled to an Alliance 2690 liquid chromatograph (Waters, Manchester, UK). The chromatograph was equipped with a Polaris C18-A HPLC column (150 mm × 2.0 mm, 3 µm, 200 Å) from Varian Inc., kept at 40 °C. The mobile phase consisted of acetonitrile and water, both acidified with 0.1 % of acetic acid. Gradient was applied at a flow rate of 0.4 mL min-1 as follows: held the initial conditions of 10% acetonitrile in water for 1 min, increased linearly to 80% in 14 min, increased linearly to 100% in 2 min, held at 100% during 1.9 min, returned to initial conditions in 0.1 min and maintained for 4 min. The LC effluent was split using a T-splitter to produce a flow of 0.2 mL min-1. The quadrupole mass spectrometer was equipped with a Z-spray source for positive electrospray ionization (ESI). Capillary and cone voltages were set at 3 kV and 35 V, respectively, and temperature source was kept at 125 °C while desolvatation temperature was held at 250 °C. Nitrogen was used as cone and desolvating gas at a flow rate of 100 and 680Lh-1, respectively. Mass spectrometer operated in MS/MS mode using multiple reactions monitoring (MRM). 99.8% pure argon from Air liquide (Liège, Belgium) was used as collision gas at a constant pressure of 2 × 10⁻³ mbar. Table 2 summarises the acquisition window definition, masses of parent and daughter ions that are monitored, and the optimized collision induced dissociation (CID) voltages.
3. RESULTS AND DISCUSSION 3.1. Extraction assays
Pesticide extractions from raw honey were carried out by on-column liquid-liquid extraction. This technique is based on classical LLE principle, but assisted by inert solid support. This inert matrix consisted in diatomaceous earth, well-known for its high porosity, its high dispersing capacities and its high capacity for aqueous
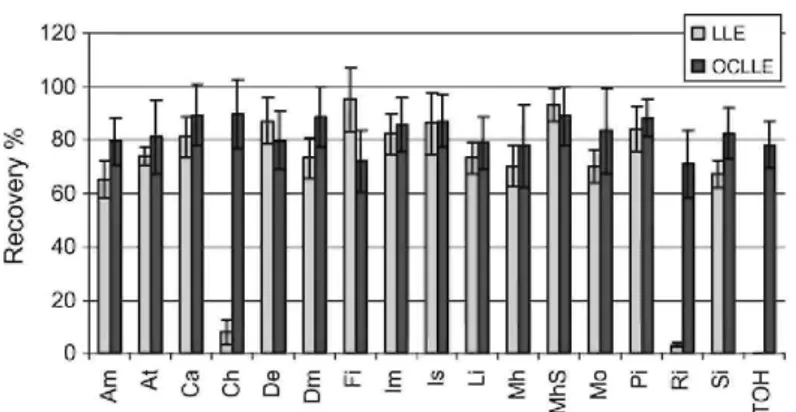
adsorption [16,17]. It has been already used in several chemical extraction applications [18-22]. In the present extraction step, diatomaceous earth has been factory pre-packed in disposable cartridges commercially available under trade name of Chem Elut, from Varian Inc. Comparison between OCLLE and classical LLE has been carried out to check extraction efficiency and suitability of the procedure. Results are shown in Fig. 1. OCLLE seemed to provide similar or even higher extraction efficiency and higher repeatability than LLE for some compounds. Moreover and above all, OCLLE provides the real advantage over LLE to avoid emulsion formation in ensuring immiscibility of organic solvents and aqueous matrix. This, therefore, significantly eases extraction procedure [23]. Fidente et al. [24] have developed an extraction procedure based on identical principles for insecticide analysis in honey, but this study involved a single class of insecticides and therefore included a limited number of chemically related compounds. Moreover, cartridges that were used appeared to require a drying step using nitrogen flow, increasing the analysis time and the procedure complexity. The strong points of Chem Elut cartridges were their ease of use and the wide range of compounds that could be extracted efficiently. 3.2. LC-MS/MS data
Most of the target pesticides are separated by LC prior to MS detection except Dimethoate and Fipronil, which are reported to be analyzed by GC-MS or SPME-GC-MS. To avoid derivatiza-tion step and allow a less rugged clean-up [6] were the reasons which led us to use liquid instead of gas chromatography. The configuration of the Z-spray source designed at first to prevent fragmentation during ionization [25] enhances LC robustness in terms of matrix related interferences, as only charged species enter in the detector. The use of tandem mass
spectrometry confers high specificity and reduces the risk of potential interferences related to the complexity of the matrix. Each precursor ion was fragmented by collision-induced dissociation and the two most abundant produced ions were monitored. In addition to this gain of selectivity, the use of the MS/MS mode substantially increases sensitivity by limiting the high background noise related to the honey matrix.
Fig. 1: Comparison between recoveries obtained by OCLLE and classical LLE.
The Polaris C18-A column is used to be dedicated to drug and drug metabolite discovery [26,27]. The silica phase of this HPLC column is bonded to octadecyl chain with a polar group maximizing polar retention and selectivity, and eliminating silanol residues. This allowed to cover a broad range of chemically different compounds. LC gradient has been optimized to distinguish the 17 pesticides keeping in mind that coeluted compounds showing different masses could be separated by the mass spectrometer using multiple reaction monitoring (MRM) mode. In order to achieve the best compromise between time analysis and sensitivity, the number of transitions in a single window has been limited to 12. As for each precursor compound, two product ions have been recorded; this represented a maximum of six pesticides monitored by acquisition window. An example of chromatogram is presented in Fig. 2b for a methanolic standard solution showing pesticide
concentrations ranging between 0.4 and 20 ng mL-1 depending on the congener (Table 1). The total LC cycling (separation and return to start conditions) program was of 23 min.
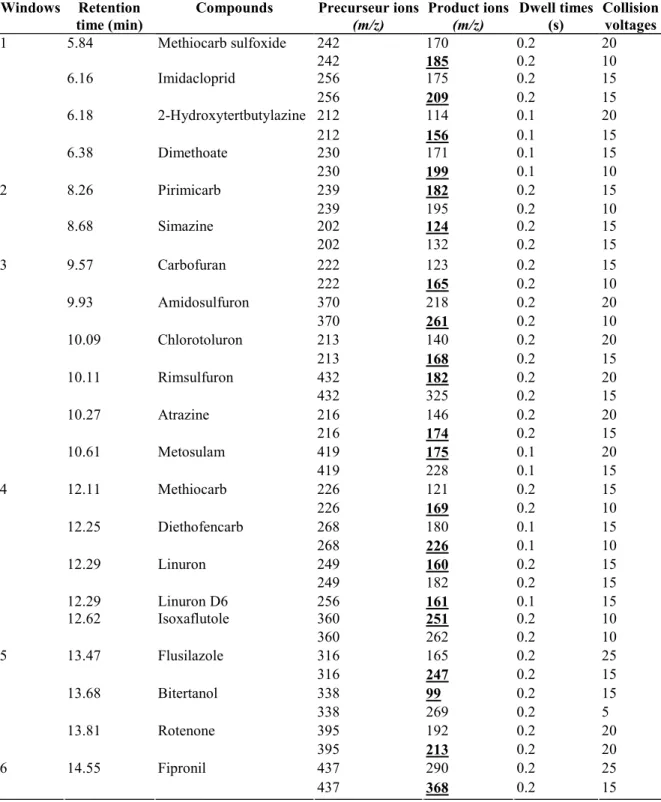
Table 2: List of acquisition parameters Windows Retention
time (min)
Compounds Precurseur ions
(m/z) Product ions (m/z) Dwell times (s) Collision voltages Methiocarb sulfoxide 242 170 0.2 20 5.84 242 185 0.2 10 Imidacloprid 256 175 0.2 15 6.16 256 209 0.2 15 2-Hydroxytertbutylazine 212 114 0.1 20 6.18 212 156 0.1 15 Dimethoate 230 171 0.1 15 1 6.38 230 199 0.1 10 Pirimicarb 239 182 0.2 15 8.26 239 195 0.2 10 Simazine 202 124 0.2 15 2 8.68 202 132 0.2 15 Carbofuran 222 123 0.2 15 9.57 222 165 0.2 10 Amidosulfuron 370 218 0.2 20 9.93 370 261 0.2 10 Chlorotoluron 213 140 0.2 20 10.09 213 168 0.2 15 Rimsulfuron 432 182 0.2 20 10.11 432 325 0.2 15 Atrazine 216 146 0.2 20 10.27 216 174 0.2 15 Metosulam 419 175 0.1 20 3 10.61 419 228 0.1 15 Methiocarb 226 121 0.2 15 12.11 226 169 0.2 10 Diethofencarb 268 180 0.1 15 12.25 268 226 0.1 10 Linuron 249 160 0.2 15 12.29 249 182 0.2 15 12.29 Linuron D6 256 161 0.1 15 Isoxaflutole 360 251 0.2 10 4 12.62 360 262 0.2 10 Flusilazole 316 165 0.2 25 13.47 316 247 0.2 15 Bitertanol 338 99 0.2 15 13.68 338 269 0.2 5 Rotenone 395 192 0.2 20 5 13.81 395 213 0.2 20 Fipronil 437 290 0.2 25 6 14.55 437 368 0.2 15
Masses in bold underlined are those used for quantification. 3.3. Method validation
Specific guidelines have been produced by the European Commission for the validation of both vegetal and animal product analysis [14,28]. As honey is a product of animal origin such as eggs or milk by-products, the analytical procedure has been validated in compliance with the European Commission decision EC/657/2002 [14] dedicated to the measurement of residues in living animals or their derived products. This group of contaminants includes banned compounds or residues for which maximum levels (MRL) have been assigned (compounds belonging to the group B from annex 1 of 96/23/EC [29]). Although pesticides targeted in this work did not belong to this "blacklist", this guideline has been chosen because of its particular rigor and precision. Validation will therefore involve determination of the specificity, the calibration curves, the trueness, the
accuracy (repeatability and reproducibility), the sensitivity and the robustness.
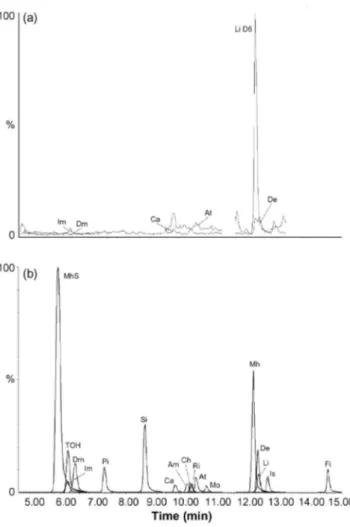
Fig. 2: Typical reconstructed chromatogram based on specific masses (in bold underlined in Table 2) obtained for a honey blank matrix (a) and for a methanolic standard solution (b) using the Polaris C18-A column and the optimized LC conditions.
3.3.1. Specificity
In order to prevent misidentification of analytes due to interferences, relative retention time (RRT) has been checked for each pesticide and a maximum deviation of 2.5% from the expected RRT accepted. Additionally, two transitions from a single precursor ion were monitored to complete identification insurance. These transitions have been chosen for each target on standard solution as the most abundant ions produced from precursor. Fig. 3 shows an example for the determination of most intense fragments obtained by MS/MS for Imidacloprid and optimization of collision voltages. Identification of analytes was confirmed if isotopic ratio bias from standard theoretical ratios were below 20%. Although two produced ions have been recorded, quantification has been performed using only one mass because of software limitation. These masses represent the most intense ions produced and are listed in bold underlined in Table 2.
Fig. 3: Collision voltage optimization for Imidacloprid. The retained voltage (15 V) produced the most intense signals for both transitions yielding masses 175 and 209.
3.3.2. Calibration curves
Calibration curves have been produced for quantification. They were built using blank honey matrix spiked after the extraction step at five different pesticide levels, including the zero point (Table 3). This calibration procedure permits to avoid matrix effect in the electrospray source, such as ion enhancement or suppression. Additionally to criteria required by the 2002/657/EC, a second calibration curve was run at the end of each sample series to check the stability of the detector answer after unknown sample data aquisition. The requirement we set was that the end curve had to show a bias lower than 20%, compared to initial calibration.
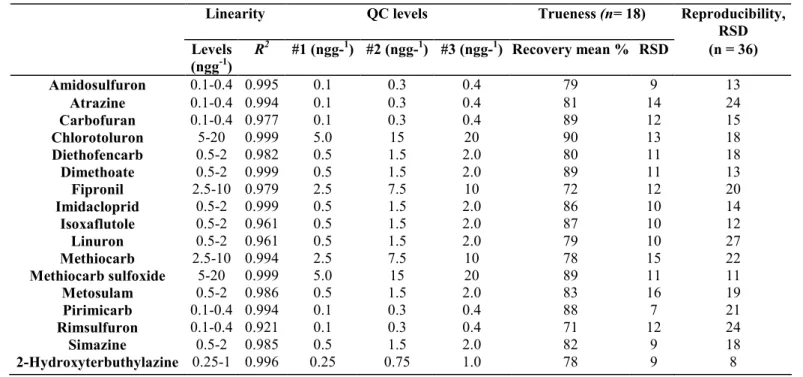
Table 3: Validation process data showing the concentration range inside which the linearity was tested, levels (ng g_1 honey) of the three QC samples analyzed in six replicates and RSD obtained for reproducibility test (QC level #1 and #3 analyzed in six replicates on 3 distinct days by three different operators)
Linearity QC levels Trueness (n= 18) Reproducibility,
RSD Levels (ngg-1) R2 #1 (ngg-1) #2 (ngg-1) #3 (ngg-1) Recovery mean % RSD (n = 36) Amidosulfuron 0.1-0.4 0.995 0.1 0.3 0.4 79 9 13 Atrazine 0.1-0.4 0.994 0.1 0.3 0.4 81 14 24 Carbofuran 0.1-0.4 0.977 0.1 0.3 0.4 89 12 15 Chlorotoluron 5-20 0.999 5.0 15 20 90 13 18 Diethofencarb 0.5-2 0.982 0.5 1.5 2.0 80 11 18 Dimethoate 0.5-2 0.999 0.5 1.5 2.0 89 11 13 Fipronil 2.5-10 0.979 2.5 7.5 10 72 12 20 Imidacloprid 0.5-2 0.999 0.5 1.5 2.0 86 10 14 Isoxaflutole 0.5-2 0.961 0.5 1.5 2.0 87 10 12 Linuron 0.5-2 0.961 0.5 1.5 2.0 79 10 27 Methiocarb 2.5-10 0.994 2.5 7.5 10 78 15 22 Methiocarb sulfoxide 5-20 0.999 5.0 15 20 89 11 11 Metosulam 0.5-2 0.986 0.5 1.5 2.0 83 16 19 Pirimicarb 0.1-0.4 0.994 0.1 0.3 0.4 88 7 21 Rimsulfuron 0.1-0.4 0.921 0.1 0.3 0.4 71 12 24 Simazine 0.5-2 0.985 0.5 1.5 2.0 82 9 18 2-Hydroxyterbuthylazine 0.25-1 0.996 0.25 0.75 1.0 78 9 8
Linearity has been observed all along the area of concentration studied depending on the chemicals. These ranges of concentrations were selected in function of the sensitivity of the mass spectrometer towards each pesticide. They are listed in Table 3, together with correlation coefficient (R2) of the linear regression. Very few compounds showed residual level or background signal in the unfortified honey matrix. A chromatogram built with specific masses of these compounds and the mass of deuteriated Linuron (D6) for comparison is shown in Fig. 2a. This background noise was very low and usually non-significant. As these traces were already taken into account during the calibration, no correction by means of subtracting blank matrix levels was necessary or applied during the quantification process. However, 10 blank matrices were run during the validation to ensure a minimal risk of interferences and guarantee specificity of the method. Additionally, a blank matrix sample was added to each unknown sample series in order to check for lab and solvent potential contamination.
3.3.3. Recovery (trueness)
Other pools of blank honey have been fortified prior to the extraction step for home-made quality control samples (QC) at three different levels, reported in Table 3. For each level, six QC samples have been run. Recoveries have been calculated as the ratio between levels measured in the QC and amounts really added to these blank samples. Particular care has to be taken for the evaporation step. Most pesticides appeared to be really sensitive to dry evaporation, and recoveries can be cut by more than a half if compounds remain in dryness for a too long period even at a maximum of 30 °C.
Recoveries and relative standard deviation (RSD) are listed in Table 3. According to the 2002/657/EC document, these recoveries have to range between 50 and 120%. As already mentioned, as levels found in real samples could not be corrected by the recovery rates, a narrower range, between 70 and 110%, was chosen to ensure at best proper quantification. Although target analytes were characterized by significantly different physico-chemical properties (functional groups, polarity), recorded recoveries were constantly high, accounting for the versatility and efficiency of the extraction and detection methods. One can also mention that if one would use the less strict 50-120% acceptation range stated in the European Directive, one could extend the list of pesticides adequately analyzed by this procedure to other chemicals such as Tribenuron-methyl, Bitertanol,
Difenoconazole, Flusilazole, Difenoconazole, Metazachlor, Tri-floxystrobin, Metconazole and, importantly, the widely spread Rotenone.
3.3.4. Repeatability and reproducibility
According to the 2002/657/EC document, three different QC levels have to be analyzed with six replicates for each level, and these have to be performed on 3 distinct days in order to calculate the method repeatability, as the standard deviation (SD) of the recovery mean. Reproducibility has to be evaluated similarly with minor changes, such as with different operators, different environment, different solvent batches, etc. In this study, only two different QC levels (#1 and #3 in Table 3) were used to keep the validation cost in the budget, resulting in a total of 36 QC measurements. Because different operators contributed to these validation tests, only reproducibility was gathered, as shown in Table 3. RSD ranging between 8 and 27% was judged satisfactory regarding the low levels we dealt with in this work.
3.3.5. Decision limits and detection capacity (CCα and CCβ)
Two different methods can be used to evaluate the decision limit (CCα) when there is no maximal residue limits (MRL) applied to the target pesticides. The first one consists in the analysis of 20 blank materials. The CCα is then equal to three times the signal-to-noise ratio (S/N) in the chromatogram where the analyte is expected. As very few compounds have shown background noise in the time window where they show up, this calculation approach appeared not to be appropriate to properly evaluate the decision limit. The other method is based on the analysis of blank honey matrices spiked prior to extraction with decreasing amounts of compounds, and the comparison between recorded MS signals and concentrations added. CCα is then equal to the concentration corresponding to the sum of the intercept of the linear regression and the reproducibility multiplied by 1.64 (α = 5% as stipulated for compounds belonging to Group B from annex 1 of EU Directive 96/23/EC). Decision limit values obtained for all investigated compounds are listed in Table 4. Detection capacities (CCβ) have been calculated as the concentration corresponding to CCα added to the reproducibility multiplied by a factor of 1.64 ( β = 5%). Those values are also listed in Table 4.
Because very few authors have already reported such validation data on honey and, as different criteria were applied when they did so, comparison with other reported methods is difficult. Our procedure, nevertheless, demonstrates to offer very good sensitivity compared to limits of detection (LODs) and quantification (LOQs)
reported for some pesticides in honey by Albero et al. [4] and Fidente et al. [24].
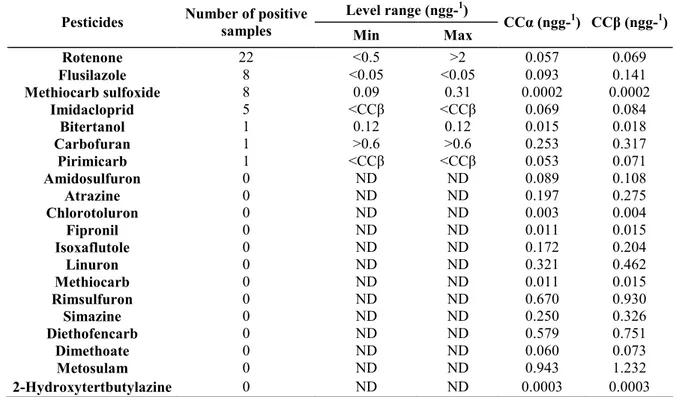
Table 4: Number of the real honey samples in which pesticides where detected and the measured levels (ng g-1 honey)
Level range (ngg-1)
Pesticides Number of positive
samples Min Max CCα
(ngg-1) CCβ (ngg-1) Rotenone 22 <0.5 >2 0.057 0.069 Flusilazole 8 <0.05 <0.05 0.093 0.141 Methiocarb sulfoxide 8 0.09 0.31 0.0002 0.0002 Imidacloprid 5 <CCβ <CCβ 0.069 0.084 Bitertanol 1 0.12 0.12 0.015 0.018 Carbofuran 1 >0.6 >0.6 0.253 0.317 Pirimicarb 1 <CCβ <CCβ 0.053 0.071 Amidosulfuron 0 ND ND 0.089 0.108 Atrazine 0 ND ND 0.197 0.275 Chlorotoluron 0 ND ND 0.003 0.004 Fipronil 0 ND ND 0.011 0.015 Isoxaflutole 0 ND ND 0.172 0.204 Linuron 0 ND ND 0.321 0.462 Methiocarb 0 ND ND 0.011 0.015 Rimsulfuron 0 ND ND 0.670 0.930 Simazine 0 ND ND 0.250 0.326 Diethofencarb 0 ND ND 0.579 0.751 Dimethoate 0 ND ND 0.060 0.073 Metosulam 0 ND ND 0.943 1.232 2-Hydroxytertbutylazine 0 ND ND 0.0003 0.0003
Decision limits and detection capacity (CCα and CCβ) are expressed in ng g-1of raw honey. ND = non-detected.
3.3.6. Robustness
One hundred and nine raw honey samples collected from different areas of Belgium have been analyzed within the scope of the multifactorial study described in the introduction. In practice, honey samples appeared to be characterized by different appearances, depending on the area from where they were collected, with colour ranging from light yellow to dark brown, with different viscosity, etc. Table 4 presents the number of samples in which target pesticides have been found (considered as positive) and ranges of levels measured. Some pesticides which had not successfully passed the validation criteria but had nevertheless showed recovery rates ranging between 50 and 70% have been included in that table (i.e. Rotenone, Bitertanol and Flusilasole). For those, CCα and CCβ have been calculated using the standard deviation evaluated on 18 QCs instead of 36 QCs.
Additionally to honey samples, some bee (99) and wax (98) samples have also been analyzed as a demand for those matrices appeared during the method development study. The slightly modified procedure described in the sample preparation section was used. None of the targeted pesticides was detected in all bee samples, whereas 26 wax samples showed significant levels of Flusilazole, 17 presented positive results for Rotenone, 10 samples had Pirimicarb, 4 and 3 samples showed traces of Bitertanol and Atrazine, respectively. Only one wax revealed levels in 2-Hydroxytertbutylazine. These results demonstrated the flexibility of the procedure regarding matrix types. The range of chemicals analyzed can be extended while keeping the same extraction method but combining LC-MS/MS and GC-MS/MS. This approach has been further developed recently in our laboratory, and pesticides such as Coumaphos, Bromopropylate, Vinclozine, tau-Fluvalinate and Lindane, among otherscan now additionally be detected in honey, bee or wax samples (data not shown).
4. CONCLUSIONS
A rapid, reliable, time and resource saving analytical method is reported for the measurement of a wide range of different chemicals used in apiculture or in the surrounding agriculture in the context of a bee mortality study. The multi-residue analytical procedure developed in this study was based on an on-column liquid-liquid extraction step using diatomaceous earth as inert solid support. Extracts were analyzed without further purification by LC-MS/MS in ESI mode. Extraction by OCLLE using the commercially available Chem Elut cartridges has proven to be efficient for a wide range of pesticides, nearly independent of their polarity. The use of LC-MS/MS permitted to avoid undesirable derivatization steps while lowering sample clean-up requirements,
compared to GC-MS. The extraction and purification have then be considerably reduced and simplified. The MRM allowed to separate the 17 target pesticides in less than 15 min with good specificity.
A complete validation following the European Commission decision 2002/657/EC dedicated to some residues in living animals or their derived products has been performed for the 17 pesticides belonging to widely chemically different families, from organophosphorous to triazines, including ureas, carbamates, pyrazoles, nicotinoids or pyrimidines. Specificity, calibration curves, trueness, reproducibilty, sensitivity and robustness have been tested successfully, demonstrating the suitability of this method for selected compounds. The list of pesticides can easily be extended by adding a GC-MS/MS injection of the extracts. Other matrices such as wax and bee have also been included in the study by slightly adapting the extraction procedure.
Acknowledgements
The authors thank the Fonds Européen de Développement Régional (FEDER), the Fonds Social Européen (FSE), the Walloon Region and the Service Public Fédéral Santé Publique (Formerly Ministère des Classes Moyennes et de l'Agriculture DG6) for their financial support.
References
[1] M. Fernández, Y. Picó, J. Mañes, J. Food Prot. 65 (2002) 1502.
[2] J.J. Jiménez, J.L. Bernai, M.J. del Nozal, M.T. Martin, A.L. Mayorga, J. Chromatogr. A 829 (1998) 269. [3] B. Albero, C. Sanchez-Brunete, J.L. Tadeo, J. AOAC Int. 84 (2001) 1165.
[4] B. Albero, C. Sanchez-Brunete, J.L. Tadeo, J. Agric. Food Chem. 52 (2004) 5828. [5] S.R. Rissato, M.S. Galhiane, F.R.N. Knoll, B.M. Apon, J. Chromatogr. A1048 (2004) 153. [6] F.E. Ahmed, Trends Anal. Chem. 20 (2001) 649.
[7] C. Blasco, CM. Lino, Y. Pico, A. Pena, G. Font, M.I.N. Silveira, J. Chromatogr. A 1049 (2004) 155. [8] Y.R. Tahboub, M.F. Zaater, TA. Barri, Anal. Chim. Acta 558 (2006) 62.
[9] S.A. Barker, J. Chromatogr. A 880 (2000) 63.
[10] E.M. Kristenson, L. Ramos, U.A.T Brinkman, Trends Anal. Chem. 25 (2006) 96. [11] B. Albero, C. Sanchez-Brunete, J.L. Tadeo, Talanta 66 (2005) 917.
[12] N. Campillo, R. Peñalver, N. Aguinaga, M. Hernandez-Cordoba, Anal. Chim. Acta 562 (2006) 9. [13] N. Ochiai, K. Sasamoto, H. Kanda, S. Nakamura, J. Chromatogr. A 1130 (2006) 83.
[14] Commission Decision 2002/657/EC, Off. J. Eur. Commun., 12 August 2002.
[15] J. Klein, L. Alder, A. Schreiber, Application note from Applied Biosystem TM available at http://docs.appliedbiosystems.com/pebiodocs/00113222.pdf.
[16] K.R. Engh, J.L Kroschwitz (Eds.), Diatomite, Kirk-Othmer, 1993. [17] J.F. Lemonas, Am. Ceram. Soc. Bull. 76 (1997) 92.
[18] S. Fustinoni, L. Campo, C. Colosio, S. Birindelli, V. Foà, J. Chromatogr. B 814 (2005) 251. [19] B. Buchele, W. Zugmaier, F Genze, T. Simmet, J. Chromatogr. B 829 (2005) 144. [20] F Sicbaldi, A. Sarra, G.L. Copeta, J. Chromatogr. A 765 (1997) 23.
[22] D. Perret, A. Gentili, S. Marchese, M. Sergi, G. D'Ascenzo, J. AOAC Int. 85 (2002) 724. [23] C. Sánchez de la Torre, MA. Martínez, E. Almarza, Forensic Sci. Int. 155 (2005) 193. [24] P. Fidente, S. Seccia, F Vanni, P. Morrica, J. Chromatogr. A 1094 (2005) 175.
[25] U.N. Andersen, G. Seeber, D. Fiedler, K.N. Raymond, D. Lin, D. Harris, J. Am. Soc. Mass Spectrom. 17 (2006) 292. [26] I. Clarot, A. Regazzeti, N. Auzeil, F Laadani, M. Citton, P. Netter, A. Nicolas, J. Chromatogr. A 1087 (2005) 236. [27] G Chiti, M. Municchi, V. Paschetta, D. Nistri, G. Roncucci, J. Chromatogr. B 809 (2004) 167.
[28] Commission Recommendation 1999/333/EC, Off. J. Eur. Commun., 3 March 1999. [29] Council Directive 96/23/EC, Off. J. Eur. Commun., 29 April 1996.