HAL Id: hal-02527873
https://hal.archives-ouvertes.fr/hal-02527873
Submitted on 1 Apr 2020
HAL is a multi-disciplinary open access
archive for the deposit and dissemination of
sci-entific research documents, whether they are
pub-lished or not. The documents may come from
teaching and research institutions in France or
abroad, or from public or private research centers.
L’archive ouverte pluridisciplinaire HAL, est
destinée au dépôt et à la diffusion de documents
scientifiques de niveau recherche, publiés ou non,
émanant des établissements d’enseignement et de
recherche français ou étrangers, des laboratoires
publics ou privés.
Vehicular Networks
Joseph Kamel, Mohammad Raashid Ansari, Jonathan Petit, Arnaud Kaiser,
Ines Ben Jemaa, Pascal Urien
To cite this version:
Joseph Kamel, Mohammad Raashid Ansari, Jonathan Petit, Arnaud Kaiser, Ines Ben Jemaa, et
al.. Simulation Framework for Misbehavior Detection in Vehicular Networks. IEEE Transactions on
Vehicular Technology, Institute of Electrical and Electronics Engineers, In press, IEEE Transactions
on Vehicular Technology, 69 (6), pp.6631-6643. �10.1109/TVT.2020.2984878�. �hal-02527873�
Simulation Framework for Misbehavior Detection in
Vehicular Networks
Joseph Kamel
∗†, Mohammad Raashid Ansari
‡, Jonathan Petit
‡, Arnaud Kaiser
∗, Ines Ben Jemaa
∗, and Pascal
Urien
†Copyright (c) 2015 IEEE. Personal use of this material is permitted. However, permission to use this material for any other purposes must be obtained from the IEEE by sending a request to [email protected].
∗
IRT SystemX, Palaiseau, France
†T´el´ecom ParisTech, Paris, France
‡OnBoard Security, Inc., Wilmington, USA
Abstract—Cooperative Intelligent Transport Systems (C-ITS) is an ongoing technology that will change our driving experience in the near future. In such systems, vehicles and Road–Side Unit (RSU) cooperate by broadcasting V2X messages over the vehicular network. Safety applications use these data to detect and avoid dangerous situations on time. MisBehavior Detection (MBD) in C-ITS is an active research topic which consists of monitoring data semantics of the exchanged Vehicle-to-X communication (V2X) messages to detect and identify potential misbehaving entities. The detection process consists of performing plausibility and consistency checks on the received V2X messages. If an anomaly is detected, the entity may report it by sending a Misbehavior Report (MBR) to the Misbehavior Authority (MA). The MA will then investigate the event and decide to revoke the sender or not. In this paper, we present a MisBehavior Detection (MBD) simulation framework that enables the research community to develop, test, and compare MBD algorithms. We also demonstrate its capabilities by running example scenarios and discuss their results. Framework For Misbehavior Detection (F2MD) is open source and available for free on our github.
Index Terms—Cooperative Intelligent Transport Systems (C-ITS), MisBehavior Detection, Simulation
I. INTRODUCTION
The field of Intelligent Transport Systems (ITS) is ad-vancing at much faster pace in the last couple of years. Autonomous vehicles are a reality now with vehicles gaining up to level-4 driving capabilities i.e. without much human intervention [1]. A plethora of technologies has been applied and/or invented to support the future of ITS. Sensors such as RADAR, LIDAR and camera are heavily used for applications such as Advanced Driver Assistance System (ADAS), lane keeping, forward collision warning, etc. However, the afore-mentioned sensors only work in line-of-sight conditions. For non-line-of-sight applications, technologies such as Dedicated Short-Range Communication (DSRC) and Cellular Vehicle-to-Everything (C-V2X) have been under research and develop-ment.
DSRC and C-V2X support the next generation of vehi-cles known as Connected Vehicle (CV). Connected Vehivehi-cles broadcast their kinematic information (e.g., position, speed, heading, etc.) on an ephemeral network known as Vehicular Ad hoc NETwork (VANET). This enables CVs to “see” beyond
Manuscript received XXX, XX, 2019; revised XXX, XX, 2020.
the line-of-sight, but it also brings with it an attack surface. An actively participating entity in a VANET can lie about its kinematics, causing disruption in the network and in-directly causing safety issues on the road. Such an action is known as a misbehavior in VANETs. Misbehavior in VANETS includes malfunctioning entities unintentionally sending faulty information and malicious entities intentionally transmitting false information in a V2X attack.
MisBehavior Detection (MBD) in VANETs is an active field of research that concentrates on developing mechanisms to detect anomalous behavior pertaining to vehicle move-ment, transmission, etc. MBD algorithms could be sensor-based or sensor-based. In this paper, we concentrate on V2X-based MBD. In order to perform substantial research, these techniques have to be implemented on a large scale, in dif-ferent scenarios, with a variety of vehicle densities and many other variations. Currently, there are only a few widespread deployments of CVs [2], [3]. A variety of problems still exist with these deployments such as the limited number of use cases and the strict regulations on the generated data. Obtaining raw, untouched data is difficult due to regulations that require anonymization and stripping of information that may be helpful in designing detection algorithms. Also, finding a suitable subset of data for analysis warrants spending huge amounts of time that could be used in actually designing MBD algorithms. Hence, there is a crucial need to simulate VANETs and evaluate MBD algorithms in those simulations.
Simulators such as VEhicles In Network Simulation (VEINS) [4] provide a platform for MBD algorithm de-velopment. In this paper we propose our Framework For Misbehavior Detection (F2MD). F2MD provides a singular
framework with which one can:
• Implement a set of new V2X attacks,
• Implement several MBD algorithms for easy comparison,
• Evaluate effectiveness of attacks (we provide 6 attacks and 9 faulty behaviors with our framework),
• Assess performance of MBD algorithms (we provide 15 algorithms with our framework), using 8 metrics,
• Visualize in real-time the MBD algorithms performance,
VeReMi [5], [6],
• Evaluate multiple misbehavior report formats and global
MisBehavior Detection algorithms.
The structure of this paper is as follows. We discuss the related work in Section II. In section III we detail the system model. In section IV we explain our proposed framework in detail. In section V, we run multiple examples with our framework to demonstrate the extent of results one can get from it. Section VI presents our conclusion and future work.
II. RELATEDWORK
In this section we give an overview of the related work about MBD techniques ranging from generic, physical layer to machine learning based. We also discuss work related to simulation of these techniques, the metrics used to evaluate their performance, and attacks considered in each work.
Van der Heijden et al. [7] did a survey on MBD in C-ITS. They provided a taxonomy of node-centric and data-centric detection techniques, and compared them according to their scope, security, privacy, ability to generalize and resources required. The survey showed that no perfect techniques exist yet. The survey concluded with open challenges: definition of thresholds, protection against Sybil attack, and reporting to back-end to name a few. The F2MD framework proposed here aims at finding solutions to these open challenges.
Kamel et al. [8] investigated MBD algorithms feasibility with respect to current standards, law compliance, as well as hardware/software requirements. The authors showed that some MBD algorithms do not comply with current regulations (laws or standards). Most of the challenges discussed in the study originated from privacy protection regulations. The F2MD framework could help with finding privacy-preserving
MBD solutions by integrating various Pseudonym Change Policies (PCP) (the current privacy solution for C-ITS). MBD algorithms could thus be tested against different PCPs.
Sun et al. [9] explored verifying an attacker’s location and mobility using features available at the application and physical layer of Vehicle-to-Vehicle communication (V2V) communication. In their attacker model, the attacker transmits dubious locations inside the Basic Safety Messages (BSMs). This attacker can be a ”lone-wolf” or can collude with other attackers who will corroborate the false data. The authors consider only a straight highway scenario with at least one honest vehicle in the communication range of the ego vehicle. They verify the attacker’s location and mobility information using Angle of Arrival estimation (AoA), Doppler Speed measurement (DS), extended Kalman filter (EKF) and input from neighboring vehicles. They evaluate their mechanism in terms of true-positive rate, false-positive rate, true-negative rate and false-negative rate. The authors implemented their framework in MATLAB and performed evaluation in the same environment.
In [10], the authors proposed an MBD mechanism based on a support vector machine (SVM) and Dempster-Shafer theory (DST) of evidence to detect false message injection. The SVM-based classifier is used to detect false messages based on message content and vehicle attributes. Another SVM-based
classifier is used to evaluate whether the vehicle is credible based on its behavior in terms of message propagation. Then, DST is used by a trusted third party, which aggregates multiple trust assessment reports about the same vehicle and derives a comprehensive trust value. The authors evaluate their system’s performance based on true-positive rate, false-positive rate, and accuracy. They performed their simulations in VEINS. Putting their proposal into our framework, the DST would be part of the MA. Our F2MD contains a stress attack on the
MA that generates a large number of fake reports. As noted by the author, this type of attack would be helpful to test and improve this DST algorithm.
So et al. [11] proposed a framework to use plausibility checks as feature vector for evaluating two machine learning models (SVM and KNN). They evaluated the performance of these models in terms of their classification accuracy and precision-recall characteristics. They scored their loca-tion plausibility, movement plausibility and other quantitative features to feed into SVM and KNN models. The authors considered location spoofing attacks from the VeReMi dataset [5]. The attacks and detection were performed on the LuST scenario [12]. Their simulation data was generated using VEINS and evaluation was performed in MATLAB. Although, their study was comprehensive, the attack type was limited to location spoofing attacks.
It is safe to assume that simulations are a crucial part of evaluation of MBD algorithms. For V2V simulations, a simulator should consist of network and mobility models that simulate real-world V2V scenarios. Simulators such as NS3 and OMNET++ provide feature-rich environments for network simulations. However, these simulators do not sim-ulate a crucial aspect of VANETs, a vehicle’s mobility model. Simulations performed in MATLAB require a readily available dataset on which MBD algorithms can be run for conducting evaluations.
In C-ITS research, one commonly used network and mo-bility simulator is VEINS [4]. VEINS combines OMNET++ and SUMO (traffic mobility simulator) to create a layer for V2X simulation. VEINS provides APIs to create custom applications that run locally on a vehicle. These applications can react on receiving a beacon from another vehicle and/or on changing its own position among other features. VEINS also provides the capability to generate custom datasets for different road networks. However, it does not include MBD algorithms or the capability to evaluate them.
To the best of our knowledge, there is only one simulation framework that allows evaluation of MBD algorithms in VANET, namely Vehicular Reference Misbehavior (VeReMi) [5]. VeReMi is an extension to VEINS and consists of two main components: (i) a dataset containing transmission data from misbehaving and genuine vehicles for evaluation of MBD algorithms offline; (ii) five position-based attacks and four basic MBD algorithms.
In this paper, we introduce our proposed simulation frame-work F2MD which is also based on VEINS and consists of a
comprehensive list of feature sets, from basic to advanced as discussed in Section IV. F2MD allows conducting studies on a large set of vehicles simulated in a large road network [12].
These road networks can be switched for evaluations on different types of road networks. Attacks can be programmed into attacker vehicles in F2MD, this feature makes sure of no
bias in the attacks. It contains a comprehensive list of position-based and mobility-position-based attacks. It provides MBD algorithms ranging from basic plausibility checks to advanced algorithms based on thresholds, value aggregation and behavioral analy-sis. F2MD also supports addition of machine learning models
for MBD. All MBD algorithms can be extended for further enhancements or new ones can be easily added to the F2MD
framework. F2MD gives the ability to generate misbehavior reports to be sent to an MA. These reports can be chosen to range from a basic report to a report with evidence included to help the MA in its decision. Finally, F2MD provides a visualization feature that generates graphs online and in real-time to analyze the performance of MBD algorithms.
In conclusion, each aforementioned related work uses var-ious methods for evaluating performance of their MBD al-gorithms and are hardly comparable. F2MD offers a free and open-source unified platform to implement attacks on VANETs, implement MBD algorithms and evaluate their per-formance using common metrics.
III. SYSTEMMODEL
A. C-ITS System Model
Cooperative Intelligent Transport Systems (C-ITS) are com-posed of mobile (e.g. passenger vehicle, trucks, aftermar-ket device, hand-held devices) and static entities (e.g. Road Side Unit (RSU), electric vehicle charging station, traffic management center). Each vehicle is equipped with an On-Board Unit (OBU) that enables it to broadcast mobility data (e.g. telematics, motion, maneuvers) to neighboring entities or to the Internet for cloud-based services. The primary goal is to improve road safety by broadcasting frequently (i.e. up to 10Hz as described in the American standard [13]) local beacons (called Basic Safety Message (BSM) in US, or Cooperative Awareness Message (CAM) in Europe). The BSM/CAM contains location, speed, acceleration, brake status and other optional fields [13], [14]. Receiving vehicles will use the BSM/CAM to understand the scene (by fusing its sensor data in the context of automated vehicle) and act upon it (e.g. notify operator, perform maneuver).
One example of safety application using BSM/CAM is the Emergency Electronic Brake Light (EEBL). In EEBL [15], vehicles performing an emergency brake (i.e. decelerating at a level greater than 0.4g) broadcast messages with correspond-ing fields indicatcorrespond-ing its greater deceleration (e.g. field in BSM). On the receiver side, the EEBL application warns the driver in the case of a hard-braking event by a vehicle that is ahead and in the same lane or in an adjacent lane. The EEBL application is expected to function in both straight and curved roadway geometries. The C-ITS safety applications are put in place to improve the road safety and prevent fatal accidents. Therefore, attacks that result in failure of such systems could lead to catastrophic results. The C-ITS system could be subject to external and internal attacks. However, a security architecture is put in place to mitigate the effects of both these attacks.
B. C-ITS Security Architecture
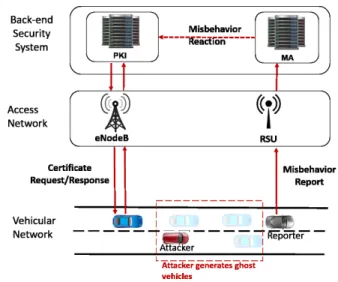
In the current C-ITS system, two types of attackers are possible: External attackers (i.e. without valid credentials) and insider attackers (i.e. with valid credentials). External attacks are treated with a Public Key Infrastructure (PKI) whereas insider attacks are mitigated by a MisBehavior Detection system. Figure 1 shows the various stages of the C-ITS security architecture.
Fig. 1. C-ITS security architecture
External C-ITS attackers, i.e. without valid credentials, are prevented by authenticating every message sent on the medium using digital signature as specified in [16], [17]. Indeed, device authentication relies on a PKI that manages cryptographic material (i.e. generation, provisioning, update, revocation). In the US, the PKI is called the Security Credential Manage-ment System (SCMS) [18] and uses asymmetric cryptography, namely ECDSA, as the authentication algorithm. Moreover, to reduce a vehicle’s trackability, each vehicle uses short-term cryptographic credentials–called pseudonyms–and regularly changes it [19]. Therefore, as discussed in the next section, we assume that cryptographic verification will take care of external attacker and focus on insider attacker.
Insider attackers in C-ITS are handled by a MisBehavior Detection mechanism. As we demonstrate in this paper, the MisBehavior Detection process is divided into four steps:
1) Local MisBehavior Detection: Every C-ITS entity will have to run a MisBehavior Detection system in order to cope with insider attackers.
2) Misbehavior reporting: After detection, the entity will have the opportunity to signal the misbehavior by sending a report to a MA.
3) Global MisBehavior Detection: The MA will investi-gate the event and potentially trigger revocation of the misbehaving entity.
4) Misbehavior reaction: The MA will issue the appropri-ate reaction to protect the system (e.g. perform certificappropri-ate revocation request to the PKI).
C. Attacker Model
In this paper, we consider the following attacker model: 1) Insider: The attacker has the required cryptographic
credentials to communicate in a C-ITS.
2) Active: The attacker actively participates in C-ITS com-munication and sends bogus data.
3) Message payload modification: We assume that the at-tacker can modify any fields in its outgoing BSMs/CAMs. This is possible if an attacker has complete access to his vehicle’s CAN bus. The attacker can mount a man-in-the-middle attack and modify any sensor data.
4) Transmission rate modification: We assume that the attacker can modify the transmission rate of her on-board unit. We assume that the attacker has modified the on-board unit in his vehicle, allowing faster or slower transmission rate depending on the type of attack. 5) Pseudonym certificates access: We assume that the
at-tacker has complete access over the usage of pseudonym certificates. We use the same premise as above that the attacker has modified her on-board unit. It should allow the usage of pseudonym certificates as the attacker pleases. This would enable mounting Sybil attacks. The attacker will performs attacks described in Section IV-F. Following the EEBL example presented in Section III-A, an at-tacker would send wrong deceleration value (potentially along with corresponding mobility data) in order to force sudden braking by the victim(s). Attacker without valid credentials won’t be able to properly sign the message, and verification will fail at the receivers. However, an internal attacker will send authenticated messages and the only way to not be fooled by them is to perform MBD algorithms.
IV. FRAMEWORK
In this section we describe the different components of F2MD. All parts of the framework that are described in the
following section are also available for download in open source format [20].
A. General Framework Characteristics
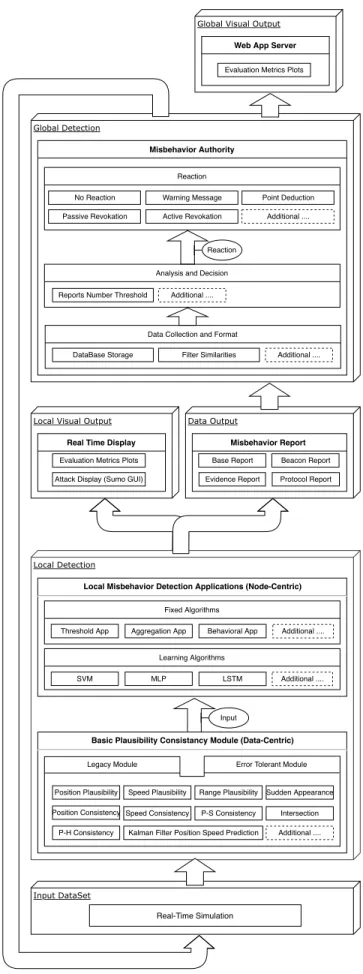
This framework provides complete solution for real time simulation and evaluation of an MBD system. It extends VEINS with a large panel of MBD, evaluation and other general C-ITS modules. One of the main characteristics of F2MD is its modularity. The architecture is organized in several functional levels: input data, local detection, local visual output, report data output and global detection. Ac-cording to the misbehavior evaluation level, the complexity of the scenario, the attacks and the detection method may be chosen. Additionally, F2MD is extensible. Besides the
imple-mented MBD mechanisms and attacks, it offers the possibility to extend the framework with additional modules through the existing API. A key characteristic of our framework is its integration with non-simulated modules such as external Machine Learning modules for advanced MBD and external packet reporting logging. Figures 2 and 3 summarizes this idea while showing the different modules of the architecture. These modules are detailed in Sections IV-C to IV-H.
Data Output Local Detection Misbehavior Report Input DataSet Real-Time Simulation Input
Base Report Beacon Report Evidence Report Protocol Report
Local Misbehavior Detection Applications (Node-Centric)
Fixed Algorithms
Threshold App Aggregation App Behavioral App Additional .... Learning Algorithms
SVM MLP
Basic Plausibility Consistancy Module (Data-Centric)
Legacy Module Error Tolerant Module
Additional .... Position Plausibility Position Consistency Speed Plausibility Speed Consistency Range Plausibility Intersection Sudden Appearance P-H Consistency P-S Consistency Local Visual Output
Real Time Display
Evaluation Metrics Plots Attack Display (Sumo GUI)
Global Detection
Misbehavior Authority
Data Collection and Format
DataBase Storage Filter Similarities Additional .... Analysis and Decision
Reports Number Threshold
Reaction
Reaction
Global Visual Output
Web App Server
Evaluation Metrics Plots
Additional ....
No Reaction Warning Message Point Deduction Passive Revokation Active Revokation Additional ....
LSTM Additional ....
Kalman Filter Position Speed Prediction
Support Modules
Beacons History Detection History Additional ... Sensor Uncertainty Normal Distribution Relative Distribution Fixed Time Disposable Random Additional ... Fixed Dist
Misbehavior Inducing Modules
Faulty Behavior Fixed Pos Fixed Pos
Offset Rand Pos Rand Pos
Offset Fixed Speed Fixed Speed
Offset Rand Speed Rand Speed
Offset Additional ... Data Replay Disruptive Additional ... Eventual Stop Stale Messages Dos Dos Disruptive Congestion Sybil Stale Messages MA Stress Reports History Data Replay Sybil Car2Car Storage Mechanism Pseudonym Policies Attacks
Fig. 3. Diagram representation of the secondary modules
B. Framework Input Data
The first input required for the framework is a sumo scenario. We do provide two scenarios out-of-the-box. The first scenario is from Paris-Saclay area. This network combines some suburban-like grid and some organic network properties. It is a relatively small network for which we generate a vari-able vehicle density. We use it as our test bench for calibration and fine tuning since it provides fast and predictable results. The second scenario is the LuST SUMO network [12]. This scenario is a SUMO network based on population census data and a real traffic information of Luxembourg. This scenario is much slower to run but is more valuable for final simulation results. In addition to SUMO scenario, the VEINS simulation requires an OMNeT++ configuration. The OMNeT++ configuration includes beacon parameters such as the header bit length and the beacon interval. It also includes the Network Interface Card (NIC) settings such as the txPower, bitrate, Recall and thermalNoise. We strongly recommend leaving these settings as the VEINS defaults. The values could be found in the OMNeT++ configuration file on our github. Finally, our framework requires specific inputs like the attack types, the attacker density, the report format and the PCP. This list is not exhaustive but gives a general idea of what types of input is expected. Some inputs are even specific to the type of attack or the PCP. For example, if we choose a periodical pseudonym change, then we have to set the mean change period. A full list of inputs is included in our github.
C. Local Detection
In this framework, we provide a rich module for local MBD. This module provides simple methods to customize and test different algorithms using a simple methodology. The local detection logic goes as follows. The system runs
basic plausibility and consistency checks on every received message. The results are transmitted to the local misbehavior application that decides whether or not to send a report to the MA. Therefore, the local detection could be customized in two locations: the basic plausibility (often called detectors) and the more intelligent detection application (often referred to as data fusion). For this reason, we have implemented multiple versions of the basic checks and multiple misbehavior applications. We also provide a method for real-time machine learning based MBD applications.
1) Plausibility Checks: Inspired by the literature, we ex-tracted a set of basic MBD checks. The following checks or detectors were implemented in their legacy version and in an Error-Tolerant (ET) version. The legacy version is much faster to compute the plausibility checks and returns a binary output to show whether a certain aspect of the message is plausible or not. The ET version is generally slower to compute the plausibility checks but returns an uncertainty factor that reflects the scale of the message implausibility [21]. Here is the list of all the local plausibility checks that are implemented:
• Range plausibility: Check if the position of the sending ITS Station (ITS-S) is inside of the ego ITS-S maximum range (predefined value mapped on the ego ITS-S maxi-mum radio coverage).
• Position plausibility: Check if the position of the sending ITS-S is at a plausible place (e.g. on a road, no overlaps of physical obstacles, etc.).
• Speed plausibility: Check if the speed advertised by the sending ITS-S is less than a predefined threshold.
• Position consistency: Check if two consecutive beacons
coming from a same ITS-S have plausible separating distance.
• Speed consistency: Check if two consecutive beacons
coming from a same ITS-S have plausible acceleration or deceleration.
• Position speed consistency: Check if two consecutive beacons coming from a same ITS-S have consistent speed and separating distance.
• Beacon frequency: Check if the beacon frequency of a sending ITS-S is compliant with the standards.
• Position heading consistency: Check if the positions in two consecutive beacons coming from a same ITS-S correspond to the heading advertised by that ITS-S.
• Intersection check: Check if no two beacons coming
from two different ITS-S have overlapping locations (i.e. both ITS-S overlap each others).
• Sudden appearance: Check if no ITS-S suddenly
ap-peared within a certain range.
• Kalman filter tracking: Check if the ITS-S advertised
information is within a plausinle range of the Kalman filter predicted values. This check is proposed in [22]. 2) Advanced MisBehavior Detection: The MBD applica-tions are the decision making part of the detection logic. They are also referred to as fusion applications since the decision is often based on fusion of multiple factors (the results of the plausibility checks, the node history, etc.). We implemented multiple simple examples. Some of them use a
fixed algorithms and others are based on artificial intelligence. The fixed algorithms were implemented directly into VEINS while the learning applications were implemented in python and accessed through a specific API. The followings are the applications based on fixed algorithms:
• Threshold App: A node is reported if a certain message fails at least one of the plausibility checks. A fail is determined if the result of the check falls below a certain threshold.
• Aggregation App: This application is based on the node history. The checks results of certain messages are aggregated with the last n results. A node is reported if the aggregated results falls below a certain threshold.
• Behavioral App: This application is based on the gravity
of the misbehavior event. According to the gravity of the misbehavior, the node is put in timeout and all the data it sends are reported to the MA. The gravity is deduced from the results of the basic plausibility checks.
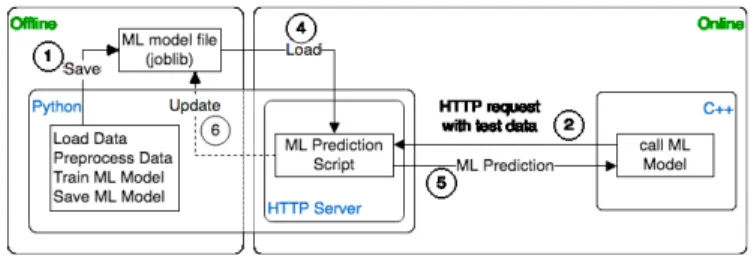
Fig. 4. Python-C++ interface for machine learning modeling
3) Python-C++ Interface for Machine Learning Modeling: One of the most used programming ecosystems for Machine Learning (ML) and Deep Learning (DL) is Python. We de-signed this part of the framework such that anyone could extend the framework with their own ML/DL models. We have developed an interface between Python and C++ parts of our framework. This interface allows any developer to implement their ML models in Python and let the core framework calls their models during simulations.
Figure 4 represents the Python-C++ interface design. The interface is designed around a typical ML model development process. As shown in Figure 4, the interface is divided into offline and online phases. All files are represented as separate modules in the figure. This means that an ML model is divided into two files. One file for each phase.
In the offline phase, a developer can design, train and save her ML model. We support scikit-learn [23] for ML modeling and the joblib library [24] for saving ML models. joblib is much more efficient in saving ML models that use NumPy [25] than Python’s built-in module pickle.
In the online phase, the ML model runs inside an HTTP server (PyMLServer) listening on a user-defined port. The simulation core (written in C++) calls the ML model (written in Python). As shown in Figure 4, the simulation core sends data to be tested against the ML model in an HTTP request. PyMLServer calls the ML prediction script which performs operations as follows:
• Load the data from HTTP request that needs to be processed for prediction.
• Load the ML model saved during offline phase. We use joblib again to load the ML model.
• Respond to the HTTP request with prediction from the
ML model.
• Optionally, the prediction script could update the ML model and save it back to the loaded model. Models that use back-propagation may need such functionality. Finally, simulation core reads the prediction output from the HTTP response to perform further investigation. Based on the previous interface we implemented the following techniques:
• Support Vector Machines (SVM) Classifier: A two-class SVM model was trained on features extracted from the plausibility checks similarly to [11] and as described in previous sections. This SVM classifies Genuine ve-hicles from Misbehaving ones with accuracy largely de-pendent on the scenario (Network, Density, Attacks, etc.). For extended results on supervised machine learning, we refer the reader to [11].
• Multi-Layer Perceptron (MLP) Classifier: An MLP
based neural network was trained on the same data as for SVM. We found the MLP’s accuracy is generally better than SVM. However, remember that the comparison of techniques is not the objective of this paper.
• Long Short-Term Memory (LSTM) Classifier: An
LSTM was also trained on the same data as for SVM. LSTM is part of the Recurrent Neural Network (RNN) family of ML algorithms adequate for the treatment of time dependent data. LSTM’s accuracy was generally the best out of the tested algorithms. However, it is also the slowest algorithms to compute.
D. Reporting
One important goal of the local MBD is to send a report to a central MA for post-processing. In this framework, the MBD algorithm could decide to generate a misbehavior report. The reports are pushed to a global MA via HTTP connection. Additionally, the reports can be collected in json or xml format in a local folder.
We propose a misbehavior report inspired by the protocol described in [26]. The report is composed of three containers: Header Container, Source Container and Evidence Container. The Header Container contains the basic information that should be included in every report: generation time, sender id, reported id and report type. The Source Container consists of the results of the plausibility and consistency checks on the reported beacon, granted that a vehicle is reported only after a received beacon shows some implausibilities. The Evidence Container should help the MA in its investigation and to support its conclusion. The Evidence Container can be composed of messages from the reported or the reporter or any neighboring vehicles if deemed helpful. It could also include some other data like a Local Dynamic Map (LDM), or direct sensor data from the reporter. The Evidence required by the MA is further detailed in [26].
The report format is however not yet standardized and is still a subject of scientific research. For this reason, we deemed
useful to provide multiple formats of the misbehavior report to facilitate further investigation and testing. The following versions are implemented in the framework:
• Base Report: This format includes only the Header Container and the Source Container with no evidence.
• Beacon Report: This version includes a base report and
the reported beacon in the Evidence Container.
• Evidence Report: This version contains a more complete
Evidence Containerdepending on the type of plausibility checks failure. For example, if the vehicle failed the Speed Consistency, we include both inconsistent beacons as evidence.
In the current state of the framework, every message flagged as misbehaving is reported. However, not every mes-sage should be reported individually. This would generate a significant network overhead especially when the vehicle is misbehaving because of a faulty component in its system. Consequently, the report format allows for omitted reports, which means that the vehicle is not constantly reported for the same behavior. Instead of that, the local vehicle refrains from reporting the same behavior after a certain time while collecting evidence. The evidence is then sent to the MA in a single report. This protocol assumes an intelligent MA that prioritizes the content of the received reports instead of their number.
E. Global MisBehavior Detection
The Misbehavior Authority (MA) is the global entity that receives the reports sent by the vehicles. The MA should then decide on the suitable reaction to make. We defined three main components of the MA:
• Collection and Format: The collected report is added
to a database. This action would enable to access reports using certain criteria. For example, we can get all the reports accusing a certain pseudonym or all the reports from a certain region. Those requests could be helpful in the analysis phase. We also have a filtering system, if enabled, that could aggregate all reports signaling the same implausibly (e.g. sets of two messages with a speed inconsistency).
• Analysis and Decision: The MA analyzes the reports and outputs the correct level of reaction. We have im-plemented a simple non intelligent method that has a threshold on the number of reports for every reaction level. The number of reports required to reach every level is modifiable. We set the output as levels so it would be compatible with our reaction mechanism. However, other outputs could be developed. Please note that this component will evolve into a more complex element in future versions of the framework.
• Reaction: The misbehavior reaction is still a widely debated subject. We propose a level-based solution with 5 levels of reaction:
– level 0: no reaction
– level 1: a warning message is sent to the vehicle – level 2: a warning point is deducted from the vehicle’s
score
– level 3: passive revocation where the vehicle cannot request more certificates
– level 4: active revocation where the current certificates of the vehicle are revoked.
Currently, the reactions do not cause a change in the behavior of the vehicle, however we expect to have a more intelligent system where the vehicle would change its behavior according to the reaction level (e.g. a vehicle with a faulty sensor would re-calibrate upon a warning from the MA).
F. Misbehavior Mechanisms
In order to assess the quality of different detection methods we need to generate misbehavior into the system. For this reason, we implemented two categories of misbehavior: Faulty behavior and Attacks. Faulty behavior acts on one sensor data, and Attacks are more elaborate schemes. The framework inserts a predefined percentage of misbehaving vehicles. These vehicles could all present one type of misbehavior or could mix multiple types. Details of all the implemented misbehavior mechanisms are presented below.
1) Faulty Behavior: Each vehicle should include an on-board treatment of the data to ensure plausibility before transmission. However, this preventive system could possibly lack some use cases and is prone to failure, especially in the case of budget vehicles. Here, we consider the case where such an on-board data pre-treatment system fails. We extracted from the literature a set of possible faulty behaviors [27].The following set was implemented in the framework:
• Fixed Position: The vehicle broadcasts the same position
(X,Y) each beacon.
• Fixed Position Offset: The vehicle broadcasts its real
position with a fixed offset (∆X,∆Y).
• Random Position: The vehicle broadcasts a random
position from the playground.
• Random Position Offset: The vehicle broadcasts its real
position with a random offset limited to a max value (∆(0 7→ Xmax),∆(0 7→ Ymax).
• Fixed Speed: The vehicle broadcasts the same speed (Vx)
each beacon.
• Fixed Speed Offset: The vehicle broadcasts its real speed with a fixed offset (∆VX).
• Random Speed: The vehicle broadcasts a random speed with a upper limit (0 7→ Vmax) .
• Random Speed Offset: The vehicle broadcasts its real
speed with a random offset limited to a max value (∆(0 7→ Vmax)).
• Stale Messages: The vehicle broadcasts its real
informa-tion after adding a predefined delay (∆t).
2) Attacks: Our attack schemes vary in complexity. The following list details what is currently implemented in our framework:
• DoS: In order to deny the other vehicles access to the network, the attacking vehicle increases the beaconing frequency by a certain factor. In our implementation the vehicle could also choose to send valid message or random data. The attacker could also choose to more
frequently change and alternate between his pre-loaded pseudonyms in order to avoid detection.
• Disruptive: This attack aims to disrupt the system by
flooding the network with old beacons data. The attacker chooses a random beacon from the received history and replays its data. Simultaneously, the attacker is able to increase the beaconing frequency to maximize the effect. It is worth noting that the data was originally generated by genuine vehicles, thus making it plausible on some levels. As a result, this attack severely deteriorates the quality of the C-ITS. Similarly to the DoS Attack, the attacker could also choose to alternate between his pre-loaded pseudonyms.
• Data Replay: The attacker chooses a target and replays
its data with a certain delay. Consequently, it could seem to an observer that there are two vehicles following each other. The attacker could chose to change his pseudonym when changing the target vehicle to avoid detection.
• Eventual Stop: After a certain random delay, the attacker
stops updating the beacon position and sets the speed to zero, thus simulating a sudden stop.
• Congestion Sybil: One type of Sybil attack consists of generating ghost vehicles. To this end, the following actions are performed:
– The position, speed and heading of the ghost vehicles are calculated according to the data of the attacking vehicle or a chosen target vehicle.
– A list of pseudonyms is generated and maintained, one pseudonym per ghost vehicle.
– The beaconing frequency of the attacker is increased according to the number of ghost vehicles.
– The ghost vehicles beacons are multiplexed such that every vehicle is sending one beacon per cycle. This attack demonstrates the ability to use the framework to (i) manipulate pseudonyms, (ii) increase the beacon frequency on-the-fly and (iii) intelligently calculate the data to serve a specific objective.
• MA Stress: This attack does not target local vehicles. Instead, it targets the global entity (i.e. the MA) by send-ing a large number of fake reports. The reports contain the identities of the attacker’s neighboring vehicles. The attacker could choose to change its identity for every report. The attacker could also increase the frequency by which the reports are sent to the MA.
G. Privacy
The use of pseudonyms have been included in the IEEE and ETSI standards [16], [19], [28]. However, when and how a pseudonym change happens is still a research challenge. Sci-entific studies have suggested multiple methods to determine the location and rate of change of pseudonyms [29].
Node-centric MBD mechanisms rely on a consistent identity of the treated vehicles. This approach is greatly affected by privacy-preserving mechanisms based on pseudonyms. For this reason, we have implemented the following Pseudonym Change Policies (PCP) in our framework:
TABLE I
DEFINITION OFPOSITIVE/ NEGATIVE
Misbehaving Genuine
Detected True Positive (TP) False Positive (FP) Undetected False Negative (FN) True Negative (TN)
• Periodical: The vehicle changes its pseudonym after a predefined period of time.
• Distance: The vehicle changes its pseudonym after pre-defined number of kilometers.
• Disposable: The pseudonym is used for a fixed number
of messages (including beacons and warnings).
• Random: The pseudonym has predefined chance of
change at every sent message.
H. Evaluation and Visualization
In a given scenario, a vehicle transmitting messages could be misbehaving or genuine, and a local detection mechanism could classify messages as misbehaving or genuine. Therefore, as illustrated in Table I, the evaluation of detection mecha-nisms starts by deciding what is true positive / negative, and false positive / negative.
The Recall (1) measures the proportion of correctly identi-fied misbehaving messages out of all received misbehaving messages. The P recision (2) measures the proportion of messages correctly flagged as misbehaving out of all flagged messages. The F1score (3) is the harmonic mean of Recall
and P recision. It could be used as a single metric to evaluate the system’s performance if we attribute the same importance to the Recall and P recision. If needed, we can attribute more weight to one metric by calculating an Fβscore.
This metric could be interesting since one could argue that Recall is more important than P recision in some cases. The Accuracy (ACC) (4) is the rate of positive agreement, which in our case refers to the ratio of true detection in the system. The Bookmaker Informedness (BM) (5) characterizes the probability of an informed decision. It shows how much the decision of this system is better than a random guess. The M arkedness (6) is the probability that the detection is ascertained by the classification as opposed to by chance . The Matthews Correlation Coefficient (MCC) (5) is the geometric mean of the Informedness and the Markedness. It is especially useful when the measured classes are of very different sizes, which is often the case with C-ITS attackers. Cohen’s kappa (κ) (8) is a measure of the positive agreement, similar to the Accuracy, but where we substract the agreement by chance.
Recall = T P T P + F N (1) P recision = T P T P + F P (2) F1score = 2 × Recall × P recision Recall + P recision (3) ACC = T P + T N T P + F P + T N + F N (4)
BM = T P T P + F N + T N T N + F P − 1 (5) M K = T P T P + F P + T N T N + F N − 1 (6) M CC =
√
T P ×T N +F P ×F N (T P +F P )(T P +F N )(T N +F P )(T N +F N ) (7) κ = ACC −(T P + F P ) × (T P + T N ) + (T N + F P ) × (T N + F N ) (T N + T P + F P + F N )2 1 −(T P + F P ) × (T P + T N ) + (T N + F P ) × (T N + F N ) (T N + T P + F P + F N )2 (8)One of the goals of our framework is to facilitate the evaluation of any detection mechanisms or any changes that could affect the detection rate. In order to achieve that, the simulator writes a snapshot of the current state of the running mechanisms at every time interval. Then, a script parses the data, calculates, and plots the aforementioned evalua-tion metrics in real-time. To further facilitate the evaluaevalua-tion and comparison of mechanisms, the simulator and the script support running two simultaneous mechanisms on the same system. Figure 5 shows a real-time comparison between the Threshold Apprunning on binary basic plausibility checks and the Behavioral App running on the Error-Tolerant plausibility module.
Fig. 5. F2MD GUI: Real-Time Evaluation Metrics Plots (Data Points, TP, FP, Density, Recall, Precision, Accuracy, F1score, BM, MK, MCC, κ)
However, the visualization is not limited to the detection results. The attacks and detection system are also visualized in SUMO’s GUI. The simulator uses SUMO’s Traffic Control
Fig. 6. Sumo GUI with F2MD Vehicle Color Profiles
Interface (TraCI) [30] to color the vehicles according to the intended role as specified in Figure 6.
Finally, since the MA is implemented as an HTTP server, we provide a web interface. The web interface runs in real time and serves as a display of different metrics and evaluations on the current state of the MA (Figure 7). We currently display three metrics:
• Cumulative and instantaneous prediction accuracy,
• Number of received reports per pseudonym for some of the most relevant identifiers,
• Radar chart of the cumulative percentage of the issued
reactions.
Fig. 7. Misbehavior Authority Web Interface
V. EXAMPLES
In order to demonstrate the capabilities of the framework, we run multiple example scenarios. Each example is based on showcasing the capabilities of a different module of the frame-work. In the following scenarios we use our benchmarking network described in Section IV-B. We introduce misbehaving entities with an density of 0.1. Each misbehaving vehicle introduced to the system chooses its type of attack as detailed in Section IV-F2. The following results are reproducible using the implementation and scenarios provided on our Github [31].
-0.05 0 0.05 0.1 0.15 0.2 0.25 0.3 0.35 0.4 0.45 0.5 0.55 0.6 0.65 0.7 0.75 0.8 0.85 0.9 0.95 1
Recall Precision F1Score Accuracy BM MK MCC K ET 0.1 ET 0.2 ET 0.3 ET 0.4 ET 0.5 ET 0.6 ET 0.7 ET 0.8 ET 0.9 Binary Misbehavior Types Evaluation Metrics
Rec Pre F1s Acc BM MK MCC K
ET 0.1 0.36 1.00 0.53 0.89 0.36 0.88 0.56 0.35 ET 0.2 0.39 0.99 0.56 0.90 0.39 0.88 0.59 0.37 ET 0.3 0.42 0.98 0.59 0.90 0.42 0.88 0.61 0.40 ET 0.4 0.47 0.96 0.63 0.91 0.46 0.86 0.63 0.42 ET 0.5 0.49 0.91 0.64 0.91 0.48 0.82 0.63 0.42 ET 0.6 0.52 0.85 0.64 0.90 0.50 0.76 0.62 0.40 ET 0.7 0.61 0.62 0.62 0.87 0.54 0.54 0.54 0.21 ET 0.8 0.76 0.34 0.47 0.72 0.47 0.28 0.36 -0.35 ET 0.9 0.96 0.18 0.30 0.24 0.07 0.11 0.08 -0.08 Binary 0.48 0.92 0.63 0.91 0.47 0.82 0.62 0.41
Fig. 8. Variable threshold evaluation plot
A. Plausibility detectors example
As discussed earlier, we implemented two versions of the detectors. The legacy version outputs a binary value while the ET version assigns a factor in uncertain scenarios. The plausibility factor is a score assigned to the each plausibility check done on the message. This score is calculated using the value and the error range advertised for each field in a certain message. The score varying between completely implausible (0) and definitely plausible (1).
To better understand the effect of this value, we run both versions of the detectors simultaneously coupled with a threshold-based detection application. We vary the threshold between 0.1 and 0.9. As we can see in Figure 8, we can see a clear trade-off between precision and recall for the ET version of the detectors. This validates our hypothesis that the uncertainty factor quantifies the plausibility of a certain message.
The plausibility factor thus provides a more informative view of the implausible scenario. This could prove useful to an intelligent application trying to detect an attack. Therefore, for the same previous scenario, we trained an Multi-Layer Perceptron (MLP) to classify a single message plausibility check result. Table II shows that the ET model have better results than the Binary one.
However, this improvement comes at the cost of higher processing time. In fact the binary detectors are 8 times faster than their ET counterparts as shown in Table III.
B. Local application example
Next, we demonstrate the capabilities of the MBD applica-tions module. We tested all the applicaapplica-tions provided with our
TABLE II
COMPARINGETANDBINARY DETECTORS USING ANMLP
Misbehavior Types
Evaluation Metrics
Rec Pre F1s Acc BM MK MCC κ Binary 0.48 0.92 0.63 0.91 0.48 0.83 0.63 0.42 ET 0.64 0.93 0.76 0.93 0.63 0.86 0.73 0.56 ∆ +31% +1% +19% +3% +32% +4% +17% +32%
TABLE III
PROCESSING TIME OFMLPUSINGBINARY ORET Detector Version Binary ET Time (µs) 17.117 140.581
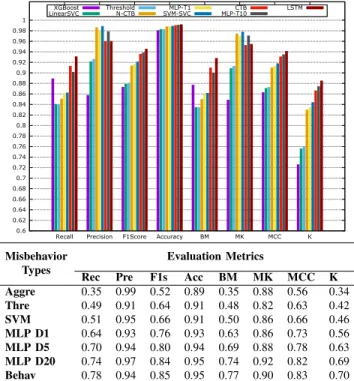
framework. Our fixed algorithm apps: Threshold, Aggregation and Behavioral Analysis. Our machine learning models: SVM and MLP. The results of the plausibility checks are used as the input features for the learning models. We also created models with multiple plausibility check results as features. We call the number of checks used to create the features: the depthof the model. We show here models trained with a depth of 5 and 20 messages, marked by D5 and D20 accordingly. Figure 9 shows the evaluation metrics of the different detection scenarios. These metrics are collected from plots of the GUI described in Section IV-H.
Although the detection rate is important, the local applica-tion has to also be light on resources. Arguably, the main goal of a local detection application is to alert a global entity. This means a trade-off of lower detection rate for faster processing could be considered. For this reason we also provide the mean processing time of every application. The application processing time for the previous scenarios is shown in Ta-ble IV. Looking at the evaluation metrics and the processing
0.6 0.62 0.64 0.66 0.68 0.7 0.72 0.74 0.76 0.78 0.8 0.82 0.84 0.86 0.88 0.9 0.92 0.94 0.96 0.98 1
Recall Precision F1Score Accuracy BM MK MCC K XGBoost
LinearSVC ThresholdN-CTB SVM-SVCMLP-T1 MLP-T10CTB LSTM
Misbehavior Types
Evaluation Metrics
Rec Pre F1s Acc BM MK MCC K
Aggre 0.35 0.99 0.52 0.89 0.35 0.88 0.56 0.34 Thre 0.49 0.91 0.64 0.91 0.48 0.82 0.63 0.42 SVM 0.51 0.95 0.66 0.91 0.50 0.86 0.66 0.46 MLP D1 0.64 0.93 0.76 0.93 0.63 0.86 0.73 0.56 MLP D5 0.70 0.94 0.80 0.94 0.69 0.88 0.78 0.63 MLP D20 0.74 0.97 0.84 0.95 0.74 0.92 0.82 0.69 Behav 0.78 0.94 0.85 0.95 0.77 0.90 0.83 0.70
TABLE IV MEAN PROCESSING TIME
App Version Aggre Thre SVM MLP Behav Time (µs) 4.86 1.13 373.1 233.7 1.99
time, one could conclude that the Behavioral Analysis app is the best choice overall. This application assigns a trust value for every pseudonym and updates this value over time. Theoretically, this approach would be strongly affected by changing pseudonyms. However, the scenarios tested here have the pseudonym change disabled.
C. Attacks example
Until now, our evaluations were based on an even mix of misbehavior types. However, the detection rate is strongly dependent on the type of misbehavior. To demonstrate this fact, we tested the ability of the MLP, trained with a depth of 20 messages, to detect individual attacks. Figure 10 shows that the stale messages misbehavior type is somewhat hard to detect with our detectors. This result is in line with our expectations since the messages transmitted here are plausible and just sent a few seconds later. Therefore the stale messages do not have many implausible features. One should note that the SAE J2945/1 [15] specifies that BSM generated 30 seconds in the past (and in the future) pass time relevance check. On the other hand, we see that the Disruptive attack is the easiest to detect. That is due to the fact that this type of attack replays a mass of messages without data consistency. Consequently, there is a large amount of implausible features that were easily fingerprinted by the neutral network.
-0.05 0 0.05 0.1 0.15 0.2 0.25 0.3 0.35 0.4 0.45 0.5 0.55 0.6 0.65 0.7 0.75 0.8 0.85 0.9 0.95 1
Recall Precision F1Score Accuracy BM MK MCC K StaleMessages
DataReplay ConstPosOffsetSybil ConstSpeedDisruptive
Misbehavior Types
Evaluation Metrics
Rec Pre F1s Acc BM MK MCC κ
StaleMessages 0.05 0.46 0.09 0.90 0.04 0.36 0.13 -0.01 DataReplay 0.38 0.79 0.51 0.93 0.37 0.73 0.52 0.27 Sybil 0.65 0.96 0.77 0.85 0.63 0.76 0.69 0.54 ConstPosOffset 0.74 0.93 0.82 0.97 0.73 0.90 0.81 0.66 ConstSpeed 0.88 0.94 0.91 0.98 0.87 0.92 0.90 0.81 Disruptive 0.94 0.93 0.93 0.99 0.93 0.92 0.93 0.85
Fig. 10. Detection evaluation by attack
D. Reporting and global detection example
Finally, we demonstrate the reporting and the global detec-tion of the framework. We start by examining the different
TABLE V
AVERAGE REPORT SIZE COMPARISON
Report Type
Report Size (Bytes) Uncompressed lzma Compressed
Base 512.45 313.27
Beacon 1090.00 479.73
Evidence 1979.84 545.89
type of reports. Our different report formats have different containers and should vary in size. Using the same scenario as in Section V-C, we measure the size of the reports transmitted to the MA in JSON. This measurement is done for each of the formats described in Section IV-D. Table V shows the average sizes of the different reports. We can see that the sizes are consistent with the reports format, and the differences are smaller when the information is compressed. Please note that the sizes are only used for comparison purposes, however, these are not to scale with a real eventual report. All C-ITS messages of European Telecommunications Standards Institute (ETSI) and Institute of Electrical and Electronics Engineers (IEEE) have a security header a signature and multiple other layer that are not included here [13], [17].
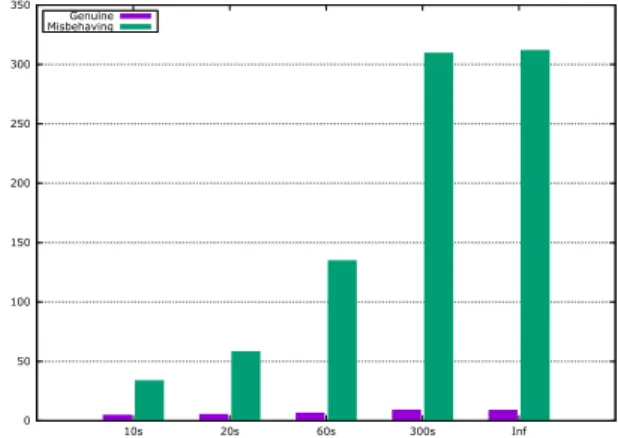
for the global detection, our current simple MA is still based only on the number of received reports for a certain pseudonym. Consequently, a PCP would dramatically affect the result. To show this effect, we enable a periodical PCP. We then simulate the same scenario with multiple pseudonym change periods. Figure 11 shows the average number of reports received by the MA for genuine and misbehaving nodes per pseudonym. We can see that the number of reports is significantly affected by more frequent pseudonym change. Indeed, the MA does not receive enough reports with the same reported ID, certainly affecting the detection quality.
In order to mitigate this effect, the MA can analyze the contents of the report. A report with Evidence Container is advantageous for this process. Additionally, currently proposed reporting protocols do not send a report for each message [26]. Instead, to reduce overhead, the vehicle collects evidence and then sends a more complete report. This process would make the global detection based on the number of reports obsolete. The need for an intelligent MA is therefore paramount.
0 50 100 150 200 250 300 350 10s 20s 60s 300s Inf Genuine Misbehaving
Fig. 11. Average number of reports by pseudonym received by the MA for different pseudonym change period
VI. CONCLUSION
Cooperative Intelligent Transport Systems are susceptible to false data injection attacks that could jeopardize road users safety. In this paper, we proposed a simulation framework and source code called F2MD, which enables the research
community to develop, test, and compare MBD algorithms. We implemented in the framework (i) a comprehensive list of attacks, (ii) a extensive set of basic and advanced detection algorithms, (iii) a Python/C++ bridge to allow import of artificial intelligence algorithms, (iv) basic Pseudonym Change Policies, (v) a visualization tool to analyze real-time perfor-mance of the MBD system, and (vi) a Misbehavior Authority and Misbehavior Report formats. We demonstrated its full capabilities by running example scenarios and discussed their results.
As future work, we are planning to expand the pseudonym change strategies (e.g. addition of a silent period [32]), attacks and detectors. The framework will also be extended with a intelligent Misbehavior Authority in order to evaluate global misbehavior investigation (and the effects of misbehavior reporting policies and its report format), and detection perfor-mance at the MA. We will also extend the attacker model by considering colluding attackers and false misbehavior report injection. The addition of a Public Key Infrastructure module is also considered.
VII. ACKNOWLEDGMENTS
This research work has been carried out in the framework of the Techno logical Research Institute SystemX, and therefore granted with public funds within the scope of the French Program Investissements d’avenir.
REFERENCES
[1] SAE International, “SAE J3016 201806: Taxonomy and Definitions for Terms Related to Driving Automation Systems for On-Road Motor Vehicles,” Standard, June 2018.
[2] J. O’Hara, “Wyoming CV Pilot,” https://goo.gl/FqvJHn.
[3] UMTRI, “UMTRI Connected Vehicle Dataset,” https://github.com/ caoc-scar/ConnectedVehicleDocs.
[4] C. Sommer, R. German, and F. Dressler, “Bidirectionally coupled network and road traffic simulation for improved ivc analysis,” IEEE Transactions on Mobile Computing, vol. 10, no. 1, pp. 3–15, Jan 2011.
[5] R. W. Van der Heijden, T. Lukaseder, and F. Kargl, “Veremi: a dataset for comparable evaluation of misbehavior detection in vanets,” in Proceedings of the 14th EAI International Conference on Security and Privacy in Communication Networks, Aug 2018.
[6] R. W. van der Heijden, “VeReMi Dataset,” https://github.com/VeReMi-dataset/VeReMi.
[7] R. W. van der Heijden, S. Dietzel, T. Leinmuller, and F. Kargl, “Survey on misbehavior detection in cooperative intelligent transportation systems,” IEEE Communications Surveys & Tutorials, 2018.
[8] J. Kamel, A. Kaiser, I. Jemaa, P. Cincilla, and P. Urien, “Feasibility study of misbehavior detection mechanisms in cooperative intelligent transport systems (c-its),” in 2018 IEEE 87th Vehicular Technology Conference: VTC2018-Spring, 2018.
[9] M. Sun, M. Li, and R. Gerdes, “A data trust framework for vanets enabling false data detection and secure vehicle tracking,” in IEEE Conference on Communications and Network Security (CNS), 2017, pp. 1–9.
[10] C. Zhang, K. Chen, X. Zeng, and X. Xue, “Misbehavior detection based on support vector machine and dempster-shafer theory of evidence in vanets,” IEEE Access, vol. 6, pp. 59 860–59 870, 2018.
[11] S. So, P. Sharma, and J. Petit, “Integrating Plausibility Checks and Machine Learning for Misbehavior Detection in VANET,” in IEEE 17th International Conference on Machine Learning and Applications (ICMLA), 2018.
[12] L. Codeca, R. Frank, and T. Engel, “Luxembourg sumo traffic (lust) scenario: 24 hours of mobility for vehicular networking research,” in 2015 IEEE Vehicular Networking Conference (VNC), Dec 2015, pp. 1–8. [13] SAE International, “SAE J2735 201603, Dedicated Short Range
Com-munications (DSRC) Message Set Dictionary,” Standard, 2016. [14] ETSI, “ETSI EN 302 637-2 V1.4.0 (2018-08): Intelligent Transport
Systems (ITS); Vehicular Communications; Basic Set of Applications; Part 2: Specification of Cooperative Awareness Basic Service,” Standard, August 2018.
[15] SAE International, “SAE J2945/1, On-Board System Requirements for V2V Safety Communications,” Standard, 2016.
[16] IEEE, “IEEE standard for wireless access in vehicular environments–security services for applications and management messages -amendment 1,” IEEE Std 1609.2a-2017 (Amendment to IEEE Std 1609.2-2016), pp. 1–123, Oct 2017.
[17] ETSI TC ITS, “ETSI TS 103 097 V1.3.1 - Intelligent Transport Systems (ITS); Security; Security Header and Certificate Formats,” Standard, TC ITS, October 2017.
[18] B. Brecht, D. Therriault, A. Weimerskirch, W. Whyte, V. Kumar, T. Hehn, and R. Goudy, “A security credential management system for v2x communications,” IEEE Transactions on Intelligent Transportation Systems, no. 99, pp. 1–22, 2018.
[19] ETSI, “ETSI TR 103 415 V1.1.1: Intelligent Transport Systems (ITS); Security; Pre-standardization study on pseudonym change management,” April 2018.
[20] “Framework For Misbehavior Detection (F2MD),” 2019, [On-line; accessed 28-February-2019]. [Online]. Available: https://www.irt-systemx.fr/F2MD/
[21] J. Kamel, A. Kaiser, I. Ben Jemaa, P. Cincilla, and P. Urien, “CaTch: a confidence range tolerant misbehavior detection approach,” in 2019 IEEE Wireless Communications and Networking Conference (WCNC) (IEEE WCNC 2019), Marrakech, Morocco, Apr. 2019.
[22] A. Jaeger, N. Bißmeyer, H. Stubing, and S. A. Huss, “A novel framework for efficient mobility data verification in vehicular ad-hoc networks,” International Journal of Intelligent Transportation Systems Research, vol. 10, no. 1, pp. 11–21, Jan 2012.
[23] F. Pedregosa, G. Varoquaux, A. Gramfort, V. Michel, B. Thirion, O. Grisel, M. Blondel, P. Prettenhofer, R. Weiss, V. Dubourg, J. Vanderplas, A. Passos, D. Cournapeau, M. Brucher, M. Perrot, and E. Duchesnay, “Scikit-learn: Machine learning in Python,” Journal of Machine Learning Research, vol. 12, pp. 2825–2830, 2011.
[24] G. Varoquaux, “joblib documentation,” https://media.readthedocs.org/ pdf/joblib/latest/joblib.pdf, 2018.
[25] T. E. Oliphant, “A guide to numpy,” http://www.numpy.org/, 2006. [26] J. Kamel, I. B. Jemaa, A. Kaiser, and P. Urien, “Misbehavior Reporting
Protocol for C-ITS,” in 2018 IEEE Vehicular Networking Conference (VNC), Taipei, Taiwan, Dec. 2018.
[27] J. Petit and R. Ansari, “V2X Validation Tool,” https://bitbucket.org/ onboardsecurity/dsrcvt, BlackHat 2018.
[28] ETSI, “ETSI TS 102 940 v1.3.1: Intelligent Transport Systems (ITS); Security; ITS communications security architecture and security manage-ment,” April 2018.
[29] J. Petit, F. Schaub, M. Feiri, and F. Kargl, “Pseudonym schemes in vehicular networks: A survey,” IEEE communications surveys & tutorials, vol. 17, no. 1, pp. 228–255, 2015.
[30] A. Wegener, M. Piorkowski, M. Raya, H. Hellbr ´ uck, S. Fischer, and J.-P. Hubaux, “Traci: An interface for coupling road traffic and network simulators,” in Proceedings of the 11th Communications and Networking Simulation Symposium, ser. CNS ’08. New York, NY, USA: ACM, 2008, pp. 155–163.
[31] J. Kamel, “F2MD Github Repository,” https://github.com/josephkamel/ F2MD, 2019.
[32] W. Xin, H. M. Moonam, J. Petit, and W. Whyte, “Towards a balance between privacy and safety: Microsimulation framework for assess-ing silence-based pseudonym-change schemes,” Transportation Research Record, vol. 2673, no. 2, pp. 71–84.
Joseph Kamel is PhD candidate and researcher within T´el´ecom ParisTech (The Information Pro-cessing and Communication Laboratory) and Insti-tute for Technological Research SystemX. Currently, he’s working on Intelligent Transport System (ITS) Security in the Secure Cooperative Autonomous (SCA) project. His research focuses mainly on the cybersecurity of connected vehicles, in particular the detection of misbehavior in the Cooperative-ITS. Joseph holds a Master’s Degree in Cyber-Physical Social Systems and a Master’s Degree in Science and Executive Engineering from the ´Ecole des Mines de Saint- ´Etienne, France.
Mohammad ”Raashid” Ansari is a Senior Re-search Engineer at Qualcomm Technologies Inc., where he performs research in systems security. His current research focus is on developing misbehavior protection system for connected vehicles. He builds proof-of-concepts to analyze network security mech-anisms for connected vehicles. He presented hacking tools for connected vehicles at BlackHat in 2018 and DARPA SDR Hackfest in 2017. Raashid holds a Master of Science in Electrical Engineering from the University of New Hampshire, USA. His thesis focused on security of in-vehicle networks.
Dr. Jonathan Petit is a Principal Engineer at Qual-comm Technologies, Inc., where he leads research in systems security. Especially, his research focuses on connected and automated vehicles to design a com-prehensive misbehavior protection system. In 2013, Dr. Petit was the first to publish on cybersecurity of automated vehicles, and then, in 2015 to perform attacks on sensors. Dr. Petit hold a PhD in Computer Sciences from the University Paul Sabatier Toulouse 3, France.
Dr. Arnaud Kaiser obtained his PhD in Computer Science from the University of Paris 13 in 2011. He then joined the Communicating Systems Laboratory at the Atomic Energy Commission, France, as a research engineer until 2014. He worked on IPv6 vehicular networks and energy-efficiency in IPv6 home networks. He then joined the Technological Research Institute SYSTEMX, France, where he worked as a research engineer in cyber-security for Cooperative Intelligent Transport Systems (C-ITS). Since September 2018, he is the project manager of the Secure Cooperative Autonomous systems (SCA) research project, which focus on misbehavior detection for C-ITS. Arnaud supervises PhD students who are working on cyber-security and privacy for C-ITS. He published his works in major IEEE conferences and journals and is actively involved in the community as a reviewer for many conferences and journals. He also contributes to ETSI standardization activities related to C-ITS.
Dr. Ines Ben Jemaa is a research engineer at SystemX since September 2016. She received a Ph.D degree from Mines ParisTech and INRIA in December 2014, in vehicular communications. Be-fore joining SystemX, she worked as a post-doc in IFSTTAR institute and as a lecturer at the University of Versailles Saint-Quentin-en-Yvelines. Ines Ben Jemaa is a technical program committee member of several international conferences and workshops. Her main field of interest include routing protocols for VANETs, multicast communications, security and privacy and IoT protocols.
Pascal Urien is full professor at Telecom Paris. He graduated from Ecole Centrale de Lyon, (1980) and received a PHD in computer science. His main research interests include cyber security and secure elements, especially for distributed computing archi-tectures. He holds fifteen patents and more than one hundred publications in these domains.