HAL Id: hal-01845229
https://hal.archives-ouvertes.fr/hal-01845229
Submitted on 20 Jul 2018HAL is a multi-disciplinary open access
archive for the deposit and dissemination of sci-entific research documents, whether they are pub-lished or not. The documents may come from teaching and research institutions in France or abroad, or from public or private research centers.
L’archive ouverte pluridisciplinaire HAL, est destinée au dépôt et à la diffusion de documents scientifiques de niveau recherche, publiés ou non, émanant des établissements d’enseignement et de recherche français ou étrangers, des laboratoires publics ou privés.
Channels load measurement in wifi networks
Danielle Saliba, Rodrigue Imad, Sébastien Houcke
To cite this version:
Danielle Saliba, Rodrigue Imad, Sébastien Houcke. Channels load measurement in wifi networks. 24 th International Scientific Conference “ Sciences, Social Equity and Sustainable Development ” , Apr 2018, Balamand, Lebanon. �hal-01845229�
CHANNELS LOAD MEASUREMENT IN WiFi NETWORKS
Danielle SalibaSignal and Communication Department Mines Telecom Atlantique Institute Brest, France Rodrigue Imad Mechatronics Department University of Balamand El Koura, Lebanon Sebastien Houcke
Signal and Communication Department Mines Telecom Atlantique Institute Brest, France
Abstract: Wireless Local Area Networks (WLANs) are a potential contributor in the future heterogeneous networks (Het-Nets) of 5G Mobile
communication systems to ensure extended spectrum usage and higher data rates with better Quality of Service (QoS).
Significant network capacity gain can be achieved not only through aggressive reuse of spectrum across the multiple tiers in the network, but also through harnessing an additional spectrum in un-licensed bands by integrating WiFi in the network [1].
Different criteria should be investigated in order to allow both the WiFi APs and the end user to operate on the best suitable channel, where the basic one of those criteria is the “load” of the operating channels.
We propose in this paper a novel and accurate algorithm for the estimation of WiFi 802.11n physical channels load through the observation of the non-overlapped channels and estimating as a result the load of the entire physical channels.
Once the channels load is estimated using the proposed algorithm, the channel assignment based on the minimal load value is facilitated, thus providing faster response of an AP channel selection and faster end user connection for better Quality of Experience (QoE).
Keywords: WiFi Channel selection; 802.11n physical layer; Power Spectral Density; Heterogeneous Networks
I. INTRODUCTION
With the increasing demand for wireless data communication, the main key role focuses on effective bandwidth availability given that the spectrum is limited. This issue stimulates researchers and engineers to use the spectrum more efficiently.
One of the challenges faced in WiFi systems, is the channel assignment for the end user within a minimum response time and optimal spectrum usage from the suitable access point.
Many research studies were proposed to define the channel selection criteria in wireless networks based on different criteria such as resource allocation by taking into consideration the cooperative transmission strategy [3]; the power control of overlapping and non-overlapping channels [4]; multivariable algorithm using the probability of channel availability, the estimated channel time availability, the signal to noise plus interference ratio, and the bandwidth for dynamic channel selection treated in a computational technique [5]; the interference of clients individually [6]; the relationship of interference among clients [7]; the measurements on the Medium Access Control (MAC) layer [8]; or based on the parameters of scanning performance leading to a minimum latency [9].
The load criterion was mentioned in [10], [11], and [12] with different approaches. In [10] there is a significant variation in channel loads reported by the same station at different times, which may have significant effect on the selection of the channel with the minimum load.
In [11], a distributed least congested channel selection algorithm is proposed. It is based on the minimum interfering stations, as well as associated stations, by exchanging with neighbor APs, the beacon frame of the IEEE 802.11 standard with some additional field of channel load information.
In [12], the load criteria was measured by monitoring only a limited number of channels at each measurement time instead of monitoring all channels. It is based on the standard mechanism Clear Channel Assessment (CCA) which can
measure the fraction of time in which the channel is busy or idle. The proposed algorithm utilizes the Gaussian Process Regression (GPR) technique, used to estimate the instantaneous load of each channel by utilizing the previous load measurements. In this method, they monitor only a limited number of channels at each measurement time instead of monitoring all channels, and then determine the channel with the minimum traffic load without measuring all channels in the frequency band of interest.
In our paper, we propose a new algorithm that estimates the load of the WiFi 802.11n physical layer channels by taking the overlapping characteristic of the physical channels.
Our algorithm is applied on the physical layer of WLAN networks, before establishing any connection between the WiFi AP and the user station.
By applying our algorithm on a minimum of 3 non-overlapped channels, we can deduce the load of the remaining physical channels, and thus we can select the channel with the minimum load, and reduce the measurement time of channel load estimation.
Note that by the channel “load”, we mean the percentage of the channel usage in time (or busy time) with respect to the total channel measurement time (total busy and idle time). Having the load of each channel, facilitates the decision of the user for the channel selection based on the minimal load measurement. In this paper, we are simulating WiFi 802.11n in 2.4 GHz radio band with 20 MHz channel width, constituted basically of 14 overlapped channels spaced with 5MHz.
The channels overlapping is a characteristic used and analyzed in this paper as it will be explained in later sections. Under the same concept, the study presented in this paper could be extended to 5 GHz band with 20 MHz channel width (or with wider channel width e.g. 40 MHz in channel bonding), constituted basically of 42 overlapped channels spaced with 5MHz, with only 24 non-overlapping channels used in practical scenarios.
This paper is organized as follows. Section II describes 802.11n physical layer and channel assignment techniques. Our proposed algorithm along with the needed formulation is presented in Section III. In Section IV, the simulation results are shown. Potential use cases of the described method are given in Section V. Finally, Section VI concludes the paper.
II. SYSTEM MODEL
WLAN WiFi is based on IEEE 802.11 standards designed for indoor Wireless Local Area Networks for bandwidths of up to 100 MHz, at frequencies of 2 and 5 GHz [9].
The challenge lies when we have more nodes than the available orthogonal channels; therefore, additional numbers of available channels and optimization of the scanning duration for channels assignment are needed due to the existing network load.
In 2.4 GHz band, with 20 MHz channel bandwidth, 802.11n is basically constituted of 14 channels spaced with 5 MHz, where the adjacent channels overlap. In Europe, the first 11 channels remain available, and only three channels are non-overlapping in frequency at the same time [4] (e.g. channels
1, 5 and 9) as presented in figure 1.
Fig. 1. 802.11n physical overlapped channels
In 5 GHz band, with 20 MHz channel bandwidth, there are 42 channels spaced with 5 MHz with 24 non-overlapping channels used. Similarly, with 40 MHz channel bandwidth (channel bonding) there are only 12 non-overlapping channels used. Basically, the remaining overlapped channels are not considered usable, and typically are not selectable on most hardware in order not to end up with co-channel interference. So practically, to avoid this interference and maximize the throughput, only non-overlapped channels are used. However, in densely populated networks, and with the constraints of increasing spectrum demand for future WiFi and mobile communication technologies such as 5G, the number of available non-overlapped channels may not be enough, thus devices might have to share different channels (overlapped and non-overlapped) or to check for a new spectrum if it becomes available.
For these considerations, we are proposing an algorithm that calculates the load of the entire overlapped channels.
By observing only the distinct 3 non-overlapped channels (e.g. channels 1, 5 and 9), we can calculate the load of those distinct 3 channels and determine simultaneously the load of the remaining overlapped channels of the WiFi physical layer. Currently, in the channel selection principle of WiFi systems, two scanning modes could be used to assure a systematic channel assignment as mentioned before: passive and active scanning.
In the case of passive scanning, the client has to wait to receive a Beacon Frame from the Access Point (AP) [2]. A Beacon is transmitted from an AP and contains information about the AP along with a timing reference. The device then searches for a
network just by listening for beacons until it finds a suitable network to join. This procedure is similar for the 11 channels. With Active Scanning the device tries to locate an AP by transmitting Probe Request Frames, and waits for Probe Response from the AP [2]. The probe request frame can be either a directed or a broadcast probe request. The probe response frame from the AP is similar to the beacon frame. Based on the response from the AP, the client makes a decision about connecting to the AP.
While active scanning is a faster way to establish the contact, it consumes more battery power. In addition, the delay of the probe response from the AP is variable and depends on the load of the AP. If the WiFi terminal waits for the Probe Response for a significant period of time, it will affect the average of the total scan duration. However, if it waits for a short duration, the probability of finding the suitable AP is somehow decreased. 802.11n standard has defined two timers to assure the optimal control: MinChannelTime and MaxChannelTime.
If the Probe Response is not received between those two timers, the terminal assumes the channel is empty, thus no available AP exists.
In addition to the channel selection, the basic principle of channel access in 802.11 networks for carrier transmission is based on Carrier Sense Multiple Access/Collision Avoidance (CSMA/CA) MAC protocol, which acts as a measure to prevent collisions before they happen.
In CSMA/CA, as soon as a node receives a packet that is to be sent, it checks to make sure that the channel is clear (no other node is transmitting at the time) [13].
By applying our algorithm to estimate the minimum load of all the overlapped channels, allows to reduce the time of Access Point and channel discovery, and thus to optimize the values of different timers in WiFi networks (MinChannelTime, MaxChannelTime, backoff factor, etc.)
III. ALGORITHM PRINCIPLE
As previously explained, in order to estimate the load of WiFi physical channels, we analyze in this paper the physical layer of 802.11n which is constituted of 12 overlapped channels, where only 3 distinct channels are non-overlapping at the same time.
The adopted modulation technique in 802.11n is the Orthogonal Frequency Division Multiplexing (OFDM) which is not only a frequency multiplexing technique that mandates orthogonality among sub-channel signals, but also a special case of multi-carrier modulation. Consequently, OFDM can be regarded as either a multiplexing technique or a modulation scheme.
In an OFDM scheme, a large number of orthogonal, overlapping, narrow band sub channels or subcarriers, transmitted in parallel, divide the available transmission bandwidth into several orthogonal subcarriers, and each subcarrier is modulated with the modulation technique in the same bandwidth.
The separation of subcarriers is theoretically minimal so that there is a very compact spectral utilization [14].
As we mentioned earlier in this paper, our proposed algorithm is able to estimate the load of the 12 WiFi channels by performing 3 observations only, and this on the non-overlapped channels, i.e. channels 1, 5, and 9.
Noting that by observing channel 1, our algorithm is able to estimate the load of channel 1 as well as the load of the adjacent overlapped channels in this case channels 2, 3 and 4; similarly the observation of channel 5 will lead to estimate the load of channels 5, 6, 7 and 8 and the observation of channel 9 will lead to estimate the load of channels 9, 10, 11 and 12. For the simplification of calculations, and in order to avoid duplications, we are representing here the observation of channel 1 only. The observation of the other channels can be easily generalized by adopting the same concept.
Let us define Γ1(f) as the baseband spectrum of the signal
observed in channel 1 and S(f) the theoretical baseband Power Spectrum (PS) of the WiFi signal, which emits in a continuous way. According to CSMA/CA principle, Access Points (APs) are not transmitting their data continuously. Let
α
i denote thechannel load. It is defined as the percentage of the channel i usage in time (or busy time) in respect to the total channel measurement time as described previously.
The observed baseband spectrum of channel 1 with respect to all signals transmitted in the overlapped channels i is expressed as:
(
λ
i2(
f
)
. α
i)
. S
(
f
)
,
Where λi(f) is the signal attenuation due to the propagation
model of Channel i.
To simplify the presentation of the algorithm, we assume in the following section that the attenuation λi(f) = 1; i; f,∀ ∀
however the robustness of the proposed algorithm in the presence of a multipath fading channel is shown at the end of the simulation results section.
The observed baseband spectrum Γ1(f) can be easily expressed
in terms of the theoretical spectrum S(f), which is given by [15]:
S
(
f
)
=
σ
c 2M T
S∑
k=0 N −1(
sinc
[
(
f −k Δ
f)
M T
S])
2(1)
Where sinc(α) = sin(πα) / (πα) , M is the symbol length, σcVariance of the data symbols C(k;l) (complex value) modulated on the kth subcarrier of the lth symbol, k discrete frequency
index, N number of subcarriers, and Δf the frequency spacing
between subcarriers.
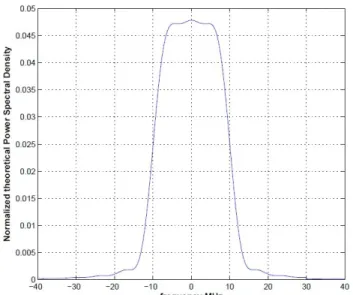
The theoretical Power Spectrum Density (PSD) is shown in figure 2. To assure the OFDM orthogonal relationship between subcarriers, Δf is set as W/N = 1/M, where W is the total
bandwidth of the signal, and Ts is the sampling interval
employed in the OFDM transmitter.
Fig. 2. Normalized theoratical Power Spectral Density of the 802.11n physical channel
To estimate Γi(f) the baseband spectrum of the signal observed
in channel i, we use Welch periodogram method
[16]. Mathematically, it is defined as the Fourier transform of the autocorrelation sequence of the time series. This method outlines the application of the Fast Fourier Transform algorithm to the estimation of the power spectra, which involves sectioning the record, taking modified periodograms of these sections, and averaging these modified periodograms [16] [17]. Let us now derive the expression of the power spectrum (PS) Γ1(f). Channels 1, 2, 3 and 4 contribute to this PS. We are
therefore able to estimate the channels load α1, α2, α3, and α4
from this observation. The contribution of channels 2, 3, and 4 in the PS of channel 1 is illustrated in figure 3. The observation of channel 1 can reflect the total load of channel 1 in addition to a part of the load of its related overlapped channels 2, 3 and 4, according to the overlapped partitions.
Fig. 3. Channel 1 Observation Model
For a bandwidth B of the channel, the total overlapping bandwidth between two consecutive channels is 3B/4. Based on this sectioning, we divide the theoretical PSD S(f) into 4
partitions S1, S2, S3, and S4 as per the below and presented in figure 4:
S1(f) = S(f) for f [-B/2;- B/4] and 0 elsewhereϵ
S2(f) = S(f) for f [-B/4; 0] and 0 elsewhereϵ
S3(f) = S(f) for f [0;B/4] and 0 elsewhereϵ
S4(f) = S(f) for f [B/4;B/2] and 0 elsewhereϵ
Fig. 4. Signal Sectioning – Theoretical PSD The complete theoretical PSD is the vector:
S=
[
S
1(
f ), S
2(
f ) , S
3(
f ) , S
4(
f )
]
of size (1x4).
Now let Γ1(f), which is the PS of the observed signal in channel
1, be divided similarly into 4 sections ɣ1, ɣ2, ɣ3, ɣ4 as shown in
figure 3 and calculated below:
ɣ1 (f) = Γ1(f) for f [-B/2;-B/4] and 0 elsewhereϵ
ɣ2 (f) = Γ1(f) for f [-B/4;0] and 0 elsewhereϵ
ɣ3 (f) = Γ1(f) for f [0;B/4] and 0 elsewhereϵ
ɣ4 (f) = Γ1(f) for f [B/4;B/2] and 0 elsewhere.ϵ
The complete PS is the vector Γ1 = [ɣ
1 (f); ɣ2 (f); ɣ3 (f); ɣ4 (f)]
of size (4x1). Based on figure 3, we need to calculate ɣ1, ɣ2, ɣ3,
and ɣ4 in terms of S(f) and αi (the load of channel i).
We can observe that, since channels 1, 2, 3 and 4 shifted to the baseband are duplicated from both sides while saving the same overlapping proportions, ɣ1 is constituted of 2 times the load of
channel 1 corresponding to section 1 (S1), 1 time the load of
channel 2 corresponding to section 2 (S2), 1 time the load of
channel 3 corresponding to section 3 (S3), and 1 time the load
of channel 4 corresponding to section 4 (S4). Therefore, we can
have the below equation:
γ
1(
f )=2. α
1. S
1(
f )+α
2. S
2(
f ) +α
3. S
3(
f )+α
4. S
4(
f )(2)
By applying the same concept for ɣ1, ɣ2, ɣ3, and ɣ4, we can
write the below equations:
γ
2(
f
)=2. α
1. S
2(
f
)
+
α
2.
(
S
1(
f
)+
S
3(
f
)
)
+
α
3. S
4(
f
)
γ
3(
f )=2. α
1. S
3(
f )+α
2.
(
S
2(
f )+S
4(
f )
)
+
α
3. S
1(
f )
γ
4(
f )=2. α
1. S
4(
f )+α
2. S
3(
f )+α
3. S
2(
f )+α
4. S
1(
f )
From the above equations, we can write the Power Spectrum of the observed signal in channel 1 as:
Γ
1(
f )=
[
S 0 0 0
0 S 0 0
0 0 S 0
0 0 0 S
]
.
[
2 0 0 0
0 1 0 0
0 0 1 0
0 0 0 1
0 1 0 0
2 0 0 0
0 1 0 0
0 0 1 0
0 0 1 0
0 1 0 0
2 0 0 0
0 1 0 0
0 0 0 1
0 0 1 0
0 1 0 0
2 0 0 0
]
.
[
α
1α
2α
3α
4]
(3)
Now let be equal to:
B
1=
[
S 0 0 0
0 S 0 0
0 0 S 0
0 0 0 S
]
.
[
2 0 0 0
0 1 0 0
0 0 1 0
0 0 0 1
0 1 0 0
2 0 0 0
0 1 0 0
0 0 1 0
0 0 1 0
0 1 0 0
2 0 0 0
0 1 0 0
0 0 0 1
0 0 1 0
0 1 0 0
2 0 0 0
]
,(4 )
thenΓ
1(
f )−B
1. α=0(5)
Where α = [α1, α2, α3, α4] denotes the load of channels 1, 2, 3
and 4.
Our aim is now to estimate α. Since the channel load has a non-negative value, non-negativity constraint should be applied on
the load estimations instead of simple non-square matrix inversion. In this paper, the non-negative Least Mean Square (LMS) calculation has been applied. It is derived based on a stochastic gradient descent approach [18] combined with a fixed-point iteration strategy that ensures convergence toward a solution to estimate vector α from channel 1.
We denote by
[
α
^
11, ^α
21, ^α
31, ^α
14]
the estimate of the load of channels 1, 2, 3 and 4 obtained from the observation of channel 1.
It is given by:
[
α
^
11^
α
21^
α
31^
α
4 1]
=
Argmin
α(
‖
Γ
1(
f )−B
1. α
‖
)
(
6)
We proceed similarly for the remaining 2 non overlapped channels 5 and 9 in order to recover the load of the 12 channels as per the below equations, noting by as the estimated baseband spectrum of the signal of channel j:
^
Γ
5(
f )=B
5.
[
^
α
25^
α
35^
α
4 5^
α
55^
α
65^
α
7 5^
α
85]
(
7)
And^
Γ
9(
f )=B
9.
[
^
α
69^
α
79^
α
89^
α
99^
α
109^
α
119^
α
129]
(8)
The real constant valued matrices of channels 5 and 9 observation are represented below:
B
5=
S .
[
0 0 0 2 0 0 0
0 0 1 0 1 0 0
0 1 0 0 0 1 0
1 0 0 0 0 0 1
0 0 1 0 1 0 0
0 0 0 2 0 0 0
0 0 1 0 1 0 0
0 1 0 0 0 1 0
0 1 0 0 0 1 0
0 0 1 0 1 0 0
0 0 0 2 0 0 0
0 0 1 0 1 0 0
1 0 0 0 0 0 1
0 1 0 0 0 1 0
0 0 1 0 1 0 0
0 0 0 2 0 0 0
]
(
9)
B
9=
S .
[
0 0 0 2 0 0 0
0 0 1 0 1 0 0
0 1 0 0 0 1 0
1 0 0 0 0 0 1
0 0 1 0 1 0 0
0 0 0 2 0 0 0
0 0 1 0 1 0 0
0 1 0 0 0 1 0
0 1 0 0 0 1 0
0 0 1 0 1 0 0
0 0 0 2 0 0 0
0 0 1 0 1 0 0
1 0 0 0 0 0 1
0 1 0 0 0 1 0
0 0 1 0 1 0 0
0 0 0 2 0 0 0
]
(
10)
IV. SIMULATIONRESULTS
A. Load Estimation in Error Free Channel
A simulation using Matlab has been developed to generate the physical signal of 802.11n based on the Orthogonal Frequency
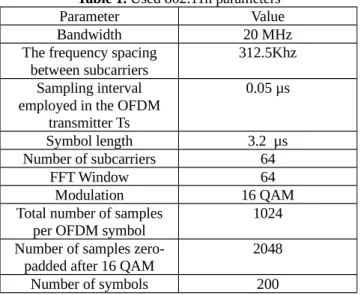
Division Multiplexing (OFDM) technique, according to WiFi 802.11n specific parameters shown in Table 1.
The length of the input signal used in our simulation is equivalent to the duration of 200 OFDM symbols in time (or 200 times the symbol duration (ts) = 3.2 µs), where the channel
load is expressed by non-zero symbols value equivalent to the time occupation of the signal (or busy time), and with null symbols value when the channel is empty (or idle time). The channels load predefined on the twelve channels is expressed as the percentage of the channel occupation time between 0% and 100% (or 0 and 1) assumed as following: 20%, 50%, 0%, 40%, 90%, 0%, 60%, 70%, 80%, 40%, 0%, 90%.
As explained previously, since the physical channels overlap with only 3 distinct channels, an observation of those 3 distinct channels entails to measure the load of the 12 channels. Therefore, we start first by observing channels 1, 5, and 9. By applying the method presented in the previous section, the load of channels 1, 2, 3, and 4 is estimated from the observation of channel 1, the load of channels 5, 6, 7 and 8 is estimated from the observation of channel 5, and the load of channels 9, 10, 11 and 12 is estimated from the observation of channel 9.
Fig. 5. Estimated Load versus the real load with 3 channels observation
As shown in figure 5, the estimated load is nearly the same comparing to the predefined load.
To check the effect of several additional channels observations, we have applied our algorithm on channels 1, 5, 6, 9, and 12 (optionally 5 channels observation in this case). The load of channels 1, 2, 3, and 4 is estimated from the observation of channel 1, the load of channel 5 is estimated from the observation of channel 5, the load of channels 6, 7 and 8 is estimated from the observation of channel 6, the load of channel 9 is estimated from the observation of channel 9 and the load of channels 10, 11 and 12 is estimated from the observation of channel 12.
A comparison between the 3 channels observation and the 5 channels observation is done, and the results in terms of the value of the Mean Squared Error (MSE), averaged through several repetitive random simulations, are shown in figure 6. As we can see, the MSE decreases with 5 channels observations; thus we can conclude that with additional number of channels observation, the algorithm accuracy level is increasing.
Fig. 6. Averaged Mean Squared Error of the estimated load versus the real load values in error free channel
B. Load Estimation in presence of a White Gaussian Noise
We assume now that the channel is affected by a White Gaussian Noise. In order to analyze the noise effect on the accuracy of our algorithm, same observations are used to reflect the estimated load versus the real one. The averaged MSE value is represented in respect to Signal to Noise Ratio (SNR) in figure 7.
We can notice that the precision of the algorithm is affected by a high noise level; however an acceptable error margin can still exist with a SNR around 3 dB.
Table 1. Used 802.11n parameters
Parameter Value
Bandwidth 20 MHz
The frequency spacing
between subcarriers 312.5Khz
Sampling interval employed in the OFDM
transmitter Ts 0.05 µs Symbol length 3.2 µs Number of subcarriers 64 FFT Window 64 Modulation 16 QAM
Total number of samples
per OFDM symbol 1024
Number of samples
zero-padded after 16 QAM 2048
Fig. 7. Averaged Mean Squared Error of the estimated load versus Signal to Noise ratio values.
C. Load Estimation with higher Symbol Length
We have analyzed the effect of signal length (i.e. the number of OFDM symbols) at the input in an error free channel.
Different realizations have been performed in order to reflect the averaged MSE with increased number of symbols duration 100 ts, 200 ts, 300 ts, 400 ts and 1000 ts as can be shown in
figure 8.
As we can notice, the averaged MSE value decreases with the highest number of OFDM symbols, since the precision of the estimated load increases for a higher message length where the observations results are more accurate.
Fig. 8. Averaged Mean Squared Error of the estimated load versus Signal Length in Error free channel
D. Improvement of Load Estimation by Averaged Method
Since the estimated load is based on a single channel observation, we have analyzed the effect of estimating the load of a channel throughout two channels observation at the same time, by averaging the calculation of the load according to the related partitions in each observation, as already shown in figure 3 for the observation of channel 1.
In this case, the load of channel 1 is estimated from the observation of channel 1, the load of channels 2, 3 and 4 is estimated from the observations of channel 1 and 5 as per the following equations:
α
1 1=
α
1 1α
21,5=
(
3
4
.α
2 1)
+
(
1
4
. α
2 5)
α
31,5=
(
1
2
.α
3 1)
+
(
1
2
. α
3 5)
α
41,5=
(
1
4
.α
4 1)
+
(
3
4
. α
4 5)
Similarly, the load of channel 5 is estimated from the observation of channel 5, the load of channels 6, 7, and 8 is estimated from the observations of channel 5 and 9, and finally the load of channels 9, 10, 11, and 12 is estimated from the observation of channel 9.
By comparing the precision of this averaged calculations method in respect to the direct calculations method, we can note that the averaged MSE of the 12 channels through multiple realizations is decreased as can be shown in figures 9 and 10 compared to the SNR and number of symbols respectively.
Fig. 9. Averaged Mean Squared Error of the estimated load in two calculation methods with 3 channels observation in respect to the SNR (dB)
Fig. 10. Averaged Mean Squared Error of the estimated load in two calculation methods with 3 channels observation in respect to the number of symbols
E. Load Estimation in presence of a Multipath Fading
Following the assumption that the attenuation is not affecting our calculations (λi(f) = 1; i; f), non-perfect conditions are∀ ∀
assumed in this subsection in the presence of a multipath fading channels.
Our simulated OFDM signal has been filtered through a normalized multipath fading channel to reflect the effective Power Spectral Density and thus calculate the channels load as previously explained in this paper.
We can observe in figure 11 that our algorithm is still constantly accurate despite certain attenuation factors.
Fig. 11. Averaged Mean Squared Error of the estimated load versus the real load values in presence of a multipath fading channel
Finally, from the analysis performed in the above sub-sections, we can conclude that in a high level of noise, the number of channels observation and message length could be increased (more than 3 channels observation and 500 ts respectively) in
order to maintain the same accuracy level of the algorithm, and the averaged calculation method through two simultaneous channels observation is also recommended in order to minimize the Mean Squared Error value and increase the precision level of the estimated load.
V. FINDINGS AND POTENTIALUSECASES
As previously described in section II, when the user is trying to connect to a suitable Access Point (AP), interrogation requests are performed in order to detect the available AP. Different values of the timers could be set to assure an optimal waiting time for the response of the access point before the connection.
Following the application of our algorithm, and where the user terminal is waiting between two timers values to connect to the suitable AP, the measurement of the load by the user terminal could facilitate the selection and thus optimize both the values of the timers, and the battery consumption when compared to long timers duration with no response in congested networks.
In addition, the main characteristic of our algorithm, is by a minimum channels observations of 3 non-overlapped channels only, either by the user station or by the WiFi AP, the load of all the remaining overlapped channels could be estimated automatically, minimizing by that the channel load measurement and channel selection time.
Finally, in practical use, overlapped channels are not considered usable and typically are not selectable in order to avoid co-channel interference; however, in densely populated networks, and with the future increasing spectrum demand, overlapped channels might be needed to resolve network congestions where further algorithms and procedures should be analysed to minimize the anticipated interference.
VI. CONCLUSION
In this paper we have proposed an algorithm that estimates the load of the physical channels of WiFi 802.11n in 2.5 GHz spectrum. Based on only 3 observations of non-overlapping channels, the proposed algorithm is able to estimate the load of the 12 channels of the WiFi 802.11n.
The accuracy of the algorithm has been measured by the Mean Squared Error of multiple realizations, in error free channel and in white Gaussian noisy channel.
We evaluated our work and can conclude a high accuracy level and flexibility in estimating the load of the physical channels, thus facilitating the channel assignment based on the minimal load, providing better Quality of Experience (QoE) for the end user and minimized load measurement and channel selection time.
Future work in the short term will focus on how to integrate WiFi systems and access techniques based on channel load with the LTE advanced systems toward the 5G heterogeneous networks.
VII. REFERENCES
[1] N. Himayat and S. ping Yeh, “Multi radio heterogeneous networks: Architectures and performance,” Computing, Networking and Communications ICNC, international conference IEEE, pp. 252–258, Feb 2014.
[2] Wi-Fi: Overview of the 802.11 Physical Layer and Transmitter Measurements. Tektronix, 2013.
[3] W. P. S. Zhu Han, Thanongsak Himsoon and K. J. R. Liu, “Resource allocation for multiuser cooperative ofdm networks: Who helps whom and how to cooperate,” IEEE Transactions On Vehicular Technology, vol. 58, no. 5, pp. 2378–2391, June 2009. [4] J. P. Amit Kachroo and H. Kim, “Channel assignment with
transmission power optimization method for high throughput in multi-access point wlan,” IEEE, ICT and Future Planning as Global Frontier Project (CISS- 2014011066), 2015.
[5] E. H. S. Chieochan and J. Diamond, “Channel assignment schemes for infrastructure based wlans,” IEEE Communications Surveys and Tutorial, vol. 12, no. 1, p. 124 136, 2010.
[6] M. Z. Dawei Gong and Y. Yang, “Channel assignment in multi-rate 802.11n wlans,” IEEE Wireless Communications and Networking Conference, 2013.
[7] M. Kim and C.-H. Choi, “Hidden-node detection in ieee 802.11n wireless lans,” IEEE Transactions On Vehicular Technology, vol. 62, no. 6, July 2013.
[8] A. M. Nicolas Montavont and G. Castignani, “On the selection of scanning parameters in ieee 802.11 networks,” IEEE 24th International Symposium on Personal, Indoor and Mobile Radio Communications: Mobile and Wireless Networks, pp. 2137– 2141, 2013.
[9] S. S. R. Rachana Khanduri, “Performance comparison analysis between ieee 802.11a/b/g/n standards,” International Journal of Computer Applications, vol. 78, no. 1, p. 0975 8887, Sep 2013.
[10] Thorpe, S. Murphy, and L. Murphy, “Analysis of variation in ieee802.11k channel load measurements for neighboring wlan systems,” in ICT Mobile and Wireless Communications Summit (ICTMobileSummit’08), Jun. 2008.
[11] Ashish Kumar and Dr. M. Nandhini, “An efficient least congested distributed channel selection algorithm with associated and interfering stations in WLAN”, International Journal of Advanced Research in Computer Science, Feb 2017. [12] Mehmet Karaca and Bjorn Landfeldt “Learning based Channel
Load Measurement in 802.11 Networks”, arXiv:1301.2750v3, Apr 2016.
[13] K. J. R. L. Zhu Han, Resource Allocation for Wireless Networks, Apr 2008.
[14] N. Kaur, H. Kaur, and J. Kaur, “Power spectral density analysis of wlan based ofdm system,” International Journal of Computer Applications, vol. 68, no. 7, p. 0975 8887, April 2013.
[15] T. van Waterschoot, V. L. Nir, J. Duplicy, and M. Moonen, “Analytical expressions for the power spectral density of cp-ofdm and zp-cp-ofdm signals,” IEEE Signal Processing Letters, vol. 17, no. 4, pp. 1070–9908, April 2010.
[16] P. D.Welch, “The use of fast fourier transform for the estimation of power spectra: A method based on time averaging over short, modified periodograms,” IEEE Trans. Audio and Electroacoust., vol. 15, pp. 70–73, June 1967.
[17] R. M. Hansa Rani Gupta, “Power spectrum estimation using welch method for various window techniques,” International Journal of Scientific Research Engineering and Technology (IJSRET), vol. 2, no. 6, p. 389 392, Sep 2013.
[18] J. C. M. B. Jie Chen, Cedric Richard and P. Honeine, “Nonnegative least-mean square algorithm,” IEEE Transactions on Signal Processing, vol. 59, no. 11, pp. 5225–5235, Nov 2011.
AUTHOR’S PROFILE
Mrs. Danielle Saliba: born in Beirut, Lebanon in 1981. She received the M.S degree in Electrical and Communication Engineering from the Lebanese University, Faculty of Engineering Roumieh in 2004.
She works currently in the Lebanese Alfa mobile operator network since Aug 2004 till present.
She started her research in PhD in Sep 2015 in Mines Telecom Atlantique Institute (or Telecom Bretagne previously), Brest, France.
Her research interests include signal processing for digital communications, wireless communications systems, Heterogeneous Networks toward 5G technology.
Dr. Rodrigue Imad: born in Beirut, Lebanon in 1983. He received the M.S degree in Electrical Engineering from the Lebanese University, Faculty of Engineering, and the Master of Science from Telecom Bretagne, France, both in 2006.
In 2009, he received the PhD degree in Signal Processing and Telecommunications from Telecom Bretagne, Brest, France. Dr. Imad is currently Assistant Professor at the University of Balamand, Lebanon, and Chairman of the Mechatronics Department in Issam Fares Faculty of Technology of the University of Balamand. His research interests include signal processing for digital communications, wireless communications systems, channel coding, blind synchronization techniques and robotics.
Prof. Dr. Sebastien Houcke: born at Amiens in France in 1974. He received the engineering degree from the University of Compiegne, in Biomedical specialization in 1996.
In 1999, he obtained the Diploma in Advanced Studies of University of Cergy-Pontoise in Signal and Image field. In 2002 he defended his PhD at the University of Marne La Vallee. In December 2002, he integrates the Ecole Nationale Superieure des Telecommunications de Bretagne as Associated
Professor and got a full Professor position in 2013. His research interests include signal processing applied to digital communications with particular interest in techniques entirely
autodidact, the blind source separation and cognitive radio. Personal Page (http://perso.enst-bretagne.fr/sebastienhoucke/).