HAL Id: hal-03143245
https://hal.archives-ouvertes.fr/hal-03143245
Submitted on 16 Feb 2021
HAL is a multi-disciplinary open access
archive for the deposit and dissemination of
sci-entific research documents, whether they are
pub-lished or not. The documents may come from
teaching and research institutions in France or
abroad, or from public or private research centers.
L’archive ouverte pluridisciplinaire HAL, est
destinée au dépôt et à la diffusion de documents
scientifiques de niveau recherche, publiés ou non,
émanant des établissements d’enseignement et de
recherche français ou étrangers, des laboratoires
publics ou privés.
Distributed under a Creative Commons Attribution| 4.0 International License
Province of Western China based on web mapping
navigation data
C. Shen, Z. Zhou, S. Lai, Li Lu, W. Dong, M. Su, J. Zhang, X. Wang, Q.
Deng, Y. Chen, et al.
To cite this version:
C. Shen, Z. Zhou, S. Lai, Li Lu, W. Dong, et al.. Measuring spatial accessibility and within-province
disparities in accessibility to county hospitals in Shaanxi Province of Western China based on web
mapping navigation data. International Journal for Equity in Health, BioMed Central, 2020, 19,
pp.99. �10.1186/s12939-020-01217-0�. �hal-03143245�
R E S E A R C H
Open Access
Measuring spatial accessibility and
within-province disparities in accessibility to
county hospitals in Shaanxi Province of
Western China based on web mapping
navigation data
Chi Shen
1, Zhongliang Zhou
1*, Sha Lai
1, Li Lu
2, Wanyue Dong
3, Min Su
4, Jian Zhang
1, Xinyu Wang
3, Qiwei Deng
3,
Yaru Chen
5and Xi Chen
6Abstract
Background: The Chinese government proposed the“XIAO BING BU CHU CUN, DA BING BU CHU XIAN” initiative in 2016, which states the rate of health care service provided by county hospitals should reach 90% of overall health care service provision. The prerequisite for achieving this goal is that citizens should be able to access county hospitals’ services conveniently and impartially. However, little research has been done on the actual levels of the spatial accessibility of citizens to county hospitals in Western China. Therefore, we aimed to measure the spatial accessibility to county hospitals for county residents and to identify any regional disparities in Shaanxi Province in Western China.
Methods: We implemented a novel method– involving utilizing navigation data from the AutoNavi web mapping system (knows as Gaode map in Chinese)– to assess the time and distance from villages and neighborhoods to the county hospitals. The navigation data were collected by request through an application-programming-interface using a web crawler (web data extraction tool) in Python. The shortest driving time and distance were extracted from the navigation data. The travel impedance to the nearest provider (TINP) indicator was used to measure spatial accessibility.
Results: The results show that county residents in Western China’s Shaanxi Province have poor spatial accessibility to county hospitals. Only 68.8% of villages and neighborhoods are within 60 min travel time (based on driving mode) to a county hospital, while 13.4% of such villages and neighborhoods are beyond 90 min travel time. Moreover, a significant within-province disparity exists, with residents in the central area enjoying the best accessibility to county hospitals, while the northern and southern areas still need improvements in accessibility.
(Continued on next page)
© The Author(s). 2020 Open Access This article is licensed under a Creative Commons Attribution 4.0 International License, which permits use, sharing, adaptation, distribution and reproduction in any medium or format, as long as you give appropriate credit to the original author(s) and the source, provide a link to the Creative Commons licence, and indicate if changes were made. The images or other third party material in this article are included in the article's Creative Commons licence, unless indicated otherwise in a credit line to the material. If material is not included in the article's Creative Commons licence and your intended use is not permitted by statutory regulation or exceeds the permitted use, you will need to obtain permission directly from the copyright holder. To view a copy of this licence, visithttp://creativecommons.org/licenses/by/4.0/. The Creative Commons Public Domain Dedication waiver (http://creativecommons.org/publicdomain/zero/1.0/) applies to the data made available in this article, unless otherwise stated in a credit line to the data.
* Correspondence:zzliang1981@163.com
1School of Public Policy and Administration, Xi’an Jiaotong University, No.28
Xianning West Road, Xi’an 710049, Shaanxi, China
(Continued from previous page)
Conclusions: Focused health resource planning is required to improve the spatial accessibility to county hospitals and to eliminate regional disparities. Further studies are called for to integrate the navigation data of web mapping systems with GIS methods to the measure spatial accessibility of health facilities in more complex contexts.
Keywords: Spatial accessibility, County hospitals, Web crawler, Navigation Introduction
The Chinese government issued an outline of the “Healthy China 2030” plan on October 25, 2016, which aims to improve people’s health and re-emphasizes the need to“provide an equal and accessible, systematic and sustainable health service” [1].
Equity and accessibility have become two of the most important goals of China’s health system. Equity and ac-cessibility mean there should be no differences between urban and rural areas, different regions, and populations in terms of health service utilization, health outcomes, and access to health resources1 [5]. Here, accessibility generally refers to spatial accessibility (the convenience to reach a health care institution) and economic accessi-bility (whether the health care is affordable or not) in China [6]. Spatial accessibility not only measures the utilization of health services, but also can affect resi-dents’ health status and health service needs [7, 8]. Measurement of the spatial accessibility of health re-sources may provide effective evidence for the need for health resource reallocation and improved regional health planning.
Existing studies on the spatial accessibility of health re-sources in China can be mainly summarized into two types based on their focus. First, studies have assessed the spatial accessibility of residents to different types of health institutions from the perspective of health system research. These studies have revealed that the distribu-tion of hospital beds at the county level is highly spatially clustered [9]. Clear gaps in spatial access to pri-mary health care were found within Sichuan Province in China [10], where 69% of villages have lower spatial ac-cessibility to health services compared with the average county level in Jiangsu Province [11], while the spatial accessibility of public hospitals in Beijing was improved by referral reform in 2015, which also increased the
inequality of access to medical resources between towns and streets [12]. Second, some studies have implemented various methods to evaluate the feasibility of using these methods to measure special accessibility, such as the “two-step optimization for spatial accessibility improve-ment” has been verified can balance the dual goals of ef-ficiency and equality by combining the two steps in a true hybrid optimization model [13], and the two-steps floating catchment area method was verified to be able to reveal detailed spatial distribution differences in larger areas (such as cities) [14]. In conclusion, the spatial ac-cessibility of health resources is a popular research fiel-din China, with researchers tenfiel-ding to measure spatial accessibility from the perspective of health systems and methodologies. However, studies from the perspective of health systems are not enough, especially in terms of county-level hospitals.
China’s health care delivery system shows an urban-rural dual structure, with the three-tier health care deliv-ery system playing the most important role in providing accessible and sustainable basic health services in rural areas of China [1, 10]. County-level hospitals are the highest level of health care institutions in the county re-gions, and therefore appropriate accessibility to county-level hospitals is an important prerequisite for support-ing the health needs of rural residents [15]. The Chinese government proposed the“XIAO BING BU CHU CUN, DA BING BU CHU XIAN” initiative in 2016, which means the rate of health care service provided by county hospitals should reach 90% of overall health care service provision [16]. The prerequisite for achieving this goal is that residents should be able to access health care ser-vices from county hospitals conveniently and impartially. However, there is a lack of research documenting the level of spatial accessibility of county hospitals in China.
The commonly used methods to measure residents’ spatial accessibility to public services are provider-to-population ratios (PPR), nearest-neighbor analysis (NNA), and two-step floating catchment area (2SFCA), as well as a series of modified methods [2, 10, 17–19]. There are two main problems in the measurement of spatial accessibility: i) identification of the population distribution, and ii) accurate calculation of the time and distance between residential areas and the health care institutions serving them. The most widely used solu-tions to obtain population distribution include 1) using 1
Accessibility of health services has been widely studied and can be understood from different aspects, while there is no consistent on its definition and evaluation [2]. Penchansky and Thomas proposed that access to health services can be divided into five categories: availability, accessibility, accommodation, affordability, and acceptability [3]. These five aspects were considered to be the main influencing factors of health service utilization according to the behavioral model of Andersen’s health service utilization [4]. The access to health services was also assessed from four aspects: (1) affordability; (2) physical accessibility; (3) acceptability of services; and (4) not merely adequacy of supply [5].
population census [8,11,20–22], or 2) using a GIS pack-age to cut the map into grid cells with different areas and then to evenly assign the total population of the area to each grid unit and treat its center as the population distribution coordinate point [7, 9, 23]. The most com-mon method to measure time and distance between points is to use road networks in the GIS package to-gether with information on the applicable speed limit criteria on those road networks to measure travel time [7,9,23]. Some limitations of this approach include that the traditional census is conducted at intervals and therefore includes hysteresis, that errors can occur from cutting up the map, and that using road network maps can lead to rough estimates.
Therefore, this study aimed to measure spatial bility to county hospitals and any disparities in accessi-bility for county residents in 73 administrative counties in Shaanxi Province of Western China. We first used the navigation data of online digital maps to assess the time and distance from residents to county hospitals in Shaanxi Province. The navigation data were collected from AutoNavi, a Chinese web mapping, navigation, and location-based services provider, via our request to open an application programming interface (API) using web crawler technology.
Data collection and methods Research area
Shaanxi Province is the most developed province in Western China, with an area of 205,800 km2and a total population of 38.35 million in 2017 [24]. Geographically, the central, southern, and northern regions of Shaanxi Province differ significantly. The central part is on a plain and includes the wealthiest area in Shaanxi Prov-ince, while the southern part includes the Qinling Mountains, and the northern part covers the Loess Plat-eau. The economy is less developed with a relatively small population density in the southern and northern parts. This study divides Shaanxi Province into three re-gions based on geographic and economic conditions.
Data collection scheme
In order to measure the spatial accessibility to health re-sources, three types of data were basically needed: geo-graphical distribution of the population, the geographical location of hospitals, and the time and dis-tance between residents and the hospitals. Therefore, we collected data in three steps.
First, considering the uneven distribution of the popu-lation, we used the geographical location of the villages and neighborhoods to identify the population distribu-tion. Here, two strategies were adopted in our study:
i) For villages and neighborhoods with a village clinic, we selected the coordinates of the village clinics to represent the population distribution since the village clinics should be in an area with relatively high concentration of the village population to cover the population of the village to the greatest extent. ii) For villages and neighborhoods whose village clinic
we could not acquire or that have multiple village clinics, we selected the default coordinates provided by the web mapping navigation service provider. This coordinate usually defaults to the location of the village or neighborhood office, which is usually located in a populated area.
Second, we obtained the names of the county hospitals from the Health Commission of Shaanxi Province, and then we directly used the names of the hospitals to get their geographical locations from the web map.
Third, the time and distance between each village and neighborhood to the county hospitals were collected from the navigation results provided bythe web mapping navigation service. We chose the fastest route, but not the highway route (because China’s highway import and export are usually set around the county), to get the time and distance from villages and neighborhoods to the local county hospital by using the real-time naviga-tion data of the AutoNavi map in the driving mode. The reason why only the local county hospitals were selected is that the Chinese new rural cooperative medical insur-ance implemented in rural areas provides cover at the county level only. In this study, we assumed that due to the medical insurance reimbursement strategy, residents were less likely to visit a doctor in another county-level hospital outside their own county [11].
Data collection method
To perform the data collection, first, we obtained the names of the village clinics and county hospitals in over-all Shaanxi Province from the Shaanxi Provincial Health Statistics Annual Report in 2017, which was provided by the Health Commission of Shaanxi Province. In addition, we also obtained the names of the village and neighbor-hood committees in overall Shaanxi Province from the website of the National Bureau of Statistics [25].
Second, we used the geocoding interface of AutoNavi map to collect the coordinates of all the villages and neighborhoods and county hospitals. The requests through the API for the geocoding of the AutoNavi map were conducted by using a web crawler (a web data ex-traction tool) in the Python 3.6 program [26]. The URL of this geocoding interface can be found in the footnote below.2AutoNavi map, known as Gaode in Chinese, was 2https://lbs.amap.com/api/webservice/guide/api/georegeo#geo
founded in 2011 and is one of the largest web mapping, navigation, and location-based services providers in China. It offers map services atAmap.comand on a mo-bile App too.
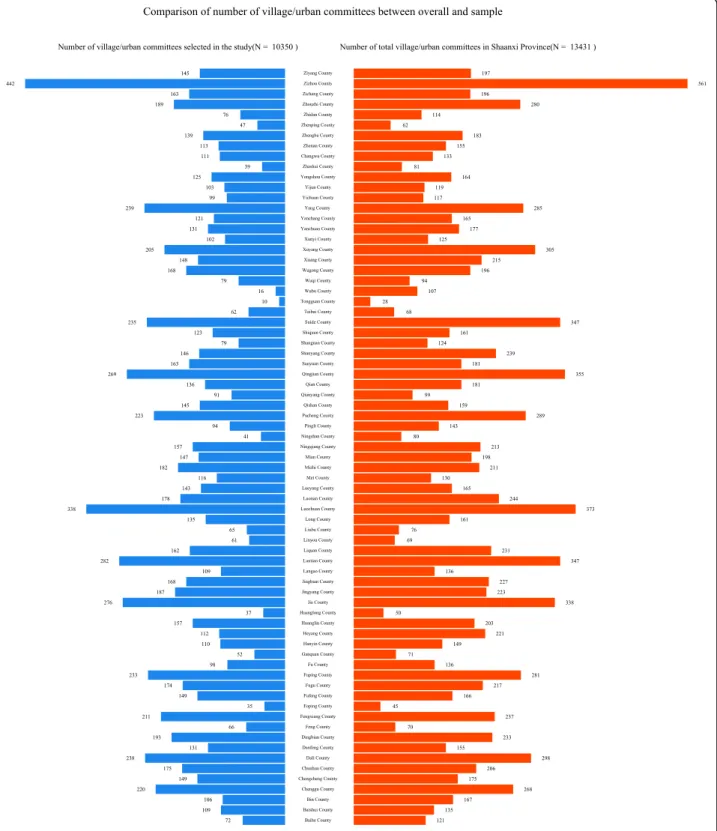
Third, navigation data, including driving time and dis-tance, were collected by using the path planning inter-face by setting the coordinates of the villages and neighborhoods as the starting point and the coordinates of a county hospital in the district as the endpoint. The URL of the path planning interface can be found in the footnote below.3To consider the influence of the traffic conditions at different times, this study was performed four times randomly: the morning (10:00 to 11:00) and afternoon (14:00 to 15:00) on November 23, 2018 (Fri-day) and November 27, 2018 (Tues(Fri-day). For the time pe-riods studied, crawling requests were made by Python to the AutoNavi mapping for the four time periods, and we took the average value of the results for the four time periods. Finally, data on 10,350 villages and neighbor-hoods (total of 13,074 villages and neighborneighbor-hoods) from 73 counties of Shaanxi Province were obtained in our study (Fig.1).
Analysis methods
The travel impedance to a nearest provider (TINP) was used to evaluate the spatial accessibility in this study. Here, TINP measured the spatial accessibility by using indicators such as the distance, time, or cost from the place of residence to the nearest medical institution, expressed in terms of a straight Euclidean distance (straight line) [2]. Distance and time were chosem as they are indicators that directly reflect spatial accessibil-ity, whereby the closer the distance, the shorter the travel time and the higher the accessibility. Although TINP ignores the supply of health resources, this method is applicable to situations where the choice of seeking health care service is relatively simple, as in rural areas. In addition, we used more precise traffic distance downloads from a web map instead of the Euclidean dis-tance in this study.
We calculated Getis-Ord Gi* statistics for the spatial association of each county to explore whether there were any disparities in spatial accessibility [27, 28]. The Gi* statistic returned for each county was recorded as a z-score [29]. A high positive z-z-score and small p-value for a county represent a spatial clustering of high values (hot spot)); whereas a low negative z-score and small p-value represent a spatial clustering of low p-values (cold spot). The higher or lower the z-score, the more intense the clustering. A z-score close to zero means no signifi-cant spatial clustering. Getis-Ord Gi* statistics were cal-culated by using the R package ‘spdep’ [30]. The spatial
relationships of counties were defined as Queen’s Case. The distance and time of counties were recorded as the averages of distance and time of villages and neighborhoods.
We used concentration curve and the concentration index (CI), a method recommended by the World Bank to measure the inequality in health indicators related to living standards [31], to explore the influence of gross domestic product (GDP) and population on the differ-ences in spatial accessibility to county hospital across counties.
In the concentration curve plot, the horizontal axis is the cumulative percentage of the observation unit (county in our study) ranked in ascending order by liv-ing standards (rank variable), and the vertical axis is the cumulative percentage of the health indicator. Originally, the living standard is a socioeconomic indicator, but we extended it to GDP and population. Concentration curve can be used to examine inequality in any health sector variable of interest [31], such as health resources and health services [32,33].
The value of CI is the double area between the con-centration curve and the line of equality (the 45-degree line); it is a negative (positive) value when the concentra-tion curve lies above (below) the line of equality. The range of CI is between− 1 and 1, where zero means no rank variable-related inequality, a negative (positive) value means a disproportionate concentration of the health indicator among the observation unit with the lower (higher) value in the rank variable. Generally, the calculation method of the concentration index is as follows:
C ¼2μ cov h; rð Þ
where, h is the health indicator, μ is its mean, and r is the fractional rank of the observation unit. In this study, we selected the average shortest time of the village/ neighborhoods to county hospitals as the health
indica-tor, GDP and population4 as the rank variables, and
county as the observation unit.
Results
Level of spatial accessibility
From the perspective of the villages and neighborhoods level, the average driving distance from the villages and neighborhoods to the county hospitals was 28.4 km, with an average shortest travel time of 49.7 min. Only 68.9% of villages and neighborhoods are within 60 min travel time to reach county hospitals, while 13.4% would
3https://lbs.amap.com/api/webservice/guide/api/direction#driving
4Data were collected from the Shaanxi Statistical Yearbook in 2019.
require more than 90 min to reach the county hospital (Table2and Fig.2).
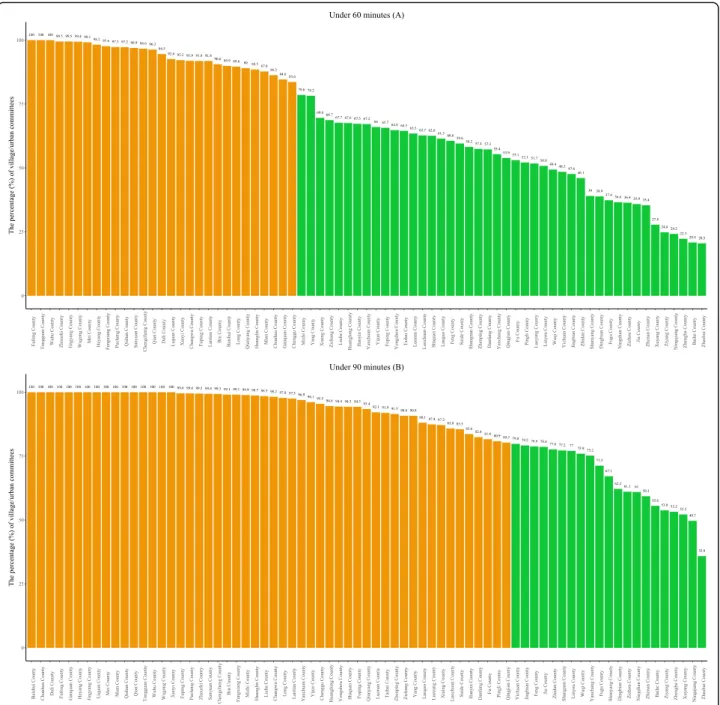
From the perspective of the county level, we calculated the percentage of villages and neighborhoods where resi-dents could reach county hospitals within 60 min and
90 min per county. Figure 3 shows that the number of the county where 100% of villages and neighborhoods can access to the county hospitals within 60 min and 90 min are 3 and 16, respectively. Therefore, we assumed that the standard measure was one where 80% of the
villages and neighborhoods were within that travel time limit to reach a county hospital. We further calculated the frequency and percentage of counties in which 80% of villages or neighborhoods could access a county hos-pital within 60 min and 90 min, respectively, and found that only 39.7 and 71.2% of the counties in Shaanxi Province meet that standard (Table2).
Disparity of spatial accessibility
In terms of sub-regions, there is a large disparity of spatial accessibility in the central, northern, and south-ern regions of Shaanxi Province (Fig. 4). Meanwhile, we summarized the travel distances and times for the indi-vidual villages and neighborhoods into county-level values, where the values of each county are the averages of local villages and neighborhoods. Getis-Ord Gi* statis-tics show that the northern and southern regions of Shaanxi Province are hot areas, while the central region
represents a cold area (Fig.5), which means longer travel distances and times are clustered in the northern and southern regions. In other words, the worst spatial ac-cessibility areas are clustered in the northern and south-ern regions. The central region has the best spatial accessibility due to its location in the plain and it incorp-orating richer areas, with an average driving distance from residential areas to county hospitals of 19.2 km and with the shortest average journey times of 33.5 min, and hence 91.6% of the residents could reach a county hos-pital within 1 h (Table 1). The proportions of residents that can arrive at the county hospitals within one hour in the northern and southern regions were 54.0 and 53.6%, respectively (Table 1). At the county level, the proportions where 80% of the villages and neighbor-hoods in the counties were within 60 min travel time to a county hospital were 82.8% in the central region, 15.0% in the northern region, and 8.3% in southern
region. The figures based on arrival within 90 min were only 55.0% in the northern region and 58.3% in southern region (Table2).
Factors influencing the disparities in spatial accessibility
In order to analysis the factors influencing the disparity in spatial accessibility to county hospital across counties, we calculated the concentration index to evaluate whether the population or GDP in a county affect the spatial accessibility to county hospital. The results (Table 3 and Fig. 6) show that the CI for the average shortest time for the village/neighborhood to reach the
county hospital in a county, as ranked by population, was − 0.059, which means that counties with smaller populations tend to have a longer travel time to reach the county hospital than counties with larger popula-tions. The CI of the percentage of villages/neighbor-hoods that can access a county hospital in under 60 min in a county was 0.070, which means the county hospitals in the counties with larger populations can cover more residents than the county hospitals in the county with smaller populations. Overall, the residents in a county with a larger population have a higher spatial accessibil-ity to county hospitals. It may seem that the residents in
a county with a higher GDP would have higher spatial accessibility to county hospitals too, however, the insig-nificant p-values did not support us to confirm this finding.
Discussion
There are three key findings from our study. First, resi-dents in county areas in Shaanxi Province have poor spatial accessibility to county hospitals, whereby only 68.8% of villages and neighborhoods are within 60 min travel time to county hospitals, while 13.4% still need more than 90 min for residents to reach the county hos-pital. Second, there is a large disparity within Shaanxi Province, whereby the residents in the central area have the best spatial accessibility to county hospitals, while the northern and southern area still need improvement in the accessibility. Third, residents in counties with a larger population have a higher spatial accessibility to county hospitals. Moreover, our study proved that using
the navigation data of a web map to measure spatial ac-cessibility to health resources is a feasible technique.
Our study shows that Shaanxi Province has a low-level spatial accessibility to county-level hospitals. In fact, we think the spatial accessibility might be even worse, be-cause we selected the driving mode to calculate the dis-tance and time in the process of crawling the navigation data. The original intention of selecting the driving mode was to simplify the data collection process; how-ever, in practice, there is a low ownership of moto ve-hicle pers. 100 urban households, only 29.7 in 2017 in China [34], which means China has not yet developed to the stage where every household has a vehicle, especially in the counties and rural areas. The main travel modes in China’s rural areas are motorcycles and e-bikes, which have a lower speed than vehicles, and therefore, the spatial accessibility in the county area may be overesti-mated in our study. However, this overestimation does not affect the comparisons made here of the spatial ac-cessibility considered under a uniform travel mode, so
Fig. 5 Getis-Ord Gi* statistics of the shortest driving time and distance at the county-level within Shaanxi Province
Table 1 Spatial accessibility to county hospitals at the villages and neighborhoods level
Central Shaanxi Northern Shaanxi Southern Shaanxi Overall F p
N 4119 3306 2925 10,350
Distance(km), mean(sd) 19.2 (12.1) 35.2 (21.0) 33.8 (20.2) 28.4 (19.3) 935.7 < 0.001 Shortest time(minutes), mean(sd) 33.5 (19.3) 59.5 (32.7) 61.5 (35.5) 49.7 (31.9) 1060 < 0.001 Time range, %(CI 95%): Under 15 min 13.8 (12.8–14.9) 7.6 (6.7–8.5) 6.6 (5.7–7.5) 9.8 (9.2–10.4) Under 30 min 48.7 (47.1–50.2) 21.6 (20.2–23) 22.6 (21.1–24.1) 32.6 (31.7–33.6) Under 45 min 79 (77.7–80.2) 38.3 (36.6–39.9) 38.9 (37.2–40.7) 54.7 (53.7–55.6) Under 60 min 91.6 (90.8–92.4) 54.0 (52.3–55.7) 53.6 (51.8–55.4) 68.9 (68.0–69.8) Under 90 min 98.3 (97.9–98.7) 80.2 (78.9–81.6) 77.3 (75.8–78.9) 86.6 (86.0–87.3) Under 120 min 99.6 (99.4–99.8) 95.7 (95.0–96.4) 91.9 (90.9–92.9) 96.2 (95.8–96.5)
comments on the disparity within Shaanxi Province are valid. On the other hand, since Shaanxi is the most de-veloped province in Western China, we have reason to infer that other Western provinces (Gansu and Ningxia, etc.) with less developed economic levels and worse geo-graphical environments may have worse spatial accessi-bility to county hospitals.
Good spatial accessibility is an important prerequisite for residents to use health care services in a timely man-ner, whereby a low-level spatial accessibility may cause serval problems. One research study reported that asthma mortality showed a significant trend with an in-crease in travel time to hospital, and the relative risk was increased by 1.07 times for each additional 10 min [35]. Mortality from other time-critical diseases, like stroke, may also experience the same risk. Another study showed that geographical obstacles were one of the four major factors limiting persons with disabilities being able to access primary health care [36]. Moreover, we found an obvious regional disparity in the spatial accessibility to county hospitals across Shaanxi Province, and the dis-parity was highly correlated with the county’s population size. This disparity should be taken seriously. Further re-gional disparities in spatial accessibility were also ob-served for primary health institutions in Sichuan Province and for public hospitals in Beijing City [10,12]. Regional variations are also not limited to China and commonly exist in many parts of the world, and have been reported in the literature in various studies, includ-ing significant geographic disparities in access to primary stroke centers in the United States [37], in access to health care facilities between urban and suburban se-niors in Montreal Island [38], and in access to
community resources between urban and rural areas of New Zealand [39]. It is well known that spatial accessi-bility influences health services utilization. Strong evi-dence supports that there is a strong pro-rich inequality in maternal health services and inpatient utilization in rural Western China [40,41]. Accordingly, we have rea-sons to infer that the disparity in spatial accessibility may cause or aggravate the pro-rich inequality of health services utilization in Western China. Therefore, China should also pay attention to the equity of spatial accessi-bility to health care, although this may be something the Chinese government is aware of as it has already advo-cated that residents in every region should have equal access to health care resources.
How to improve the spatial accessibility to county hos-pitals in rural areas? Some cities in China have begun to set a goal of“15-minute health circle” for primary health care services [42]. Our study identified that it would be reasonable to set the residents’ spatial accessibility to county hospitals as“1 h” in Western China. In addition, the most direct approach to improve spatial accessibility is to improve transportation facilities in rural areas, but spatial accessibility should not be limited to just making improvements considering the physical distance. By es-tablishing video telemedicine and a timely drug distribu-tion system by using Internet technology to strengthen the flow of superior resources between the three-level (county–township–village) service networks, the spatial distance between residential areas and health care ser-vices in county hospitals could also be effectively improved.
Finally, one previous study analyzed the time and space accessibility of urban parks by using the path
Table 2 Spatial accessibility to county hospitals at the county level
Areas The number (%) of counties in which 80% of villages or neighborhoods can access a county hospital Under 60 min Under 90 min
Overall Shaanxi (N = 73) 29 (39.7%) 52 (71.2%) Central Shaanxi (N = 29) 24 (82.8%) 27 (93.1%) Northern Shaanxi (N = 20) 3 (15.0%) 11 (55.0%) Southern Shaanxi (N = 24) 2 (8.3%) 14 (58.3%)
Table 3 Concentration Index (CI) of spatial accessibility to the county hospitals of counties in Shaanxi Province
Interest variable Rank Variable
Population GDP
N CI Std. Err. p value N CI Std. Err. p value Shortest timea 73 −0.059 0.024 0.015 73 −0.030 0.025 0.227 Percentage under 60 minb 73 0.070 0.023 0.003 73 0.037 0.024 0.119 Percentage under 90 minc 73 0.016 0.012 0.183 73 0.006 0.012 0.657
a
means the average shortest time for villages/neighborhoods in a county,b
means the percentage of villages/neighborhoods that can access the county hospital in under 60 min in a county,c
Fig. 6 Concentration curves of the spatial accessibility to the county hospital of counties in Shaanxi Province. Note:ameans the average shortest time for villages/neighborhoods in a county,bmeans the percentage of villages/neighborhoods that can access the county hospital in under 60
planning API provided by Gaode map [43], as we used in this study, which confirmed the feasibility of using navigation data of the web map to conduct spatial acces-sibility research. There are two advantages of this method: i) The accuracy of the data extracted from the navigation system is significantly higher than that roughly estimated by using road network maps. How-ever, the measurement accuracy is unsatisfactory whether using the linear Euclidean distance or road net-work traffic distance. An accurate method to measure distance is very important since the measurement accur-acy of the distance directly affects the accuraccur-acy of the as-sessment of spatial accessibility. ii) Navigation data provided by the web mapping realizing real-time up-dates, i.e., considering the road traffic situation, is more in line with the actual situation. In summary, combining the navigation data from a web map and two-step float-ing catchment area modified methods to measure spatial accessibility of health resources is highly feasible and has good application prospects.
We still can not avoid there being some limitations in this study, which we note here. First, since it is very diffi-cult to collect specific population data at the village and neighborhood level, only the relatively simple nearest distance method was used to evaluate the spatial accessi-bility, which ignored the supply and demand of health resources. Second, distance and time data were only ex-tracted under the driving mode, and the figures were not analyzed for using public transportation or other modes, which may not be consistent with the actual mode of travel of rural Chinese residents. Last, not all villages and neighborhoods in Shaanxi Province were involved because a small amount of data were unobtainable. Looking to the future, we are looking for a feasible method to collect the population data in villages and neighborhoods, fortunately, China is doing its sixth na-tional population census, which will provide a chance to obtain accurate population data in villages and neighbor-hoods. At that time, we can consider the population and health resources for measuring spatial accessibility by combining the navigation data of the web map.
Conclusion
We found that county residents in Western China’s provinces, as represented by Shaanxi Province, have a lower spatial accessibility to county hospitals, and signifi-cant regional disparities exist within provinces. Health policy and health resource planning are needed to im-prove the spatial accessibility and to eliminate regional disparity. Moreover, our study demonstrates the feasibil-ity of using navigation data provided by a web map to measure spatial accessibility to health resources. Further research is needed to verify whether this new method is more accurate than using GIS for evaluation. We
encourage further research to combine the navigation data of a web map with two-step floating catchment area modified methods to measure the spatial accessibility of health facilities in more complex situations.
Abbreviations
API:Application Programming Interface; CI: Concentration Index; GDP: Gross Domestic Product; NNA: Nearest-Neighbor Analysis; PPR: Provider-to-Population Ratios; TINP: Travel Impedance to a Nearest Provider; 2SFCA: Two-Step Floating Catchment Area
Acknowledgements
The authors thank the AutoNavi Software Co., Ltd. for providing application programming interface to download the navigation data freely. We also thank China Scholarship Council for providing financial support to Chi Shen (201906280175) to visit Yale University.
Authors’ contributions
CS, ZLZ and XC contributed to the framework and design of this study. CS and XYW wrote the python script to collect the data and performed the data analysis. CS, LL and SL drafted the manuscript. WYD, JZ, MS and QWD provided assistance in data collection and analysis. YRC provided significant advices in design and analysis. All authors contributed significant intellectual content in this study and approved the final submission.
Funding
This study was funded by China Medical Board (15–277), National Natural Science Foundation of China (71874137), Shaanxi Social Science Foundation (2017S024), Research Program of Shaanxi Soft Science (2015KRM117), the National high-level talents special support plan (thousands of people plan), Shaanxi provincial youth star of science and technology in 2016, U.S. PEPPER Center Scholar Award (P30AG021342), and two NIH/NIA grants
(K01AG053408; R03AG048920). Availability of data and materials
The data were collected from AutoNavi map, a Chinese web map and navigation service provider. This web map provides an open application programming interface for freely using data after registering as a developer. The application programming interface can be found here: (https://lbs.amap. com/api/webservice/guide/api/georegeo#geo) & (https://lbs.amap.com/api/ webservice/guide/api/direction#driving).
Ethics approval and consent to participate
The data used in this study were not collected from human subjects. Consent for publication
Not applicable. Competing interests
All authors declare no competing interests. Author details
1School of Public Policy and Administration, Xi’an Jiaotong University, No.28
Xianning West Road, Xi’an 710049, Shaanxi, China.2Team IETO, Bordeaux
Population Health Research Center, University de Bordeaux, 33076 Bordeaux, France.3School of Public Health, Health Science Center, Xi’an Jiaotong
University, Xi’an 710063, China.4School of Public Administration, Inner
Mongolia University, Hohhot 010021, China.5Centre for HealthCare
Innovation Research, Cass Business School & School of Health Sciences, City, University of London, London EC1V 0HB, UK.6Department of Health Policy
and Management, Yale School of Public Health, New Haven, CT 06520, USA.
Received: 24 February 2020 Accepted: 10 June 2020
References
1. General Office of the State Council of China. Outline of the "Healthy China 2030" Program.http://www.gov.cn/xinwen/2016-10/25/content_5124174. htm, Accessed date: 14 March 2019. (In Chinese)..
2. Guagliardo MF. Spatial accessibility of primary care: concepts, methods and challenges. Int J Health Geogr. 2004;3:3.
3. Penchansky R, Thomas JW. The concept of access: definition and relationship to consumer satisfaction. Med Care. 1981;19:127–40. 4. Andersen RM. Revisiting the behavioral model and access to medical care:
does it matter? J Health Soc Behav. 1995;36:1–10.
5. Martin G, Jose FM, Myfanwy M, David H, Barry G, Roger B, Meryl H. What does 'access to health care' mean? J Health Serv Res Policy. 2002;7:186–8. 6. National Health Commission of China. Report on the Fifth National Health
Service Survey and Analysis in 2013.http://www.nhfpc.gov.cn/
mohwsbwstjxxzx/s8211/201610/9f109ff40e9346fca76dd82cecf419ce.shtml, Accessed date: 14 March 2019. (In Chinese).
7. Berke EM, Shi X. Computing travel time when the exact address is unknown: a comparison of point and polygon ZIP code approximation methods. Int J Health Geogr. 2009;8:23.
8. Shah TI, Bell S, Wilson K. Spatial accessibility to health care services: identifying under-serviced Neighbourhoods in Canadian urban areas. PLoS One. 2016;11:e0168208.
9. Pan J, Shallcross D. Geographic distribution of hospital beds throughout China: a county-level econometric analysis. Int J Equity Health. 2016;15:179. 10. Wang X, Yang H, Duan Z, Pan J. Spatial accessibility of primary health care
in China: a case study in Sichuan Province. Soc Sci Med. 2018;209:14–24. 11. Dong S, Li Z, Hu R. Assessing potential spatial accessibility of health services
in rural;China: a case study of Donghai county. Int J Equity Health. 2013;12: 1–11.
12. Lu C, Zhang Z, Lan X. Impact of China's referral reform on the equity and spatial accessibility of healthcare resources: a case study of Beijing. Soc Sci Med. 2019;235:112386.
13. Luo J, Tian L, Luo L, Yi H, Wang F. Two-step optimization for spatial accessibility improvement: a case study of health care planning in rural China. Biomed Res Int. 2017;2017:2094654.
14. Liu Z, Guo S, Jin H, Xie Z, Wu X, Zhu X. Application of the GIS-based two-step floating catchment area method in measurement of spatial accessibility to hospitals in Beijing. Sci Surveying Mapping. 2007;32:61–3. 15. Office of the State Council of China. National Health Service System
Planning Outline (2015–2020). http://www.gov.cn/zhengce/content/2015-03/30/content_9560.htm, Accessed date: 14 March 2019. (In Chinese). 16. State Council of China. The 13th Five-Year Plan of Health.http://www.gov.
cn/zhengce/content/2017-01/10/content_5158488.htm, Accessed date: 14 March 2019. (In Chinese).
17. Neutens T. Accessibility, equity and health care: review and research directions for transport geographers. J Transp Geogr. 2015;43:14–27. 18. Luo W, Whippo T. Variable catchment sizes for the two-step floating
catchment area (2SFCA) method. Health Place. 2012;18:789–95.
19. Tao Z, Cheng Y. Research progress of the two step floating catchment area method and extensions (in Chinese). Prog Geogr. 2016;35:11.
20. Mao L, Nekorchuk D. Measuring spatial accessibility to healthcare for populations with multiple transportation modes. Health Place. 2013;24:115–22. 21. Luo W, Qi Y. An enhanced two-step floating catchment area (E2SFCA)
method for measuring spatial accessibility to primary care physicians. Health Place. 2009;15:1100–7.
22. Luo W, Wang F. Measures of spatial accessibility to healthcare in a GIS environment: synthesis and a case study in Chicago region. Environ Plann B Plann Design. 2003;30:865–84.
23. Huotari T, Antikainen H, Keistinen T, Rusanen J. Accessibility of tertiary hospitals in Finland: a comparison of administrative and normative catchment areas. Soc Sci Med. 2017;182:60–7.
24. Shaanxi Province Burean of Statistics. Statistics Yearbook of Shaanxi Province in 2018: Population and Its Composition,http://tjj.shaanxi.gov.cn/ contListCommon_128_1.html, Accessed date: 15 March 2019. (In Chinese). 25. National Burean of Statistics of China. 2017 zoning code and urban and
rural division code (as of October 31, 2017),http://www.stats.gov.cn/tjsj/ tjbz/tjyqhdmhcxhfdm/2017/index.html, Accessed date: 15 March 2019. (In Chinese).
26. Quan B, Gang X, Yong Z, He L. Analysis and detection of bogus behavior in web crawler measurement. Procedia Comput Sci. 2014;31:1084–91. 27. Getis A, Ord JK. The analysis of spatial association by use of distance
statistics. Geogr Anal. 1992;24:189–206.
28. Ord JK, Getis A. Local spatial autocorrelation statistics - distributional issues and an application. Geogr Anal. 1995;27:286–306.
29. de Castro MC, Singer BH. Controlling the false discovery rate: a new application to account for multiple and dependent tests in local statistics of spatial association. Geogr Anal. 2006;38:180–208.
30. Bivand RS, Wong DWS. Comparing implementations of global and local indicators of spatial association. Test. 2018;27:716–48.
31. O’Donnell O, Van Doorslaer E, Wagstaff A, Lindelow M. Analyzing health equity using household survey data. 2007. Washington, DC: The World Bank; 2016.
32. Li D, Zhou Z, Si Y, Xu Y, Shen C, Wang Y, Wang X. Unequal distribution of health human resource in mainland China: what are the determinants from a comprehensive perspective? Int J Equity Health. 2018;17:29.
33. Zhang T, Xu Y, Ren J, Sun L, Liu C. Inequality in the distribution of health resources and health services in China: hospitals versus primary care institutions. Int J Equity Health. 2017;16:42.
34. National Bureau of Statistics of China. Wang You Juan: In 2017, the income of the national residents increased rapidly, and the quality of life of the residents continued to improve.http://www.stats.gov.cn/tjsj/sjjd/201801/t2 0180119_1575491.html, Accessed date: 16 March 2019. (In Chinese). 35. Jones AP, Bentham G, Horwell C. Health service accessibility and deaths
from asthma. Int J Epidemiol. 1999;28:101–5.
36. Dassah E, Aldersey H, McColl MA, Davison C. Factors affecting access to primary health care services for persons with disabilities in rural areas: a "best-fit" framework synthesis. Glob Health Res Policy. 2018;3:36. 37. Mullen MT, Wiebe DJ, Bowman A, Wolff CS, Albright KC, Roy J, Balcer LJ,
Branas CC, Carr BG. Disparities in accessibility of certified primary stroke centers. Stroke. 2014;45:3381–8.
38. Paez A, Mercado RG, Farber S, Morency C, Roorda M. Accessibility to health care facilities in Montreal Island: an application of relative accessibility indicators from the perspective of senior and non-senior residents. Int J Health Geogr. 2010;9:52.
39. Pearce J, Witten K, Bartie P. Neighbourhoods and health: a GIS approach to measuring community resource accessibility. J Epidemiol Community Health. 2006;60:389–95.
40. Liu X, Gao W, Yan H. Measuring and decomposing the inequality of maternal health services utilization in Western rural China. BMC Health Serv Res. 2014;14:102.
41. Zhou Z, Gao J, Fox A, Rao K, Xu K, Xu L, Zhang Y. Measuring the equity of inpatient utilization in Chinese rural areas. BMC Health Serv Res. 2011;11:201. 42. Health.People.cn. Reform about 15-minute medical circle.http://health.
people.com.cn/n1/2019/0916/c14739-31354130.html, Accessed date: 16 March 2019. (In Chinese).
43. Huang Y, Liu X, Liu Y, Zhang H. Spatial and temporal accessibility analysis of urban parks based on Amap API by means of multiple transportation:a case study of Haizhu District in Guangzhou. Geography Geo Inform Sci. 2018;34:8 (In Chinese).
Publisher’s Note
Springer Nature remains neutral with regard to jurisdictional claims in published maps and institutional affiliations.