HAL Id: hal-01609218
https://hal.archives-ouvertes.fr/hal-01609218
Submitted on 23 Mar 2018
HAL is a multi-disciplinary open access
archive for the deposit and dissemination of
sci-entific research documents, whether they are
pub-lished or not. The documents may come from
teaching and research institutions in France or
abroad, or from public or private research centers.
L’archive ouverte pluridisciplinaire HAL, est
destinée au dépôt et à la diffusion de documents
scientifiques de niveau recherche, publiés ou non,
émanant des établissements d’enseignement et de
recherche français ou étrangers, des laboratoires
publics ou privés.
The effects of textural modifications on beech wood-char
gasification rate under alternate atmospheres of CO2
and H2O
Chamseddine Guizani, Francisco Javier Escudero Sanz, M. Jeguirim, R.
Gadiou, Sylvain Salvador
To cite this version:
Chamseddine Guizani, Francisco Javier Escudero Sanz, M. Jeguirim, R. Gadiou, Sylvain
Sal-vador.
The effects of textural modifications on beech wood-char gasification rate under
alter-nate atmospheres of CO2 and H2O. Fuel Processing Technology, Elsevier, 2015, 138, pp.687-694.
�10.1016/j.fuproc.2015.06.051�. �hal-01609218�
The effects of textural modifications on beech wood-char gasification rate
under alternate atmospheres of CO
2
and H
2
O
C. Guizani
a,⁎
, F.J. Escudero Sanz
a, M. Jeguirim
b, R. Gadiou
b, S. Salvador
aaRAPSODEE, Mines Albi, Route de Teillet, 81013 ALBI CT Cedex 09, France
bInstitut de Science des Matériaux de Mulhouse, UMR CNRS 7361, 15 rue Jean Starcky, 68057 Mulhouse Cedex, France
a b s t r a c t
Keywords: Char gasification CO2 H2O Gas alternation Thiele model Total surface area Active surface areaDespite the huge literature on biomass char gasification with CO2or H2O, ambiguity still hovers over the issue of
char gasification in complex atmospheres. Gas alternation gasification experiments, in which the reacting gas is changed during the reaction, were performed with CO2/H2O at 900 °C for small (200 μm) and large (13 mm) Low
Heating Rate (LHR) beech wood char particles to assess the potential influences that CO2and H2O can have on
each other during the char gasification reaction. The results showed no influence of a first gasification atmosphere on the char reactivity under the second one. The char reactivity to a specific gas at a certain conver-sion level was the same as if the gasification reaction was operated from the beginning with the same atmosphere composition. The purpose of this paper is to bring understanding keys to this lack of influence of previous gasi-fication conditions on the char reactivity. Characterization of the chars throughout the conversion by measuring the total surface area and the active surface area was first performed. Then a transport limitation analysis based on the Thiele modulus was considered. It was concluded that the two gasses develop different porosities in the char, however, the Thiele modeling results and active surface area analysis indicate respectively that gasses diffuse preferentially in large macro-pores and that the concentration of active sites evolves similarly during both gasification reactions. This similarity in the diffusion mechanism as well as in the evolution of the concen-tration of active sites could be a plausible explanation for the only-dependent conversion reactivity observed in the gas alternation gasification experiments.
1. Introduction
Biomass gasification is a thermochemical route that allows for converting biomass into a synthetic gas mainly composed of H2and
CO molecules that can be afterwards used for heat and electricity production, or as “buildings blocks” to synthesize biofuels. The term “biomass gasification” encompasses different steps through which the biomass particle is transformed into a Syngas. Inside a gasifier, a biomass particle dries first, then gets pyrolyzed at higher temperature leading to the formation of gasses and a solid char. The pyrolysis gasses as well as the solid char react with the gasification medium (H2O, CO2,
O2or mixtures) to produce more Syngas. The char gasification reaction
is the limiting step during the gasification process, which makes it worthy of studying and understanding.
Char gasification reaction has been widely studied in the literature from a kinetic viewpoint[1]. However, issues related to the gasification phenomenology as well as to complex atmosphere gasification are still not very well understood. There was an increasing number of papers dealing about the char gasification in complex atmospheres with more
than one reacting specie, especially in H2O + CO2atmospheres. The
subject is quite controversial as the conclusions were different from one study to another. A literature overview on this issue is detailed in [2]as well as in[3].
Some authors claimed that H2O and CO2react independently on the
char active sites leading to a char reactivity in a mixed atmosphere which is equal to the sum of the individual reactivities[4–8]:
RðmixÞ¼ RðH2OÞþ RðCO2Þ ðreaction on separate sitesÞ:
Others found that the char reactivity in a mixed atmosphere of H2O
and CO2is lower than the sum of the individual reactivities and claimed
for the competition and/or inhibition mechanisms between the two gasses[9–14]:
RðMixÞbRðH2OÞþ RðCO2Þ ðcompetition and=or inhibitionÞ:
Recent investigations showed that the char reactivity in a mixed atmosphere of H2O and CO2is higher than the sum of the individual
reactivities[15–17]. These authors mentioned that there is synergy between the two gasses resulting from the creation of a wider porosity
⁎ Corresponding author.
by CO2facilitating the access of H2O to the active sites:
RðMixÞNRðH2OÞþ RðCO2Þ ðsynergyÞ:
We intended in our previous investigations to shed light on this issue. We found that the reactivity in mixed atmospheres can be fairly represented by an additivity law for a relatively narrow temperature range of 800–900 °C regardless of the char particle size (0.2 mm up to 13 mm), the pyrolysis heating rate (5–5000 K/min) and the gas atmo-sphere composition. This was observed for a total amount of reacting molecules up to 40% mol[18]. The inhibition was perceived when increasing the reaction temperature above 900 °C. In this case, there were high diffusion limitations and limited active site concentration available for reaction with H2O and CO2. The reactivity in mixed
atmo-spheres was consequently lower than the sum of individual reactivities [2]. In a recent study, Roberts and Harris discussed the lack of consensus in the literature in terms of available active surface and total reacting gas partial pressure. The combination of these two parameters would define the nature of the mixed atmosphere gasification mechanism. For low pressure ranges and high active surface, the mechanism would tend to additivity, while for high pressure ranges and/or small active surface area, the mechanism shifts to competition. The authors also require awareness of the regime in which the gasification reaction is performed, in the sense that the gasification reaction mechanisms could only be understood in cases where the reaction is performed in the chemical regime[3].
Concerning the synergy mechanism found in some studies, there would be real interest in studying the influence that a gas can have on the char reactivity towards another gas. For instance, some authors think that CO2would create a wider porous network that facilitates
the access of H2O to the carbon active sites and would therefore
enhance the gasification reaction[15–17].
In the specialized literature concerning the physical activation of carbonaceous materials by gasification with CO2or H2O, many authors
found that the two gasses develop different porosities when reacting with the solid char[19–23]. For instance, Roman et al.[21]found that during the gasification of olive stones with CO2, H2O or their mixtures,
the volume of micropores and mesopores increased continuously. However, the porosity development occurs in a different proportion whether CO2or steam is used. In fact, CO2produces narrow micropores
on the carbons and widens them with time while steam yields pores of all sizes from the early stages of the process. The authors found also that the simultaneous use of H2O and CO2yielded carbons with higher
volumes of pores.
Owing to these findings, there may be synergistic effects between the two gasses and enhanced internal diffusivity as proposed previously for mixed atmosphere gasification in H2O and CO2[15–17]. In this work,
the main purpose is to study the mutual influences of H2O and CO2on
the char gasification reactivity, and to evaluate the impact of a prior gasification with CO2on the char reactivity to H2O and vice versa. This
approach is insightful since it will provide valuable information on the action of each gas (H2O or CO2) on the char properties and its effects
on the reactivity towards another gas in practical gasification condi-tions. The present study concerns two cases for which the diffusional limitations are present. These diffusional limitations are quite low in the first one and very high in the second one.
2. Materials and methods
2.1. Low heating rate chars preparation
The raw biomass sample consists of beech wood spheres with a 20 mm diameter. Low heating-rate chars were prepared by a slow pyrolysis of the wood spheres under nitrogen. The pyrolysis was performed in a batch reactor. The wood spheres were placed on a metal-lic plate, spaced far enough to avoid chemical and thermal interactions.
The plate was introduced into the furnace heated zone, which was progressively heated under nitrogen from room temperature to 900 °C at 5 °C/min. The chars were kept for 1 h at the final temperature, cooled under nitrogen and stored afterwards in a sealed container. The low heating rate is expected to ensure a good temperature uniformity in the wood particle and to lead to a quite homogeneous wood-char, from the structural and chemical viewpoints[2,24,25]. During the pyrolysis reaction, the char particles shrink and get an ovoid form. The mean particle diameter, calculated as the average of the three particle dimensions was estimated at 13 mm. To ensure the chemical and struc-tural homogeneity inside the 13 mm char particle, the char structure and chemical composition were analyzed at three locations: at the surface, at half the distance from the center and at the center. These analytical tests showed that the char particles had a quite good volu-metric homogeneity. The beech wood char proximate and ultimate analyses are presented inTable 1.
A selected amount of the obtained 13 mm char particles was after-wards ground with a mortar and a pestle. Several particle size fractions, on a wide particle size range from 0.04 mm to 13 mm, were retained for gasification experiments. In this study, the gasification of char particles of 0.2 mm (char02), and 13 mm (char13) in H2O and CO2was
investi-gated in gas alternation gasification experiments. 2.2. Char gasification experiments in H2O and CO2
The char gasification with H2O and CO2was performed in the
Macro-TG experimental device. The M-Macro-TG device is described in detail in[18]. In general terms, the experimental apparatus consists of a 2-m long, 75-mm i.d. alumina reactor that is electrically heated, a weighing system compris-ing an electronic scale havcompris-ing an accuracy of ±0.1 mg and a metallic stand placed over the scale on which a 1 m long, 2.4 mm external diameter hol-low ceramic tube is fixed. The ceramic tube holds the platinum basket in which the char particles are placed. Steam is generated inside an evapora-tor and the gas flow rates are controlled by means of mass flowmeters/ controllers. The gas flow inside the reactor is laminar and flowing at an average velocity of 0.20 m/s. H2O and CO2are diluted with nitrogen to
reach the desired concentrations.
The platinum basket bearing the char particles and the ceramic tube are initially at room temperature. They are introduced into the hot reac-tor zone (which is at the gasification temperature) within less than 20 s, under a flow of nitrogen. The system has to get stabilized thermally as well as mechanically (due to the force of the flowing nitrogen over the basket) so that the mass displayed by the electronic scale becomes constant. This can be achieved within 5 min. Afterwards, the gasification medium is introduced.
In gas alternation gasification experiments, reactive atmosphere is switched at a certain conversion level from a gas to a second one. The gas alternation gasification experiments were done at 900 °C on the Char02 particles as well as on the Char13. In the former case, there are quite low diffusional limitations while in the second one, the diffusional limitations are quite high[2]. The analysis of the char reactivity curves during gas alternation gasification experiments will help to assess the influence of a gas on the char reactivity towards the second one.
The char apparent reactivity towards a gas can be expressed as follows: Rð ÞX ¼ −1 mð Þt dmð Þt dt ¼ 1 1−Xð Þt dXð Þt dt : Table 1
Ultimate analysis of the beech-char samples (wt.% on a dry basis).
C H O N Ash
Here X is the conversion level given by: Xð Þt ¼
mð Þ0−mð Þt
mð Þ0
:
The calculations are made on a dry ash-free basis.
Char02 and Char13 particles were gasified in three different atmospheres: H2O (0.2 atm H2O/0.8 atm N2), CO2 (0.2 atm CO2/
0.8 atm N2) and alternating atmospheres.
2.3. Characterization of textural properties and active surface area of the chars
The char gasification is a quite complex reaction involving mass and heat transfer, structural, chemical and textural char modifications as well as catalytic surface reactions. These phenomena are quite difficult to monitor along the reaction. In order to analyze the mutual influences between the two gasses, two major phenomena governing the gasifica-tion reacgasifica-tion that can be affected when switching from CO2to H2O or
vice versa were considered:
• Gas diffusion inside the char particle. • Reaction on the active sites.
2.3.1. Gas diffusion inside the char
When reacting with the char, CO2or H2O molecules modify their
texture by carbon removal following the global gasification reactions of: C þ H2O→H2þ CO
C þ CO2→2CO:
Textural modifications of carbonaceous materials by physical activa-tion with CO2or H2O were well examined in the literature[20]. The
porosity of the char increases with the gasification extent. However, depending on the nature of the gas (CO2, H2O, O2or their mixture),
the porosity as well as the pore size distribution do not evolve in a similar way[19–23]. Textural modifications during gasification impact directly on the internal gas diffusion process by the creation of small or large pores, widening others or opening closed ones. Therefore, different textural properties imply different gas diffusivities.
Hence, it is possible to imagine that during gas alternation gasifica-tion experiments, the gas diffusion process would be directly impacted when switching from a gas to another due to the difference in the nature of porosity resulting from the reaction of the char with CO2or H2O.
Therefore, it is interesting to assess the char texture evolution during both gasification reactions. For this purpose, the gasification reactions of Char02 were stopped at 20%, 50% and 70% of conversion and the textural properties of the char were analyzed by N2adsorption at
−196 °C using a Micromeritics ASAP 2420 instrument. Prior to the anal-ysis, the chars were outgassed overnight in vacuum at 300 °C. The total surface area (TSA) of the samples was assessed by the standard Brunauer–Emmett–Teller (BET) (software available in the ASAP 2020) method using the adsorption data in the relative pressure ranging from 0.01 to 0.1. The total pore volume was calculated by converting the amount of nitrogen adsorbed at a relative pressure of 0.995 to the volume of liquid adsorbate.
Pore size distribution (PSD) is an important textural property that reflects the nature of porosity developed under both gasses during the gasification reaction. PSDs of the different chars were calculated by the density functional theory (DFT) using a model for slit pores with finite size provided by Micromeritics[26].
2.3.2. Reaction on active sites
After the internal diffusion, H2O or CO2reacts on the char active sites
whose number and types evolve along the gasification. When switching
from one gas to the other, the nature and number of these active sites would directly impact the char reactivity towards the second gas. It would be therefore very interesting to quantify these active sites.
One method is to measure an active surface area (ASA) of the chars along the gasification reactions with H2O and CO2. The ASA of the
bio-mass chars was determined following the method of Laine et al.[27] consisting of O2chemisorption on the char sample at 200 °C. This
meth-od was initially developed for the char-O2reaction. We propose here
that the ASA could be indicative of the active site concentration during H2O and CO2gasification.
In a typical ASA measurement run, 20 mg of char is placed in a quartz crucible inside a tubular reactor. The reactor is first outgassed in a primary vacuum down to 1 mm Hg of pressure, and then in a second
step to a secondary vacuum down to 10−4mm Hg of pressure by
means of a turbo-molecular pump. The char sample in the crucible is afterwards heated up to 900 °C at a constant rate of 5 °C/min and kept at this final temperature during 1 h. The char sample surface is “cleaned” during this step. Afterwards, the char sample is cooled down to 200 °C, keeping the reactor under vacuum. When the temperature stabilizes, oxygen is introduced (pressure close to 0.5 mm Hg) and chemisorbed on the char surface for a period of 15 h leading to the formation of sur-face oxygen complexes. After the chemisorption step, a Temperature Programmed Desorption experiment is performed and the oxygenated char sample is heated up to 900 °C with a constant heating rate of 10 °C/min and kept for 20 min at this final temperature. CO and CO2
are emitted and are analyzed by means of a mass spectrometer. The ASA (m2/g) of a char sample is calculated using the following equation:
ASA ¼nOσONA
mchar :
nOis the total number of oxygen moles obtained from the time
inte-gration of the TPD curves.
NAis the Avogadro number and σOis the cross sectional area of an
oxygen atom (0.083 nm2).
3. Results and discussion
In the present study, two cases are considered for the study of the mutual influences of H2O and CO2during the gasification reaction:
○ The case of low diffusional limitations in which the gasification is performed in a near-chemical regime.
○ The case of high diffusional limitations in which the gasification is limited by the internal mass transfer of the gasses.
For the former case, the effectiveness factor η, which is the ratio between the apparent reactivity and the intrinsic one, is around 0.9 while it is around 0.05 for the high diffusion limitation case. These results were obtained by reactivity modeling following the Thiele model. The reader can refer to our previous investigations for more de-tails[2].
3.1. Gas alternation gasification experiments 3.1.1. The case of low diffusional limitations
The results of gas alternation gasification experiments for the 0.2 mm char particles are shown inFig. 1. In this figure, the reference char reactivities with CO2and H2O (full lines) are shown with those
obtained in the gas alternation experiments (dotted line). Converting the char up to 20% of conversion with CO2does not modify its reactivity
towards H2O. The char reactivity follows in the beginning the reference
reactivity curve with CO2, then joins the one obtained in H2O when
switching to H2O atmosphere.
In the case of low diffusional limitations, there is almost no gas concentration gradient along the char particle radius. H2O or CO2
molecules have enough time to diffuse in the char particle and the char reactivity is representative of the chemical reactivity of the active sites located at the char surface. The char reactivity is hence directly related to the concentration of active sites in the char surface. A way to quantify these active sites is, as explained in theMaterials and methodssection, to measure the ASA by O2chemisorption.
3.1.2. The case of high diffusional limitations
Gas alternation gasification experiments were done at two different scales: on char particles of 0.2 mm and on char particles of 13 mm. For the 0.2 mm char particles, diffusional limitations are quite small while they are quite important for the 13 mm char particle[2]. The experi-ments have been reproduced at least three times. The reactivity curves are the mean ones. Standard deviations were also calculated along the conversion. Only some of the standard deviations are reproduced in the curve along the conversion for figure clarity reasons. It was observed that increasing the particle size from 0.2 to 13 mm resulted in a decrease of the mean reactivity by almost 20 times. Since the gasification time
was long enough (total conversion time near 80 min for H2O
gasifica-tion and near 160 min for CO2gasification), it was possible to perform
several changes, alternating H2O and CO2as reacting gasses many
times. The obtained results are shown inFig. 2. In this figure, the char reactivities in single atmospheres (20% CO2 and 20% H2O in N2)
as well as the reactivity obtained in gas alternation gasification experi-ments are plotted. The reactivity curves in the cyclic gasification exper-iment jump from a reference curve to the other one when switching the gasses, whatever the conversion level. The reactivity curve in the cyclic gasification experiment superposes to the reference reactivity curves each time the gasification atmosphere is switched. Small deviations are observed in the advanced conversion level, but still in the standard deviation zone of the experiments. It can be clearly observed that the char reactivity does not depend on the gasification background. Gasify-ing the char with CO2to a defined conversion level does not modify its
reactivity towards H2O when switching the gasses. This effect is
recipro-cal. Altogether, the char reactivity towards a gas is here only conversion dependent: at a defined conversion level the char reactivity is constant whatever the gasification background is.
These results are new in literature, especially those concerning the cyclic gasification of large char particles. To the best knowledge of the authors, no study has previously dealt with this kind of experiments or reported such results concerning the char gasification in complex atmospheres.
In a previous study, similar results were obtained for gas alternation gasification experiments on 1 mm thick chars gasification with CO2
followed by H2O. The reactivity of the char was only conversion
depen-dent regardless of the pyrolysis heating rate with which the char was produced[18]. To sum up, the only conversion dependent reactivity was found to be valid for low heating rate and high heating rate chars, as well as for small and large char particles. These results were unex-pected since it is known from the literature that the two gasses, when reacting with a solid carbonaceous material, do not develop the same porosity, which has an impact on the diffusion process and hence on the char reactivity. In order to explain these observations, we have analyzed the evolution of the ASA and textural properties along the conversion for the 0.2 mm chars for which the gasification is performed in a near chemical regime.
3.2. Characterization of chars: active surface area and textural properties 3.2.1. Concentration of active sites along the gasification under H2O and
CO2
An example of mass spectrometer analysis of CO and CO2desorbed
from the X20-CO2-char surface after oxygen chemisorption is shown
inFig. 3. It was observed for all chars that CO2desorption begins at a Fig. 1. Gas alternation gasification experiments for 0.2 mm char particles at 900 °C (GS: gas
shift).
Fig. 2. Gas alternation gasification experiments for 13 mm char particles at 900 °C (GS: gas shift).
Fig. 3. CO2(solid lines) and CO (dashed lines) measured by mass spectrometry during the
lower temperature than CO desorption, at around 180 °C, and finishes at around 800 °C. CO2is thought to originate from carboxylic acid
func-tions formed on the char surface, while CO is emitted during the thermal degradation of more stable surface functions such as quinones[28]. The CO2signal shows a peak at around 330 °C while the CO signal shows the
maximum peak at a higher temperature of 850 °C.
The ASA results are plotted inFig. 4. This figure shows that for both gasification reactions, the ASA evolves in a similar way. The ASA shows a global trend of increase with conversion for both types of chars. It increased from 45 m2/g for the non-gasified char to 58 m2/g
and 59 m2/g at 70% of conversion respectively for CO
2-char and H2
O-char. At a defined conversion level, the ASA values of the different chars were very close to each other. Despite the ASA's being an index of the char reactivity towards O2as proposed by Laine et al.[27], it
remains a good index to evaluate the concentration of active sites avail-able for the gasification reaction during H2O and CO2gasification.
The char reactivity with H2O is higher than that obtained with CO2.
In the literature, there is an agreement that steam gasification is faster
than CO2gasification. However, the ratio between the two reactivities
is found to vary between 2 and 5[1]. This disparity can be attributed to the difference in the raw biomasses as well as to the differences between experimental devices or to the potential diffusional limitations that may exist. In the chemical regime, where no diffusional limitations exist, the gasification reaction rate is related to the rate of CO2or H2O
adsorption and C-(O) complex desorption, causing the char mass loss. The difference in the char reactivities towards H2O and CO2results
from the difference in the adsorption and desorption processes. In a quite recent study[29], the authors found that at 900 °C, the de-sorption of C(O) from the char-C reactions with O2,CO2or H2O could be
modeled using the same activation energy and pre-exponential factor. In this case, the adsorption rate of CO2was around 11 times lower
than that of H2O. This finding implies that the difference between the
char reactivity towards H2O and CO2is related to the lower adsorption
rate of CO2on the char surface. Also, it was demonstrated in a recent
work that CO2and H2O are likely to attack the same sites on a lignite
char surface, which supports further our findings[30].
Leaning on these observations, the similarity in the concentration of active sites during both gasification reactions is a plausible explanation to only conversion-dependent reactivity of the char when changing the gasification atmosphere. When switching from CO2to H2O, H2O
mole-cules find the same concentration of active sites to react on and hence the char exhibits the same reactivity. Moreover, the difference of the char reactivity towards CO2and H2O may be explained by the fact that
the active sites on the char surface do not have the same chemical reactivity towards these two molecules, especially during the adsorp-tion process, according to[29].
3.2.2. Textural properties of the chars along gasification under CO2and H2O
atmospheres
N2adsorption isotherms of the ref-char, CO2-chars and H2O-chars
along the conversion are shown inFig. 5. The isotherms are presented in log scale to show the low pressure data which correspond to the adsorption in micropores.
The N2uptake increases with the extent of conversion for all chars
indicating the extension of porosity due to the gasification reaction.
Fig. 5. N2adsorption isotherms for H2O and CO2chars along the gasification reaction for the 0.2 mm chars.
The isotherms are close to the type I for all the chars, indicating that those chars are almost microporous and that the TSA resides in the micropores[31,20]. Moreover, adsorption isotherms show the conver-sion up to 20% leads to the increase of the adsorbed volume over the whole relative pressure range 10−7–10−1. This corresponds to the
development of all pore sizes between 0 and 2 nm. Above 20% of burn-out, the development of porosity proceeds mainly through the increase of the larger micropores (relative pressures between 10−4and 10−1)
while the ultra-micropores are only slightly modified. For an equivalent conversion level, the N2volume adsorbed in micropores for H2O-chars
is higher than for CO2-chars. This indicates that the gasification with
H2O is more volumetric than CO2gasification. H2O molecules would
dif-fuse much more easily inside the char matrix than CO2molecules which
react more on the surface. Furthermore, H2O-chars show the presence
of mesopores especially at 50% and 70% of conversion where the adsorp-tion and desorpadsorp-tion isotherm show hysteresis loops (P/P0 = 0.42–1).
The calculated TSA of the different chars are shown inTable 2. As expected, H2O-chars show a higher TSA than CO2-chars for equivalent
conversion level.
The pore size distributions of the different chars computed by DFT confirm the previous observations (Fig. 6). For a conversion level of 20%, there is a development of micropores of 6 Å for both types of chars. The increase of ultra-micropore volume (pores less than 8 Å) with the extent of reaction for both types of chars demonstrates the presence of some diffusional limitations during the gasification reac-tions. Beyond 20% of conversion, one can notice the development of 11 Å micropores in the case of H2O gasified chars, while we notice the
formation of larger micropores and of small mesopores for the CO2
gasified chars (bimodal distribution). At a higher conversion level of 70%, CO2continues to develop almost the same porosity as at 50% of
conversion, while the development of a larger mesoporosity in the range of 80–240 Å is observed in the case of H2O gasification.
These results are in accord with those found in the literature concerning biomass char activation with H2O and/or CO2: the textural
properties of the chars evolve differently under the two gasses. 3.2.3. The influence of textural properties on the gasification reaction rate 3.2.3.1. The relationship between TSA and reactive surface.If the TSA was directly impacting the reactivity, it would be logical to observe a lower reactivity with H2O after gasification with CO2, and a higher
reac-tivity with CO2after gasification with H2O, which is not the case.
At-tempts to relate the char reactivity to the TSA were unfruitful and did not lead to convenient conclusions. Several authors mentioned that mesoporosity is more indicative of the char reactivity as they reconciled their char–steam reactivity data better with the extent of mesoporosity in the char than with the one of micro porosity[32]. Only a small portion of the available surface area is active for the reaction and constitutes the carbon active surface. Some authors have demonstrated this fact by measuring the active surface area or reactive surface area along the char gasification reactions with O2, CO2or H2O and found them to be a
representative index of the char reactivity[33,34].
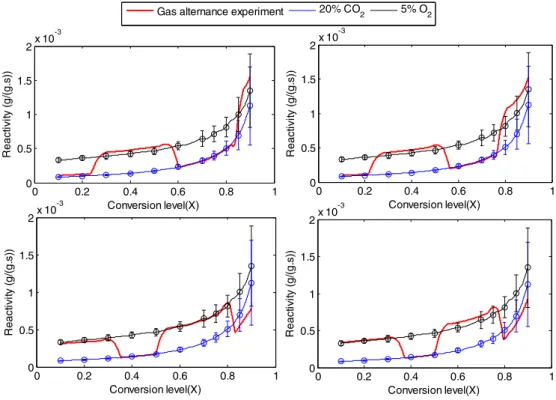
We were curious about this weak relationship between the char reactivity and the TSA, so that we experimented with an extreme case where H2O was replaced by O2which reacts mainly on the external
sur-face. The gas alternation gasification experiments were performed with 20% CO2in N2and 5% O2in N2on the 13 mm char particles at 900 °C.
This experiment was repeated 4 times with different times in which
the gasses were switched. The results are shown inAppendix 1. Similar trends were obtained as for the experiments in which H2O and CO2
were alternated: the char reactivity does not depend on the conversion background. Besides, the gasification reaction with O2was stopped at
the same conversion levels (20%, 50% and 70%). The O2-char particles
were found to shrink along the conversion and an ash layer was formed around the char particle. The O2chars as well as the CO2chars were
af-terwards slightly crushed for TSA analysis. The obtained TSA have to be seen as average values on the whole char particle. Along the conversion, the TSA of O2-chars were found to be twice lower than those of CO2
-chars for equivalent conversion levels (seeAppendix 1). Despite the de-veloped TSA under O2are quite lower than those obtained during CO2
gasification, it does not have an influence on the char reactivity when switching from O2to CO2or vice versa. These results show clearly that
the TSA measured with N2adsorption at −196 °C should not be taken
as a reactivity index for biomass chars.
3.2.3.2. The relationship between PSD and gas transport inside the char. Porosity and PSD do not evolve similarly under CO2and H2O. This
might impact the gas diffusion inside the char in the case of a mass transfer limited situation. If it was the case, there would have been an impact on CO2 diffusion after char gasification with H2O and vice
versa, which would impact directly the gasification reaction rate. However, in our previous investigation, the Thiele modulus approach was adopted to determine the class of pores that govern the gas diffusion process during the gasification reaction. The adopted model was able to predict very well the experimental reactivities in a temperature range of 800 to 950 °C and in a large particle size range from 0.04 mm to 13 mm. The modeling results evidenced that for both gasification reactions, H2O and CO2diffuse preferably in large
macropores[2]. Fixing the pore size to other values in the mesopore
Table 2
TSA evolution during CO2and H2O gasification of 0.2 mm char at 900 °C.
Conversion level (%) 0 20 50 70
TSA in H2O gasification (m2/g) 437 866 1225 1334
TSA in CO2gasification (m2/g) 437 669 842 1028
Fig. 6. DFT pore size distributions of the different 0.2 mm chars during H2O gasification
and micropore ranges showed that the model could not predict correct-ly the experimental results. The activation energies for both reactions were about 200 kJ/mol which is in very good accord with the literature [1]; this attests to the quality of the model. The contribution of micro-pores and mesomicro-pores to the gas diffusion process is therefore thought to be negligible compared to that of macropores. The two gasses are thought to preferably diffuse and react in macropores.
Altogether, the similarities in the ASA evolution (which is related to the number of active sites on the char surface) as well as in the gas diffusion mainly occurring in the macroporosity for both gasification reactions, may explain the non-changing reactivity when switching from CO2to H2O atmosphere and can explain the observations made
for the gas alternation gasification experiments. 4. Conclusion
The present study was performed with the aim to better understand the beech wood char gasification in complex atmospheres of H2O and
CO2. More precisely, we were interested in investigating the effects of
textural and active site concentration modifications occurring on the char along the reaction with H2O on its reactivity towards CO2, and
reciprocally.
Gas alternation gasification experiments with CO2and H2O were
performed on small (0.2 mm) and large (13 mm) beech char particles. In both cases, the char reactivity at a defined conversion level was found not to depend on the gasification background and was only conversion-dependent.
We analyzed this lack of influence of the gasification background leaning on reactivity modeling results based on the Thiele modulus ap-proach[2], as well as on the textural and active site concentration analysis on chars along the gasification with H2O and CO2. Combined, these
differ-ent data enabled us to provide a plausible explanation to the experimen-tal observations concerning the only conversion-dependent reactivity.
At equivalent conversion levels, we found textural differences be-tween the chars gasified in H2O and CO2in terms of TSA and PSD.
Nev-ertheless, the concentration of active sites for the gasification reaction was similar for both types of chars at the same conversion levels.
Referring to the char reactivity modeling results, we found that both H2O and CO2diffuse mainly in the macroporosity [2]. The textural
differences between H2O and CO2would not have a substantial effect
on the diffusion process as they are mainly related to the micro and meso-porosity.
Leaning on these observations, we propose that when switching from a gas to another, the gas diffusion continues to occur mainly in macropores and the gas (CO2or H2O) finds a similar concentration of
active sites to react on. Combined, these two characteristics lead to a char reactivity which does not depend on the gasification background both in low and high diffusional limitations cases. This explanation should not hide the complexity of the gasification reaction, but should rather constitute a step forward to understand its mechanisms. Further work is undoubtedly needed to shed light on it.
Acknowledgments
The authors are very thankful to Joseph Dentzer and Habiba Nouali for their great help in TPD-ASA and char textural analysis.
Fig. 8. Ratio of TSA measured on CO2-chars and O2chars (13 mm chars) along the
conversion.
Appendix 1. Gas alternation gasification experiments with CO2and
O2
Gas alternation gasification experiments were performed on 13 mm char particles with CO2and O2. The reader can observe that the
reactiv-ity is here again only conversion dependent (Fig. 7) despite the differences measured on the TSA of chars along the conversion with CO2and O2respectively (Fig. 8).
References
[1] C. Di Blasi, Combustion and gasification rates of lignocellulosic chars, Prog. Energy Combust. Sci. 35 (2) (Apr. 2009) 121–140.
[2] C. Guizani, F.J. Escudero Sanz, S. Salvador, Influence of temperature and particle size on the single and mixed atmosphere gasification of biomass char with H2O and CO2,
Fuel Process. Technol. (Feb. 2015) 1–14 (in press).
[3] D.G. Roberts, D.J. Harris, Char gasification kinetics in mixtures of CO2and H2O: the
role of partial pressure in determining the extent of competitive inhibition, Energy Fuel 28 (2014) 7643–7648.
[4] R.C. Everson, H.W.J.P. Neomagus, H. Kasaini, D. Njapha, Reaction kinetics of pulver-ized coal-chars derived from inertinite-rich coal discards: gasification with carbon dioxide and steam, Fuel 85 (7–8) (May 2006) 1076–1082.
[5] Z. Huang, J. Zhang, Y. Zhao, H. Zhang, G. Yue, T. Suda, M. Narukawa, Kinetic studies of char gasification by steam and CO2in the presence of H2and CO, Fuel Process.
Technol. 91 (8) (Aug. 2010) 843–847.
[6] H.-L. Tay, S. Kajitani, S. Zhang, C.-Z. Li, Effects of gasifying agent on the evolution of char structure during the gasification of Victorian brown coal, Fuel 103 (Apr. 2013) 22–28.
[7] S. Nilsson, A. Gómez-Barea, D. Fuentes-Cano, M. Campoy, Gasification kinetics of char from olive tree pruning in fluidized bed, Fuel 125 (February) (Jun. 2014) 192–199.
[8] S. Nilsson, A. Gómez-Barea, D.F. Cano, Gasification reactivity of char from dried sewage sludge in a fluidized bed, Fuel 92 (1) (Feb. 2012) 346–353.
[9] T. Liliedahl, K. Sjöström, Modelling of char–gas reaction kinetics, Fuel 76 (1) (1997) 29–37.
[10] D.G. Roberts, D.J. Harris, Char gasification in mixtures of CO2and H2O: competition
and inhibition, Fuel 86 (17–18) (Dec. 2007) 2672–2678.
[11] C. Chen, J. Wang, W. Liu, S. Zhang, J. Yin, G. Luo, H. Yao, Effect of pyrolysis conditions on the char gasification with mixtures of CO2and H2O, Proc. Combust. Inst. 34 (2)
(Aug. 2013) 2453–2460.
[12] R. Zhang, Q.H. Wang, Z.Y. Luo, M.X. Fang, K.F. Cen, Competition and Inhibition Effects during Coal Char Gasification in the Mixture of H2O and CO2, 2013.
[13] S. Umemoto, S. Kajitani, S. Hara, Modeling of coal char gasification in coexistence of CO2and H2O considering sharing of active sites, Fuel 103 (Jan. 2013) 14–21. [14]M. Barrio, Experimental Investigation of Small-scale Gasification of Biomass, The
Norwegian University of Science and Technology, 2002.
[15] H.C. Butterman, M.J. Castaldi, Influence of CO2injection on biomass gasification, Ind.
Eng. Chem. Res. 46 (26) (2007) 8875–8886.
[16] J.P. Tagutchou, Gazéification du charbon de plaquettes forêstières: particule isolée et lit fixe continu, Cirad, ED 305. , Université de Perpignan, 2008.
[17] J.P. Tagutchou, L. Van de steene, F.J. Escudero Sanz, S. Salvador, Gasification of wood char in single and mixed atmospheres of H2O and CO2, Energy Sources, Part A 35
(13) (Jul. 2013) 1266–1276.
[18] C. Guizani, F.J. Escudero Sanz, S. Salvador, The gasification reactivity of high-heating-rate chars in single and mixed atmospheres of H2O and CO2, Fuel 108 (Jun. 2013)
812–823.
[19] M. Molina-Sabio, M. Gonzalez, F. Rodriguez-reinoso, Effect of steam and carbon dioxide activation in the micropore size distribution of activated carbon, Carbon N. Y. 6223 (4) (1996) 505–509.
[20] H. Marsh, F. Rodriguez-reinoso, Activated Carbon, Elsevier Science & Technology Books, 2006. 542.
[21] S. Román, J.F. González, C.M. González-García, F. Zamora, Control of pore develop-ment during CO2and steam activation of olive stones, Fuel Process. Technol. 89
(8) (Aug. 2008) 715–720.
[22] J.M.V. Nabais, P. Nunes, P.J.M. Carrott, M.M.L. Ribeiro Carrott, A.M. García, M.A. Díaz-Díez, Production of activated carbons from coffee endocarp by CO2and steam
activation, Fuel Process. Technol. 89 (3) (Mar. 2008) 262–268.
[23] F. Rodriguez-Reinoso, M. Molina-sabio, M.T. Gonzalez, The use of steam and CO2as
activating agents in the preparation of activated carbons, Carbon N. Y. 33 (1) (1995) 15–23.
[24] T. Pattanotai, H. Watanabe, K. Okazaki, Experimental investigation of intraparticle secondary reactions of tar during wood pyrolysis, Fuel 104 (Feb. 2013) 468–475.
[25] T. Pattanotai, H. Watanabe, K. Okazaki, Gasification characteristic of large wood chars with anisotropic structure, Fuel 117 (Jan. 2014) 331–339.
[26] J. Jagiello, J.P. Olivier, 2D-NLDFT adsorption models for carbon slit-shaped pores with surface energetical heterogeneity and geometrical corrugation, Carbon N. Y. 55 (2) (Apr. 2013) 70–80.
[27] N. Laine, F. Vastola, P. Walker, The importance of active surface area in the carbon– oxygen reaction, J. Phys. Chem. 67 (1963) 2030–2034.
[28] P. Brender, R. Gadiou, J.-C. Rietsch, P. Fioux, J. Dentzer, A. Ponche, C. Vix-Guterl, Characterization of carbon surface chemistry by combined temperature programmed desorption with in situ X-ray photoelectron spectrometry and tem-perature programmed desorption with mass spectrometry analysis, Anal. Chem. 84 (5) (Mar. 2012) 2147–2153.
[29] O. Karlström, A. Brink, M. Hupa, Desorption kinetics of CO in char oxidation and gasification in O2, CO2and H2O, Combust. Flame 162 (3) (Mar. 2015) 788–796. [30] F. Scala, Fluidized bed gasification of lignite char with CO2and H2O: a kinetic study,
Proc. Combust. Inst. 35 (3) (2015) 2839–2846.
[31] S. Lowell, J. Shields, Powder Surface Area and Porosity, 3rd ed. Chapman and Hall, 1991. 250.
[32] F. Mermoud, S. Salvador, L. Vandesteene, F. Golfier, Influence of the pyrolysis heating rate on the steam gasification rate of large wood char particles, Fuel 85 (10–11) (Jul. 2006) 1473–1482.
[33] A. Lizzio, H. Jiang, L.R. Radovic, On the kinetics of carbon (char) gasification: reconciling models with experiments, Carbon N. Y. 28 (I) (1989) 7–19.
[34] W. Klose, M. Wolki, On the intrinsic reaction rate of biomass char gasification with carbon dioxide and steam, Fuel 84 (7–8) (May 2005) 885–892.