HAL Id: hal-02927962
https://hal-mines-albi.archives-ouvertes.fr/hal-02927962
Submitted on 8 Sep 2020
HAL is a multi-disciplinary open access
archive for the deposit and dissemination of
sci-entific research documents, whether they are
pub-lished or not. The documents may come from
teaching and research institutions in France or
abroad, or from public or private research centers.
L’archive ouverte pluridisciplinaire HAL, est
destinée au dépôt et à la diffusion de documents
scientifiques de niveau recherche, publiés ou non,
émanant des établissements d’enseignement et de
recherche français ou étrangers, des laboratoires
publics ou privés.
Co-pyrolysis of coal and raw/torrefied biomass: A
review on chemistry, kinetics and implementation
Saartjie M. Gouws, Marion Carrier, John Reginald Bunt, Hein W.J.P.
Neomagus
To cite this version:
Saartjie M. Gouws, Marion Carrier, John Reginald Bunt, Hein W.J.P. Neomagus. Co-pyrolysis of
coal and raw/torrefied biomass: A review on chemistry, kinetics and implementation. Renewable
and Sustainable Energy Reviews, Elsevier, 2021, 135, pp.1-24/110189. �10.1016/j.rser.2020.110189�.
�hal-02927962�
Co-pyrolysis of coal and raw/torrefied biomass: A review on chemistry,
kinetics and implementation
S.M. Gouws
a, M. Carrier
b, J.R. Bunt
a,*, H.W.J.P. Neomagus
aaCenter of Excellence in Carbon-based Fuels, School of Chemical and Minerals Engineering, North West-University, Potchefstroom, 2520, South Africa
bRAPSODEE, CNRS UMR 5203, Universit´e de Toulouse, IMT Mines Albi, Campus Jarlard, 81013, Albi CT Cedex 09, France
Keywords: Co-pyrolysis Biomass Coal Torrefaction Chemistry Kinetics A B S T R A C T
Thermochemical conversion via co-pyrolysis has the potential to be an efficient route for converting biomass to bio-energy and bio-refinery products. In this review, the implementation of co-pyrolysis of torrefied biomass and coal was critically assessed against co-pyrolysis of raw biomass and coal from both a fundamental and engi-neering perspective. This evaluation showed fundamental advantages for torrefaction of biomass prior to co- pyrolysis such as a decrease in mass and heat transfer limitations due to an increase in permeability and ther-mal conductivity of biomass. Co-pyrolysis volatiles may also be upgraded through the catalytic activity of the torrefied biomass surface, producing higher quality oil. Due to properties more similar to coal, torrefied biomass requires less energy for milling (lower operating costs) and can be more easily blended with coal in reactor feeding systems. A state-of-the-art research on co-pyrolysis kinetics revealed that reactivities of blends may be predicted from kinetic parameters of individual feedstocks using an additive approach. To conclude on the preferred reactor design for this process, different reactors were evaluated based on heat transfer mode, oper-ation and product formoper-ation. Although both the fluidized bed and rotating cone reactor provide high oil yields, the rotating cone has been more successful commercially. This design shows great promise for specifically co- pyrolysis due to the intimate contact that may be achieved between fuels to maximize synergy. The co- pyrolysis of torrefied biomass and coal may be encouraged from a scientific point of view, however further research is recommended on the effective integration of torrefaction and co-pyrolysis technologies.
1. Introduction
The production of affordable, sustainable and clean energy is a cornerstone for global socio-economic growth [1]. The total world en-ergy consumption is expected to rise a further 28% by 2040 [2]. Fossil fuels are a widely available energy source, however this source of energy production is associated with large amounts of greenhouse gas (GHG) emissions, a driver of climate change [3]. At COP25 2019, the urgency for countries to improve their emission reduction strategies was highlighted.
Considering the need that faces governmental agencies to decrease GHG emissions, quick implementation of mature green technologies is required. Technologies utilizing fossil fuels such as coal are well estab-lished, however one of the important contributions to GHG reduction from industry is the shift towards renewable feedstocks [4]. Patel and co-workers [3] recently reviewed the techno-economic and life cycle assessment of thermochemical conversion technologies and suggested
that the implementation of biomass primarily depends on the cost competitiveness of biomass-based energy and chemicals compared to those derived from fossil fuels. They concluded that the cost of bioenergy-based technologies remains higher.
To stimulate the transition to bioenergy-based technologies, a reduction in process costs is required. This may be achieved by improving the efficiency of these technologies regarding energy and chemical production and GHG abatement [5]. To improve the existing industrial technology, a thorough understanding of thermochemical conversion processes is required. The pyrolysis process is the starting point of all these technologies, however stand-alone pyrolysis technol-ogy has also attracted wide attention [6]. This technology is being extensively developed in the bioenergy area for significant potential to co-generate energy and chemicals [7].
The scientific and industrial community’s interest in the pyrolysis process has increased significantly over the past few decades. The amount of scientific documents published on pyrolysis using either coal or biomass as feedstock for different years is shown in Fig. 1. It can be
* Corresponding author.
observed that research in both coal and biomass pyrolysis processes has increased significantly since the 1960s. The oil crises in the 1970s have intensified development in these areas, however since the late 1990s an exponential shift towards biomass pyrolysis research is evident with the signatures of conventions and protocols (Fig. 2). The increased aware-ness of environmental issues related to fossil fuel usage in the twenty first century and resulting calls for clean and renewable energy sources is the main reason for the observed shift in scientific interest [8]. Research in coal pyrolysis has become less popular compared to biomass pyrolysis in the twenty first century, however an increase is still evident in countries with high coal reserves such as China [9].
A viable option for industrial thermochemical conversion technolo-gies to transition to renewable feedstocks is the co-utilization of ligno-cellulosic biomasses with coal as feedstock in existing coal-based processes [11,12]. For pyrolysis technologies, in particular, the co-utilization of biomass and coal has become an attractive option not merely due to a reduction in the carbon footprint of the overall process [13], but also due to the potential of producing higher oil yields with improved quality (composition closer resembling crude-oil) [14].
During co-pyrolysis, the hydrogen released from biomass stabilizes the large radicals produced from coal resulting in improved oil quality and yields [15] (See Section 3 for further details). Several authors have reviewed co-pyrolysis of biomass and coal along with other feedstocks such as waste plastics and tyres [6,16–18]. The thermal decomposition of materials was broadly discussed in these reviews, but no information on co-pyrolysis kinetic studies were reported. Abnisa and co-workers [6] concluded that the success of the co-pyrolysis process mainly lies with the synergistic effect observed during the reaction between different materials which increases the yield and quality of the oils. They sug-gested that the pyrolysis reactor configuration is important for achieving synergistic/antagonist effects; however, the review lacked a detailed comparison between different technologies.
Although the co-pyrolysis of biomass and coal is favourable to up-grade the quality of the oil products through synergistic effects, large amounts of oxygenated species mostly derived from the biomass are present in the oil [19]. Due to its high oxygen content, bio-oil has an acidic nature and a high chemical reactivity, which results in phase separation during storage [20].
Biomass pre-treatment techniques enable the optimization of pyrol-ysis product yields and composition, and limit the formation of unde-sired products [21]. Pre-treatment techniques have been comprehensively reviewed (see Section 4.1). Among these pre-treatment methods torrefaction is considered one of the most promising [22]. This is evident from the increasing trend in scientific publications on torre-faction (Fig. 1). This mild pyrolysis treatment is performed at temper-atures of 200–300 ◦C resulting in moisture removal, the decomposition
of hemicelluloses and partial depolymerisation of lignin and cellulose [23]. The physical and chemical properties of biomass as fuel are improved by increasing its energy density, lowering O/C and H/C ratios and inverting its hydrophilic nature [24].
The use of torrefied biomass as feedstock for the pyrolysis process also improves the quality of the resulting bio-oil by reducing the mois-ture, oxygen and acid content, and increasing the carbon content [20]. This process has developed rapidly but has only been reviewed recently [25,26]. Both these reviews focused on the effects of torrefaction on the quality of the pyrolysis products, and demonstrated the potential to upgrade bio-oil quality but at the cost of bio-oil yield. Dai and co-workers [26] analysed the integrated process of torrefaction and pyrolysis and concluded that the process is cost-effective with good economic potential. It was suggested that the integration of torrefaction with advanced pyrolysis techniques such as co-pyrolysis can result in an increased competitiveness of commercial bio-oil.
The co-pyrolysis of torrefied biomass and coal combines the advan-tages of co-utilization of biomass and coal with the advanadvan-tages of tor-refied biomass as feedstock in pyrolysis technologies. Reviews on co- pyrolysis studies by Abnisa et al. [6], Quan and Gao [16], Hassan et al. [17] and Mushtaq et al. [18] have mainly focused on summarizing general trends, which do not convey clear conclusions on the origins of antagonist/synergistic events due to a disjoint approach to evaluate the different scales of pyrolysis. The novelty of this review is the funda-mental evaluation of chemical and physical aspects of the co-pyrolysis process, which has been neglected in other reviews. To the authors’ knowledge, this is also the first review providing insights into funda-mental differences in the co-pyrolysis of torrefied biomass and coal compared to co-pyrolysis of raw biomass and coal. For co-pyrolysis studies using raw/torrefied biomass and coal, only 3% of studies have included torrefied material. The recent progress made in the under-standing of chemistry and physics covering mainly mechanistic pyrol-ysis aspects (Sections 3.1 and 3.2) are first reviewed followed by a state-of-the-art on kinetics of co-pyrolysis (Section 3.3). The engineer-ing applications of this process are then discussed in Section 4. Finally, the conclusions and prospects are summarized in Section 5.
List of abbreviations
AAEM Alkali and alkaline earth metals BET Brunauer–Emmett–Teller
COP25 25th United Nations Climate Change Conference CPD Chemical percolation devolatilization
DAEM Distributed activation energy model DSC Differential scanning calorimetry DTG Derivative thermogravimetric
FTIR Fourier transform infrared spectroscopy GC Gas chromatography
GC-MS Gas chromatography mass spectrometry GHG Greenhouse gas
HPLC High performance liquid chromatography NMR Nuclear magnetic resonance
PAH’s Polyaromatic hydrocarbons SEM Scanning electron microscope TGA Thermal gravimetric analysis
Fig. 1. Increase of scientific publications on pyrolysis research using either coal
(Scopus keywords: Pyrolysis AND coal) or biomass (Scopus keywords: Pyrolysis AND biomass) as feedstock and torrefaction (Scopus keywords: Torrefaction) – Access on January 14, 2020.
2. Feedstock origin
2.1. Feedstocks: coal and biomass
The composition of the most popular studied types of biomass and coal are shown in Table 1 and reveal important chemical differences. Lignocellulose is described as a polymeric structure made up by three main constituents (i.e. cellulose, hemicelluloses, lignin). The chemical and structural properties of a specific biomass mainly depend on the content and nature of these biopolymers [27]. On the other hand, coal consists of small “nuclei” of aromatic and naphthenic rings, which are linked to each other by bridges of aliphatic chains or heteroatoms [28]. The high aromaticity of coal is reflected in its high content of C and low
content of H [29].
General correlations between physico-chemical properties of biomass and coal can be used as a predictive tool to determine the suitability of the feedstock for a certain application and different reviews have summarized these correlations [30,31]. For the co-processing of torrefied biomass and coal, correlations based on the ultimate analysis of the feedstock are likely to be the best choice for a predictive tool due to a more accurate estimation of the reactants ratio [30].
2.2. Thermal behaviour of feedstocks
Thermogravimetric measurements are conventionally used to assess thermal behaviour and organic composition of feedstocks [54–56].
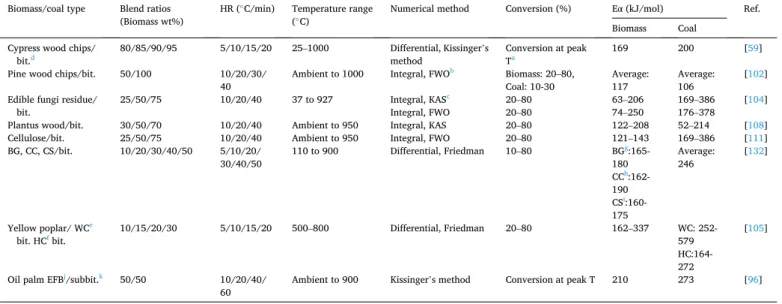
Fig. 2. Historical events that allowed the deployment of biofuels’ research activities [10]. Red textboxes represent geopolitical reasons (wars, economic crisis) that largely explained the shifts in the demand for crude oil and green textboxes represent different actions that countries undertook to announce the imminent phase-out of coal-fired power plants. (For interpretation of the references to colour in this figure legend, the reader is referred to the Web version of this article.)
Table 1
Proximate and ultimate analyses, CV value and molar O/C and H/C ratios of different types of biomasses and coals of different ranks.
Feedstock Proximate analysis (wt% d.b.)a Ultimate analysis (wt% d.a.f)b CV (d.b.) (MJ kg−1)c O/Cd H/Ce Ref.
VMf FCg Ash C H N O S Biomass Softwood Pine chips 72.4–87.0 12.6–21.6 0.3–6.0 46.1–52.8 5.3–6.1 0.1–0.5 40.5–48.4 <0.3 19.0–19.8 0.6–0.8 1.2–1.6 [32–36] Hardwood Sawdust 84.6–91.3 14.3–19.6 0.1–1.1 45.3–52.0 6.0–6.1 0.2–0.6 41.6–47.1 0.1–1.1 17.7–20.4 0.7–0.8 1.4–1.6 [35–39] Grass Switchgrass 76.7–80.4 14.4–14.5 5.1–8.9 39.7–49.7 4.9–6.1 0.6–0.7 31.8–43.4 <0.2 12.6–18.1 0.6–0.7 1.2–1.8 [37,40] Straw Rice straw 71.6–88.7 8.1–14.5 8.9–13.9 43.6–45.4 5.3–7.4 0.4–0.8 33.0–50.6 <0.1 16.2–18.9 0.5–0.8 1.4–2.0 [40–43] Coal Peat 61.2–78.9 10.0–24.3 6.5–18.8 50.5–56.4 5.4–6.0 1.4–2.5 35.7–41.2 0.5–0.9 17.4–22.4 0.3–0.5 1.1–1.3 [44–46] Lignite 38.0–54.4 36.3–50.0 9.4–33.3 66.8–73.2 4.5–5.1 1.0–2.0 16.4–22.0 1.3–2.0 26.5–31.7 0.1–0.2 0.7–1.1 [44,47,48] Bituminous 20.0–26.9 54.8–55.8 18.3–35.0 78.8–82.9 4.3–5.0 1.6–2.0 10.0–15.1 0.6–1.8 19.9–36.4 0.1–0.2 0.6–0.8 [44,49–51] Anthracite 4.2–30.4 80.3–86.8 6.0–9.0 84.8–94.4 2.1–3.5 <1.4 1.7–6.2 <1 30.6–36.2 <0.1 0.3–0.5 [48,52,53] ad.b. – dry basis. b d.a.f. – dry ash free. cCV – calorific value.
dO/C – oxygen to carbon molar ratio. eH/C – hydrogen to carbon molar ratio. fVM – volatile matter.
During thermal degradation of woody biomass, different stages can be identified in weight loss curves (Fig. 3): below 200 ◦C where the slight
decay is due to drying and the release of light volatiles [57] and 200–500 ◦C where significant mass loss is observed. Hemicellulose is
the most reactive component and decomposes in the range of 225–325
◦C, cellulose in the range of 305–375 ◦C, while lignin degrades
gradu-ally in the range of 250–500◦[58]. Compared to biomass, coal displays
smaller mass losses. The first stage of thermal decomposition occurs below 400 ◦C corresponding to drying and the release of low molecular
organic species [59]. The second stage includes the main devolatiliza-tion range between 400 and 600 ◦C.
The torrefaction pre-treatment technique applied to biomass up-grades the fuel characteristics to closer match those of coal. Compared with raw biomass, the mass loss curve of torrefied biomass shows a closer resemblance to the coal mass loss curve (Fig. 3), mainly due to the removal of hemicelluloses during torrefaction [60–62].
3. Fundamentals of co-pyrolysis
Co-pyrolysis of biomass and coal cannot be dissociated from the concept of synergistic/antagonist effects because it is expected to draw several advantages in terms of emissions, energy savings and enhancing product quality. Here, we would like to reflect on the current usage of the word ‘synergistic’ that is often mentioned when discussing chemical mechanisms in co-pyrolysis. The semantic of the word confirms that ‘synergy’ is used when the interaction of components when combined produce a greater effect than the sum of the individual components, suggesting a positive impact. In this review, we will use product yields as indicators for synergies and antagonisms. These effects are evident when the combined individual product yields (oil, gas and char) differ from the total sum. This approach is often referred to as the additive method. To be specific on the origin of experimental discrepancies, here we analyse how major parameters impact co-pyrolysis features. Past co- pyrolysis studies performed in different reactors and using thermogra-vimetric analysis were respectively collated in Tables 2 and 3. We would like to stress the fact that it is challenging to compare the out-comes of studies from Table 2 considering the variability between set- ups and characterization methodologies; thermogravimetric analysis being the most commonly applied thermoanalytical technique in solid- phase thermal degradation studies for obtaining kinetic data [64].
Table 2 Summary of process parameters for co-pyrolysis studies on different reactor setups. Biomass/coal type Coal Biomass Biomass blend ratios (wt%) Reactor type Capacity (g) Gas Flow rate (mL/ min) Particle size ( μ m) Heating rate (K/s) Temperature (◦C) Pressure (bar) Product characterization methodology Ref. H/C molar ratio - AC (%, db a) Silver birch, forest residue/Daw Mill, polish coal 0.70 –4.7/ 0.77 –10 1.60 –1.9/ 1.37 –2.1 50 Fluidized bed 0.05 –0.1 He 106 –150 NR b 850,1000 20 Liquids/gas: Set-up originally designed for studying char reactivity – no detailed description of total volatiles and oil collection Char: Reactivity measured by TGA [ 65 ] Corn cob/subbit. c 0.98 –22.96 1.53 –1.57 20/40/60/ 80 Fluidized bed 20 N2 , 7000 C: 600 –1000, B: 1000-2000 NR 500 –700 1 Gas: Collected in gas bags, analysed with GC Char: Not characterized Liquids: GC-MS analysis [ 66 ] JiaDuoBao/Lignite 0.8 –16.8 1.6 –6.4 10/20/40/ 50 Fluidized bed 0.02 Ar, 300 150 –180 NR 600 –850 1 Gas: Online analysis by MS, collected in gas bags, analysed with GC Char: Not characterized Liquids: Not characterized [ 67 ] Sawdust/Drayton coal 0.8 –15.8 1.3 –0.4 5/10 Drop tube 3 N2 , 500 C: 45 –63, B: 9-125 10 4 900 –1400 1 Gas: Online analysis by fast response GC Char: XRF analysis Liquids: Not characterized [ 68 ] Sawdust/bit. d 0.83 –8.7 1.6 –0.99 20/40/60/ 80 Drop tube 10 N2 , 500 180 –250 NR 800 –1400 1 Gas: Measured by flow meter, collected in bags, analysed by GC Char: Reactivity measured by TGA Liquids: Not characterized [ 69 ] (continued on next page )
Fig. 3. TGA and DTG curves for coal ( coal TGA, ─ ─ coal DTG), torrefied wood ( torrefied biomass TGA, torrefied biomass DTG) and raw wood ( raw biomass TGA, raw biomass DTG) (adapted from Lu and co- workers [63]).
Table 2 (continued)
Biomass/coal type Coal Biomass Biomass blend ratios (wt%)
Reactor type Capacity
(g) Gas Flow rate (mL/ min)
Particle size (μm)
Heating
rate (K/s) Temperature (◦C) Pressure (bar) Product characterization methodology Ref.
H/C molar ratio - AC (%, dba)
Legume straw/lignite 0.8–11.0 1.6–1.8 0–100 Drop tube NR N2, 35 300–450 NR 500–700 1 Gas: Analysed with GC
Char: Reactivity determined in fixed bed [70] Cellulose, hemicellulose, lignin/bit. 0.7–16.1 1.7–0.07/ 1.7–3.8/ 1.0–3.7
20/50/75 Drop tube 1 N2, 100 NR NR 600–1000 1 Gas: Collected in gas bags, analysed
with GC
Char: Not characterized Liquids: Not characterized
[71]
Pine sawdust, legume
straw/brown, bit. 0.8–11.0/ 0.7–17.5 1.6–0.3/ 1.6–0.3/ 1.6–1.7
0–100 Drop tube 4–6 N2, 35 300–450 8.3 500–700 1 Gas: Collected in gas bags, analysed
with GC
Char: Char reactivity determined in fixed bed
Liquids: Analysed by SEC, GC-MS
[72]
Pine/subbit. 0.79–5.71 1.59–0.34 0–100 Drop tube NR N2 C: 300–450, B:
450-900 NR 600 1 Gas: Collected in gas bags, analysed with GC Char: Not characterized
Liquids: Not characterized
[73]
Switchgrass/bit. 0.90–11.41 1.6–9.1 15/30/50 Semi-batch
drop tube 1 Ar, 2000 297–1190 NR 900 1 Gas: Collected in bags, analysed by GC- MS, online MS. Char: Ash elemental analysis via ICP OES, ultimate analysis
Liquids: GC-MS analysis, ultimate analysis
[13]
Rice straw/bit. 0.86–6.57 1.7–13.9 20/50/80 Semi-batch
drop tube 0.3 Ar, 500 C: 125-180 B:250-420 10
3–104 600–1200 1 Gas: Collected in gas collector,
analysed with GC
Char: Analysis by XRD, SEM, surface area, pore size distribution (BET), char reactivity by TGA
Liquids: Not characterized
[74]
Wood, rice straw/
subbit. 1.1–9.6 1.8–2.8/ 1.8–12.0 25/50/75 Semi-batch drop tube 4 N2, 120 150–250 NR 800 1 Gas: Collected in gas bags, analysed with TCD-GC Char: Analysis by SEM, surface area and pore size distribution (BET) Liquids: GC-MS analysis
[75]
Pine/subbit, lignite 0.76–6.6
0.8–25.7 1.4–0.6 10/20/50 Semi-batch drop tube 0.1 Ar, 4500 106–300 400–1000 600–925 1 Gas: Collected in bags, analysed by GC- MS, online MS. Char: Not characterized
Liquids: GC-MS analysis
[15]
Wood/lignite 0.8–24.3 1.5–0.8 30/50/70 Semi-batch
drop tube NR N2, 100 <74 NR 600–1000 1 Gas: Collected in gas bags, analysed with GC Char: Analysed using SEM Liquids: Not characterized
[20]
Sugar beet/lignite 0.81–5.8 1.73–3.0 50 Semi-batch
drop tube 1 pellet Ar, 4500 Pellets Φ~13 mm NR 600 1 Gas: Not characterized Char: Proximate, ultimate analysis Liquids: Not characterized
[76] Corn stalk/subbit. 0.7–3.4 1.5–5.7 10/30/50/
70/90 Moving bed pyrolyzer 100 None C: <4000 B: Pellets (2000 × 6000)
NR 700–800 1 Gas: Collected in gas bags, analysed with GC
Char: Ultimate analysis, ash melting point, XRF
Liquids: Not characterized
[77]
Silver birch, forest residue/Daw Mill, Polish coal
0.70–4.7
0.77–10 1.60–1.9 1.37–2.1 33/49/52/ 73 Hot rod FB 0.05 N2, 100 106–150 10 850,1000 1,5,10,20 Liquids/Gas: Set-up originally designed for studying char reactivity – no detailed description of total volatiles and tar collection Char: Reactivity measured by TGA
[65]
Table 2 (continued)
Biomass/coal type Coal Biomass Biomass blend ratios (wt%)
Reactor type Capacity
(g) Gas Flow rate (mL/ min)
Particle size
(μm) Heating rate (K/s) Temperature (◦C)
Pressure
(bar) Product characterization methodology Ref. H/C molar ratio - AC (%, dba)
Sawdust/bit. 0.83–8.7 1.6–0.99 20/40/60/
80 Fixed bed 10 N2, 500 180–250 NR 800–1400 1 Gas: Measured by flow meter, collected in bags, analysed by GC Char: Reactivity measured by TGA Liquids: Not characterized
[69]
Sawdust/lignite 0.97–10.3 1.59–1.69 20/50/80 Fixed bed 2 N2, 100 C:150-500
B:<125 NR 400–900 1 Gas: Collected in bags, analysed by GC Char: Analysed by IR spectra Liquids: Analysed by GC-MS
[78] Corn cobs, corn
stover, bagasse/bit. 0.8–38.6 1.6–1.6, 1.7–24.5, 1.6–10.3
5/27.5/50 Fixed bed 300–600 N2, 2000 C:
6700–20000, B: 50-20000
0.2–0.25 400–600 1–26 Gas: Collected in bags, analysed by GC Char: Not characterized
Liquids: Analysed by GC-MS
[79] Rice straw/bit. 0.85–6.9 1.96–11.01 20/40/60/
80 Fixed bed 15 N2, 500 180–250 NR 700–900 1 Gas: Measured by flow meter, collected in bags, analysed by GC Char: Analysed by SEM, proximate and ultimate analyses
Liquids: Condensed, analysed by GC- MS
[43]
Straw/lignite 1.1–10.8 1.9–9.73 50 Fixed bed 30 N2, 100 <177 0.3 500–550 1 Gas: Measured by flow meter,
collected in bags, analysed by GC Char: Raman, XPS analysis Liquids: Condensed and analysed by GC-MS
[80]
Sawdust/subbit. 0.68–7.43 1.57–0.76 20/40/60/
80 Fixed bed 20 N~25000 2, <1000 NR 500–700 1 Gas: Collected in bags and analysed by GC and IR analyser Char: Not characterized
Liquids: Not characterized
[81]
Rice husk/lignite 0.9–5.4 1.6–15.9 50 Vacuum
Fixed bed 10 N2 130–180 0.2 900
−0.75
(vacuum) Gas: Collected in bags, analysed by GC Char: Analysed for surface area (BET) Liquids: Analysed by GC-MS
[82] Corncob/lignite 0.7–9.4 0.9–2.0 33/50/67 Two-stage
fixed bed 3 None 125–154 0.17 1000 1 Gas: Online analysis by MS Char: Reactivity measured by TGA, Raman spectra, surface area (BET) Liquids: Not characterized
[83]
Sawdust/Drayton
coal 0.8–15.8 1.3–0.4 5/10/25/50 Horizontal tubular 1 N2, 50 C: 45-63 B: 9-125 0.2–0.8 200–1400 1 Gas: Online analysis by fast response GC Char: Not characterized
Liquids: Not characterized
[84]
Safflower seed/
lignite 1.1–44.6 1.8–2.3 3/5/7/10/ 33/50 Fixed bed 10 N2, 100 C: 500–1000, B: 600-850 0.1 450–700 1 Gas: Not characterized Char: Not characterized
Liquids: Elemental analysis, calorific value, FTIR, GC-MS, 1H NMR [85] ad.b. – dry basis. b NR – not reported. cSubbit. – subbituminous. dbit. – bituminous.
Table 3
Summary of process parameters for co-pyrolysis thermogravimetric studies.
Biomass/coal type Biomass(es) Coal(s) Blend ratios (Biomass wt %) Capacity (mg) Gas flow (mL/ min) Particle
size (μm) Heating rate (◦C/min) Temperature (
◦C) Pressure (bar) Ref. H/C molar ratio - Ash (%, dba)
Pine chips/lig.c 1.4–1.0 1.1–68.7/
0.9–34.3 20/60/80 nr
b Nr 750–1200 100 110–900 1 [87]
Pine sawdust/bit. 1.4–1.7/
1.8–45.6 0.5–10.7/ 0.8–7.5 15–40 10–15 N2 300 70–100 20 100–900 1 [88] Olive kernel, forest-
and cotton residue/lig. 1.4–2.6/ 0.5–2.1/ 1.4–0.2/ 1.5–6.6 1.2–13.0 5/10/20 20–25 N2 45 <250 10 850 1 [89]
Olive kernel, forest- and cotton residue/lig. 1.4–2.6/ 1.4–2.1/ 1.4–0.2/ 1.5–6.6 1.2–13.0 5/10/20 20/25 N2 45 <75/ <250/ <450 10/100 to 110 & to 850 1 [90]
Wood waste, wheat
straw/subbit.d 1.3–0.1/ 1.5–3.3 0.7–9.7 50/70/80/ 90 100 Ar 50 nr 20 to 1300 1 [91]
Pinewood/lig, bit.e 1.3–2.4 1.3–11.0/
0.8–3.4/ 0.9–5.0
25/50/75 15 N2 nr 75–90 25 to 900 1 [19]
Pine, pellets, olive residue, hazelnut shells, paper sludge/bit 1.4–1.7/ 1.5–2.3/ 1.6–1.2/ 1.3–1.3/ 1.7–47.0 0.8–13.8 15/40 15 N2 60 125–300 20 105 to 1000 1 [92] Safflower seed/lig. 1.8–2.3 1.1–44.6 33/50/66 25 N2 40 500–1000 5 to 800 1 [85] Corn cob/lig. 1.6–0.9 1.0–18.3 10/50/90 nr He 50 <74 10 to 600 1 [93] Wood waste/lig. 1.3–1.5 0.7–28.5 50/60/90 5 N2 100 C: 149-210 B: 354-500 40 to 1000 1 [94] sawdust/subbit., bit. 1.6–3.8 0.8–11.6/ 1.3–19.7 50 5 N2 100 53–75 10/30/50 to 1200 1 [95] Palm fruit bunches,
kernel shell, mesocarp fibre/ lig. 1.6–4.5/ 1.5–10.2/ 1.3–10.5 1.2–5.8 20/40/50/ 60/80 20 N2 nr <212 10/20/40/ 60 to 900 1 [96] Corn residue/lignite 1.6–7.6 0.8–12.5 10/20 5 He 100 nr 10/30/100 to 900 1 [97] Hazelnut shell/
peat, lig., bit., anth.f
nr-4.3 nr-7.7/ nr- 42.5/ nr-20.3/ nr-6.8/ nr-4.5
10 40–44 N2 40 250 40 to 900 1 [98]
Sugar beet pulp/
lignite 1.7–3.0 0.8–5.8 50 10 N2 50 74–149 20 to 900 1 [76]
sawdust/subbit. 1.6–0.8 0.7–7.4 40 <10 N2 200 <250 15 to 900 1.2 [81] Sawdust, rice straw/
lig. 1.4–1.6/ 1.1–11.8 0.7–31.3 20/50/70 10 N2 70 74–149 10 to 1000 1 [99] Sugarcane bagasse, corn cob/bit 1.6–10.3/ 1.6–1.6 0.8–38.6 10/20/40 5–25 N2 150 <212 5/10/50 to 900 1 [100] C. vulgaris algae/ semi-anth 1.6–10.3 0.9–21.6 30/50/70 6 N2 100 <200 10/20/40 to 1000 1 [101] Japanese cedar chips/anth. 1.22–0.0 0.7–13.7 25/50/75 5 N2 100 74–149 20 to 800 1 [63] Wood chips, macadamia nut shells/bit. 1.3–1.2/ 1.3–0.2 1.0–23.6 80/85/90/ 95 10 N2 20 250–350 5/10/15/20 to 1000 1 [59] Pine chips/bit.,
subbit. 1.3–0.9 0.4–8.1/ 0.8–14.2 50/100 1000 N3500 2 <125 1st stage: 10, 2nd stage: 10/20/30/ 40 1st stage: 105 ◦C, 2nd stage: to 1000 ◦C 1 [102] Switchgrass, sawdust/sub. 1.6–6.3/ 1.5–0.4 0.7–30.5/ 0.3–2.0 25/50/75 5/10/15 N250/ 2 500/ 750 300–355 25 to 800 ◦C 1–100 [103] Pine/subbit. 1.6–0.3 0.8–5.7 25/50/75 10–15 N2 nr 450-900/ 300-450 10 to 800 1 [73] Fungi residue/bit. 0.7–12.4 0.7–15.4 25/50/75 10 N2 60 <74 10/20/40 to 1200 1 [104] Pine sawdust/lig. 1.6–1.7 1.0–10.3 20/50/80 ~10 N2 80 150–500 and <125 10 to 1000 1 [78] Corn cob/subbit. 1.5–1.6 1.0–23.0 20/40/60/ 80 ~15 N2 100 <150 10/40 to 700 1 [66] Yellow poplar/bit. 1.4–0.9 0.9–8.7 0.8–7.7 10/15/20/ 30 10 N2 110 <350 5/10/15/20 to 800 1 [105] Switchgrass, corn stover/bit. 1.6–2.9/ 1.3–5.0 0.7–11 20 4.5–5.5 N2 80 C: <400 B: 400-500 5/10/20/40 to 800 1 [106] Rice straw, sawdust/
bit. 2.0–11.0/ 1.6–1.0 0.78–11.43 20/40/60/ 80 nr N2 150 180–250 5/10/15/ 20/25/30 to 900 1 [107] (continued on next page)
3.1. Yields and product distribution
In an attempt to efficiently compare conclusions, thermogravimetric studies have been critically compiled (Table 3). Further discussions will be based on studies that rigorously prepared controlled samples and performed a temperature calibration of their instrument. The dynamic mode is usually preferred to the isothermal mode as it presents the advantage of studying the entire temperature range. Unfortunately general precautions to avoid misleading measurements are often dis-missed [86].
In this section various parameters of the co-pyrolysis process are fundamentally evaluated and the effect of torrefaction on these rameters is discussed. A summary of the effect of torrefaction on pa-rameters of the co-pyrolysis process is presented in Table 5.
3.1.1. Influence of initial mass and internal heating rate: mass transfer limitations
Good practices in thermogravimetric studies require several pre-liminary studies that evaluate possible limitations in mass and heat transfer and guarantee that pyrolysis rates are reaction controlled. Ac-cording to our knowledge, no co-pyrolysis work reports an effective and thorough study on the inherent impact of mass and heat transfer related to the initial mass. A few classic studies have reported the existence of a thermal lag (i.e. difference between reactor and sample temperature) which is a consequence of biomass pyrolysis endothermicity (discussed in Section 3.1.3) [115,116]. To overcome transport limitations, it is necessary to evaluate the influence of initial sample mass on the devo-latilization behaviour. This was well illustrated by Volker and Rieck-mann [117] where the influence of initial sample mass of cellulose was revealed by recording the char yield (Fig. 4). They demonstrated how mass transport significantly affects the product distribution. At a low heating rate of 3 K/min, no variation between degradation temperature range (between 593 and 595 K) and maximum decomposition rate was observed. However, the char yield increased from 2 to 18%. For higher temperature ramps, 41 and 105 K/min, significant changes in degra-dation temperatures and devolatilization rates were reported when increasing the initial sample mass: temperatures shifting towards higher values (from 634 to 651 K for 41 K/min) at maximum degradation rates, which are lower in consequence. This phenomenon has also been re-ported by other researchers for both raw and torrefied biomass pyrolysis [118]. In addition to these results, the irregularity in char yield trends at
high heating rates (105 K/min) and larger samples (20–54 mg) reflects the inhomogeneity of degradation temperature within the sample due to heat transport limitations (Section 3.1.2). As a conclusion, mass transfer limitations will strongly affect resulting char yield.
For modelling purposes, mass transfer phenomena within the parti-cle are conveniently described with a convective transport equation and gas flow with the incorporation of the Darcy’s law that includes the feedstock permeability [120]. The permeation rate of gas depends on the properties of the feedstock such as permeability and porosity. This means that for feedstocks with different pore morphology, volatiles will be released at different rates during co-pyrolysis. The addition of tor-refied material where the permeability of the biomass was increased during torrefaction (10−14 m2 for wood and 10−11 m2 for char),
im-proves the release of volatiles by minimizing intraparticular secondary reactions [121].
The change in permeability by torrefaction depends on the temper-ature at which the biomass is torrefied. For example, Rousset and Girard [122] determined the effects of torrefaction at 200 ◦C on two mass
transfer properties of Poplar wood: mass diffusivity and air perme-ability. They observed that torrefaction pre-treatment decreased the magnitude of mass diffusivity but no significant change in the perme-ability was observed which demonstrated that the thermal pre-treatment at 200 ◦C did not affect the pore morphology of the wood.
Mafu et al. [27] also observed no significant change in CO2 micropore
surface area of woody biomass after torrefaction at 260 ◦C; however,
when the temperature was increased to 300 ◦C the micropore surface
area started to increase [123]. The significance of torrefaction on mass transfer during co-pyrolysis therefore strongly depends on the torre-faction temperature.
3.1.2. Influence of particle size and internal heating rate: internal and external heat transfer limitations
The presence of a temperature gradient within the particle is a direct expression of thermodynamic properties of the materials. In their re-view, Antal and Varhegyi [124] summarized the early efforts in ratio-nalizing the heat transfer limitations and their impacts on kinetics. The most emblematic work remains the theory proposed by Pyle and Zaro [125]. Based on physical/structural and thermal properties of a particle, they proposed different ratios (the Biot number and Pyrolysis numbers) to assess the relative importance of internal and external heat transfers. Experimentally, the reactor heating rate can be programmed and
Table 3 (continued)
Biomass/coal type Biomass(es) Coal(s) Blend ratios (Biomass wt %) Capacity (mg) Gas flow (mL/ min) Particle size (μm) Heating rate (◦C/min) Temperature (◦C) Pressure (bar) Ref. H/C molar ratio - Ash (%, dba)
Platanus wood/lig., bit. 1.5–0.8 0.8–24.3/ 0.5–6.0 30/50/70 10 N2 60 <74 10/20/40 to 950 1 [108] Giant reedgrass/lig. 1.7–16.3 1.2–21.0 10/20/30/ 40/50/60/ 70/80/90 10 N2 60 <250 5/10/15/ 20/30 to 800 1 [109] Chestnut sawdust/ bit., anth. 1.4–1.3 0.7–7.8/ 0.6–8.4 nr 2–5 N2 100 <212 10/20/30 to 1000 1 [110] Cellulose/bit. 0.7–0.1 0.7–15.4 25/50/75 ~10 N2 60 10/20/40 to 950 1 [111] Wallnut shell/bit. nr nr 50 10 & 20 N2 200 <100 50 to 900 1 [112] Corn stalks/lig. 1.7–16.3 1.2–21.0 50 15–20 Ar 100 <1000 20 to 800 1 [80] Leaves, softwood, hardwood/subbit 1.7–3.2/ 1.7–1.9/ 1.8–3.3 0.9–3.9 25/50/75 3–4 N2 20 <150 20 to 800 1 [113] Poplar/lig. 1.6–5.8 0.7–9.6 4/8/12/16/ 32 10 50 74–150 10/20/30 to 1000 1 [114] ad.b. – dry basis. b nr – not reported. cLig – lignite. dSubbit. – subbituminous. eBit. – bituminous. fAnth. – anthracite.
regulates external heat transfer limitations, the extent of which depends on the type of reactor and associated heating source. Although more elaborated models are required to illustrate the influence of reactor heating rate [126], L´ed´e et al. [127] could estimate the extent of the thermal lag according to the reactor heating rate for different heat transfer coefficients, h in W m−2 K−1, and initial particle sizes, L
0 in μm.
The thermal lag increases with increasing heating rate and remains
Table 4 Summary of process parameters for co-pyrolysis studies using torrefied biomass and coal. Feedstock Torrefaction Pyrolysis Ref. Coal Raw biomass Torrefied biomass Reactor type Capacity (g) Temperature (◦C) Torrefied biomass blend ratios (wt%) Capacity (mg) Gas flow (mL/min) Particle size ( μ m) Heating rate (K/min) Temperature (◦C) Pressure (bar) H/C molar ratio - Ash (%, db a) 0.7 –7.5 2.1 –16.0 1.3 –18.0/ 0.9 –24.5 Fixed bed 5 250, 300 25/50/75 8 N2 , 50 95 –125 20 900 1 [ 131 ] 1.1 –20.0/ 0.9–28.6/ 0.6–19.1 1.9 –3.2 1.7 –9.3 Tube reactor nr b 250 20/50/80 nr N2 , 20 < 125 10 900 1 [ 135 ] 0.7 –13.7 1.2 –0.0 1.1 –0.3/ 0.7 –0.8 NR b 9.5 250, 300 25/50/75 5 N2 , 100 74 –149 20 800 1 [ 63 ] ad.b. – dry basis. bNr – not reported. Table 5
Summary of the effects of torrefaction on different co-pyrolysis process parameters.
Co-pyrolysis process
parameter Effect of torrefaction
Mass transfer limitations Less due to an increase in biomass permeability Heat transfer limitations Less due to an increase in biomass thermal conductivity Enthalpy of pyrolysis Greater due to a decrease in hemicellulose content and
secondary reactions
Blend ratio Less significant due to higher similarities with coal Inherent organics Twice the amount of raw biomass, but organic
composition unchanged
Temperature Higher temperature required due to the removal of light reactive volatiles
Pressure More significant effect on product yields due to increased porosity of biomass
Fig. 4. Influence of the initial sample mass on char yield during the cellulose
pyrolysis adapted from Volker and Rieckmann [119].
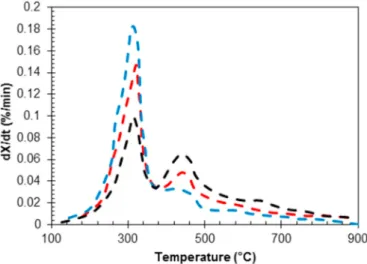
Fig. 5. DTG curves of rice straw and coal blends of ( ) 75 wt% ( ), 50 wt% and (─ ─) 25 wt% (Adapted from He et al. [131]).
negligible at a high heating ramp for extremely low L0/h < 2 × 10⁻⁸ W
m−1K−1, design and operating conditions difficult to apply.
Once again, the scrutiny of existing phenomenological models is of interest to understand how changes in thermo-physical and transport properties of torrefied material may impact heat transfer. For example, Mason et al. [128] reported that torrefied wood had a significantly higher thermal conductivity (0.29 W m−1 K−1) compared to raw biomass
(0.16 W m−1 K−1). The change in this thermal property alone is
esti-mated to decrease the Biot number by almost a factor of 2. This means that internal temperature gradients are expected to be significantly reduced for torrefied biomass compared to raw biomass.
3.1.3. Internal energy of pyrolysis
The thermodynamic nature of co-pyrolysis is conventionally assessed from heat profiles that indicate the following: an early and sharp endothermic peak at temperatures below 150 ◦C related to surface water
evaporation (dehydration) for both biomass and coal, and the highly exothermic profile of biomass compensating the endothermic character of coal conversion [93]. Chemical changes brought about by torrefaction are partly responsible for the changes observed in heat flow curves of torrefied biomass. DSC curves obtained for biomass and torrefied biomass under conditions where heat transfer limitations were mini-mized demonstrated that the exothermal peak observed in the range of 100–260 ◦C for biomass was absent for torrefied biomass and was
attributed to the reduction of hemicelluloses [61]. Lignin and hemicel-lulose pyrolysis is exothermal but celhemicel-lulose pyrolysis is endothermal [129]. The overall enthalpy of reaction of a torrefied material therefore depends strongly on the composition of biopolymers remaining in the material after torrefaction.
Furthermore, mass and heat transfer limitations may also affect the thermodynamic nature of the pyrolysis process itself. In extreme cases, extensive mass transport resistances can lead to the occurrence of highly exothermic secondary reactions; resulting in a significant decrease in the overall reaction enthalpy [119]. As discussed in Section 3.1.1 and Sec-tion 3.1.2, the torrefaction pre-treatment step significantly changes the thermo-physical and transport properties of biomass in favour of reducing mass and heat transfer limitations and secondary reactions. It would therefore be expected that the overall enthalpy of pyrolysis of torrefied biomass would be greater compared to raw biomass due to less exothermic secondary reactions.
3.1.4. Influence of blend ratios on ‘reactivity’
Conventionally, a co-pyrolysis study reports trends illustrating the impact of the blend ratio with the intention to manipulate the stoichi-ometry of the pyrolysis reaction. Natural polymer mixtures are a com-bination of biomass with ‘ideally’ higher H/C ratio, O/C ratio and volatile matter content than those of coal (Table 1). The reactivity of these mixtures towards pyrolysis conditions are interpreted based on the
following devolatilization patterns (Fig. 5): number of DTG peaks, shift of onset temperatures and peak temperature, maximum decomposition temperature and associated decomposition rate [130].
It can be observed on DTG curves (Fig. 5) that blending affects the shape of peaks (with or without shoulders) and their maximal degra-dation temperatures. If the nature of polymers and blend ratios are judiciously chosen, the maximum decomposition rate significantly in-creases with increasing H/C and O/C ratios and volatile matter content, which results from increasing the mass fraction of biomass [109,132]. Few studies have revealed a good relationship between the maximum decomposition rate and biomass blend fraction which is directly related to the initial volatile matter content of the blend. To depict this trend, the maximum devolatilization rate versus ash content and volatile matter of original blends (calculated as the weighted sum of the measured value of the contributing coal and biomass fractions and expressed on a dry ash free basis) have been plotted (Fig. 6).
On the same additive principle, past contributors have quantitatively assessed synergisms or/and antagonisms during co-pyrolysis and con-tradictory conclusions were reported mainly based on the lack of sys-tematic evaluation approaches. In the case where synergisms/ antagonisms events were depicted, the authors have systematically speculated that the higher hydrogen content in biomass plays a key role as H donor to facilitate coal degradation [70,81,93] referring to emblematic works such as Stiller’s one [133]. Making use of co-liquefication agents, they illustrated how well-known hydro-gen-transfer and/or termination agents for free radicals could affect the overall conversion by preventing radical recombination reactions (i.e., polymerization, cross-linking, termination). Further mechanistic aspects of co-pyrolysis are discussed in Section 3.2.
On the other hand, the influence of atomic O/C ratio is almost never invoked even though lignocellulosic biomass displays molecular ratios up to three times higher than those of coal (Table 1). The presence of higher oxygen could occasion antagonism events. Indeed, oxygen is a well-known cross-linking agent, which could counteract the effect of hydrogen [15,134].
When considering blending torrefied biomass and coal it is clear that studies are lacking (Table 4). Lu et al. [63] first reported the impact of torrefied material on the overall co-pyrolysis and concluded that whether raw or torrefied materials with low ash content were used no synergistic and/or antagonistic effects were observed based on the ad-ditive approach. In the same line, He et al. [131] reported slight de-viations for char and volatile yields during the co-pyrolysis of both raw and torrefied materials (rice straw with a high ash content) and coal. However, substantial changes in degradation temperature ranges and curves shape were observed when ‘severe’ torrefied biomass was co-pyrolysed instead of raw material: the onset temperature of the first degradation stage shifted towards higher temperatures and degradation stages overlapped so that the DTG curves displayed one peak only. This
Fig. 6. Maximum pyrolysis rate of the first degradation stage (both Y-axis) versus volatile matter and ash content: (o) data obtained at 50 K/min with bagasse/coal
last observation indicates that physical and chemical changes induced by torrefaction make the feedstock behaves more similar to coal so that the blend degrades like a single feedstock. As a result, the effect of the blend ratio becomes less significant than observed for raw biomass/coal blends.
3.1.5. Influence of inherent inorganics
The composition of biomasses and coals vary to a large extent (Table 1), particularly in the content of inorganics. Inorganics can exist naturally within the biomass under various mineral classes (silicates, oxyhydroxides, sulphates, phosphates, carbonates and others) and different states (crystalline, semi-crystalline or amorphous solids, fluid, liquid or gas) [136], but can also be added via impregnation to func-tionalize and/or protect the biomass and/or be added as heterogeneous catalysts (extraparticle) to influence the pyrolysis chemistry [137]. The influence of the inherent inorganics has been demonstrated several times. Listed as natural, primary/secondary catalysts [137], those ele-ments have been shown to induce significant changes in terms of py-rolysis reactivity according to their speciation through inhibitory and/or catalytic mechanisms [138,139]. In general, the pyrolysis process con-centrates the inorganic fraction in the solid carbonaceous residue [140]. A brief analysis of experimental findings indicates that the extent of alkali and alkaline earth metals influence depends on their electronic form. In the form of salt, inorganics can facilitate the depolymerisation of lignocellulose through carbon-carbon bond cleavage and by
decreasing the decomposition temperature [141]. In the specific case of cellulose, these inherent inorganics were found to act on primary py-rolysis reactions resulting in significant changes of the organic products distribution [141]. It is therefore not surprising to note that a few au-thors working on co-pyrolysis have pointed out their role to explain some of the synergisms/antagonisms during co-pyrolysis.
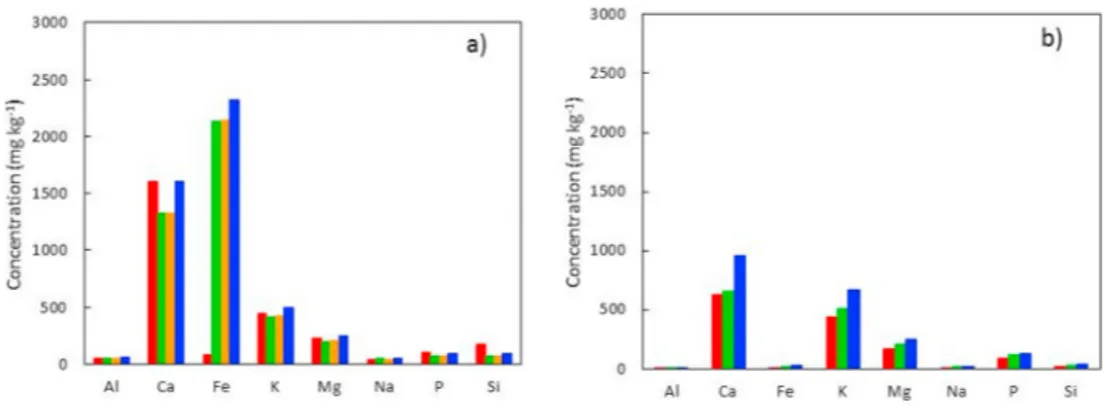
Under mild conditions (torrefaction), these inherent organics are concentrated to a lesser extent than under pyrolysis conditions. As a result, the ash content of torrefied materials is generally twice that of raw biomasses [142], however the inorganic composition of raw and torrefied biomass generally remains unchanged [143] (Fig. 7a and b).
The behaviour of inorganics is rationalized according to their natural association with biomass, mineral group and classes [136]. Mineral constituents belong to different categories, for example: post-transition metals for Al, Alkali earth metals for Ca and Mg, transition metals for Fe, Alkali metals for K and Na, reactive non-metal for P and Metalloid for Si. Depending on the temperature stress level, the stability of those minerals changes. In particular, mineral phases associated with alkali and alkaline earth metals (AAEMs) are highly reactive during biomass processing and catalytic effects are often reported [146].
The inorganics are relatively well bound with solid residues and most of them remain sequestered in the carbon matrix exhibiting new cata-lytic functionalities. Their presence confers new functionalities that have been evidenced at enhancing feedstocks conversion during CO2
gasification [147] and in upgrading chemical composition of pyrolysis bio-oils [148].
Textural characteristics and new surface functional groups of torre-fied materials/biochars are often invoked to explain their catalytic performance; keeping in mind that one of the major issues in catalysis over biochars is related to mass transport limitations (in other words, access to the active sites) due to their microporosity. To overcome those limitations, prior activation treatments are required to investigate the intrinsic catalytic role of inorganics [149]. For this reason, the work of Feng et al. [149] is quite insightful as it reveals the mechanistic details of tar reforming at the active site scale. They overcame potential mass transfer limitations by removing primary minerals using a mild acid solution and controlled the loading of K and Ca by impregnation. To explain the higher devolatilization trait of K in comparison to Ca during CO2 gasification (Fig. 8), the authors invoked the higher valence state of
Ca facilitating its anchorage to solid. Bonds are easily broken by free radicals under an oxidant atmosphere, which is not the case in a neutral atmosphere (Fig. 8). Measured char reactivity is also greater for K than Ca, 8.87% against 6.33% respectively under CO2 gasification. This is
explained by the presence of crystal defect (C–O–K clusters) which combined with electronic properties of the biochar surface, exhibit an enhanced charge distribution on the surface, weakening chemical bonds (further details in Section 3.2.1).
Fig. 7. Influence of torrefaction treatment on inorganic distribution within woody materials: a) Raw poplar wood ( ), torrefied at 240 ◦C ( ), at 260 ◦C ( ) and 280 ◦C ( ) from Kim et al. [144] and b) Raw birch wood ( ), torrefied at 240 ◦C ( ) and 280 ◦C ( ) from Shoulaifar et al. [145].
Fig. 8. Stabilization of K ( ) and Ca ( ) within biochar or ash after pyrolysis
With a smaller number of active sites combined with a limited access to these sites, torrefied materials should exhibit a lower catalytic activity than biochars. And if there is any catalytic effect noted, this should be mainly attributed to metallic active sites instead of acidic sites (O-con-taining functional groups on the surface).
3.1.6. Influence of temperature
The reactor temperature plays a major role in the extent of pyrolysis conversion and therefore pyrolysis product yields [150]. As the tem-perature increases, more volatiles are produced (gases and condens-ables) going through an optimum liquid yield, which consists of a compromise between the amount of volatiles released at high temper-atures and the limitation of secondary cracking reactions at these con-ditions. The optimal temperature for liquid production differs according to different reactor configurations (Section 4.2). Usually optimal tem-peratures are expected to be in the order of 400–550 ◦C for biomass
[151,152] and 500–650 ◦C for coal [70,153]. If temperature is increased
above these optimal temperature ranges, a transition is observed in the volatile distribution towards less liquid product and more permanent gases [154].
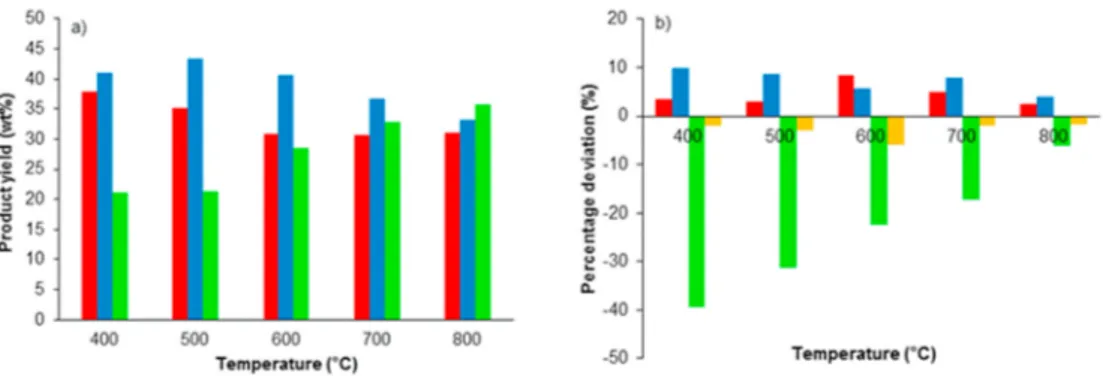
To maximize the extent of interactions between volatiles of different feedstocks, it is recommended to produce sufficient amounts of inter-mediate by-products (e.g. radicals, carbocations, hydrogen donors) from coal and biomass during co-pyrolysis without producing too many non- condensable gases [70]. It would therefore be expected that the extent of synergies will be maximized at temperatures in the range of the opti-mum temperature for liquid production. Indeed, various authors have reported this observation [70,81,155]. The product yields obtained from the work of Park et al. [81] in a semi-batch drop tube reactor using a biomass blending ratio of 60 wt% for different temperatures is shown in
Fig. 9a. The percentage deviation from calculated values is shown in
Fig. 9b. It can be observed that the maximum deviation in char yields is observed at 600 ◦C, whereas the deviation decreases with a further
in-crease in temperature.
The decrease in the extent of synergies with increasing temperature has also been explained by considering the increased production of hydrogen from coal at higher temperatures [13]. If the observed syn-ergies are explained by hydrogen donors from biomass preventing the recombination reactions of coal radicals, it is suggested that when the amount of hydrogen released from coal reaches the level of that of biomass (at higher temperatures) it would result in a decrease in the extent of synergies observed. From Fig. 9b, it can be observed that the negative deviation in hydrogen yield is most significant at 600 ◦C when
synergistic effects are maximized and becomes less significant with an increase in temperature. Another explanation is that an increase in temperature also results in an increase in gas space velocity, which leads to a shorter residence time and less interaction of volatiles with char further explaining the decrease in the extent of synergies at high
temperatures [78].
For torrefied biomass, the optimum pyrolysis liquid production is significantly affected by the torrefaction processing temperature and holding time [156]. It may be expected for mixtures of coal and torrefied biomass that the optimum temperature for maximizing synergies would occur at a higher temperature than when using raw biomass. The reason being that the light and reactive volatiles produced at lower tempera-tures for pyrolysis of raw biomass will be absent for torrefied biomass.
3.1.7. Influence of pressure
Although the effect of pressure on pyrolysis product distribution has not been reported as extensively, it remains an important process parameter that primarily affects secondary reactions. Pressure is usually reported to have a negative effect on pyrolysis liquid product yields for pyrolysis of individual fuels [157,158] as well as co-pyrolysis [65,79,
159].
The pressure affects the volatile residence time and vapour pressure and therefore the number of heterogeneous (char-gas) and homoge-neous (gas-gas) secondary reactions [150,160]. At a high reactor pres-sure, a smaller pressure gradient exists between the internal and external surface of a pyrolyzing particle. Considering Darcy’s law, this results in a lower velocity of the volatile products out of the particle’s pores and therefore increases the char-gas contact time to favour recombination reactions. This generally results in higher char yields and lower liquid yields with increasing pressure. However, it is also possible that the volatiles remaining in the char pores will undergo thermal cracking to form gas products in which case the char yield will not be
Fig. 9. Effect of temperature on a) product yield distribution from co-pyrolysis of sawdust and coal (60 wt% biomass blending ratio) in a semi-batch drop tube (
char, liquid, gas), b) Deviation between experimental and calculated product yields ( char, liquid, gas, H2).
Fig. 10. Van Krevelen diagram to illustrate major devolatilization events (—
dehydration, demethanation, decarboxylation and decarbon-ylation) during pyrolysis of (■) coal [165] ( ), biomass torrefaction [166] and ( ) biomass [166].
affected. Sathe and co-workers [161] reported that the extent of thermal cracking or recombination reactions occurring at different pressures in a specific reactor setup could be the controlling factors for the observed trends in char and gas yields. For example, Wafiq et al. [162] observed a decrease in char yield with increasing pressure up to 15 bar but no further changes at higher pressures. This suggests that as the external pressure is increased to 15 bar volatile trapping increases and recom-bination reactions dominate; therefore, higher char yields are obtained. However, with a further increase in pressure (and volatile trapping), thermal cracking reactions increase more severely and counteract the recombination reactions so that the char yield remains unchanged. Under low pressures, the residence time of highly reactive volatiles is limited resulting in a good compromise between char and liquid yields [160]. Most importantly, the pressure impacts the physico-chemical properties of products, in particular those of oil and char: the compo-sition of oils is altered [163] and chars display substantial changes in surface areas [162].
With regards to torrefied biomass, Wafiq and co-workers [162] re-ported similar trends for the effect of pressure on char yields for both raw and torrefied biomass. However, pressure had a more significant negative effect on liquid yields for torrefied biomass. For raw biomass, the liquid yield decreases from 16–11 wt% d.b when pressure increased from 1 to 30 bar, whereas the liquid yield for the torrefied biomass decreases from 16–6 wt% d.b for the same pressure range. This may be due to the increased porosity of torrefied material, which weakens the internal forces by supplying a greater volume for volatiles to evolve. Consequently, more cracking reactions are expected inside the pores. The effect of pressure on co-pyrolysis of torrefied biomass and coal compared to raw biomass and coal is summarized in Table 5.
Due to increased secondary reactions at high pressure, the extent of synergies usually also increases with pressure. For example, Collot and co-workers [65] observed a deviation of 15% in liquid yields at 5 bar compared to 22% at 20 bar. Huang and co-workers [159] also reported the maximum deviation in char and liquid yields at 30 bar. The control of pressure is therefore critical to favour the extent of synergies during co-pyrolysis.
3.2. Chemistry and physics of co-pyrolysis products 3.2.1. Composition and texture of chars
Residual solids rich in carbon are important in the overall pyrolysis process as they concentrate a significant amount of energy and in-organics. The char yields resulting from co-pyrolysis of raw biomass and coal are usually lower than theoretical ones determined by the additive method [43,70]. The hydrogenation synergistic mechanism on coal pyrolysis (e.g. recombination of coal pyrolysis radicals with biomass hydrogen donors preventing polymerization reactions) is invoked to explain the residual solid decrease and the subsequent impact on the solids properties.
The formation of char can occur through various mechanisms: (1) dehydration leading to primary char and/or (2) recombination between reactive and volatiles fragments into char via cross-linking and condensation resulting in secondary char [164]. Under pyrolysis con-ditions, dehydration, decarbonylation, decarboxylation and demetha-nation reactions drive the formation of char (Fig. 10). However, under torrefaction, the dehydration remains the dominant mechanism. This prior loss of H and O during torrefaction pre-treatment with the release of water and oxygenates compounds containing carbonyl and carboxylic groups has a drastic impact on decarbonylation and decarboxylation reactions during the co-pyrolysis of coal and torrefied biomass (Fig. 10). For example, less vapour water could prevent water–gas shift reactions and limit H2O and CO2 gasification reactions, thus preventing the
con-sumption of C and limiting the textural evolution of char [164]. This explanation could suggest that the conversion of the two fuels, coal and torrefied biomass is independent. It would not be surprising to observe fewer synergistic/antagonist effects during co-pyrolysis of coal and
torrefied biomass in comparison to coal and raw biomass co-pyrolysis. The decrease of both H/C and O/C molar ratios of bulk solid during biomass and coal co-pyrolysis have shown to be accompanied with a surface functionalization [123,167]. Coal, raw biomass and torrefied biomass undergo some important chemical and structural changes during pyrolysis, which have been depicted via a series of analytical approaches [168–170]. The charring process is predominantly accom-panied with the aromatization of the solid matrix, which may be observed through advanced solid state C-13 NMR techniques. The inception of carbon aromatization of biomass solids during torre-faction/pyrolysis was observed at 300 ◦C corresponding to the start of
carbohydrates conversion with the predominance of the aromatic character at 350 ◦C [171]. More significant changes of aromatization
degree and amorphous carbon content are observed in biochar in com-parison to coal char residues during co-pyrolysis. The increasing severity of torrefaction limits those morphological changes leading to a lower graphitization degree and an increased amorphous carbon content of biochar during co-pyrolysis of torrefied biomass and coal. On the other hand, the aromatization of the coal char as well as the amorphous car-bon content remained quasi unchanged whatever the torrefaction tem-perature [131].
Another important factor which affects the co-pyrolysis char struc-ture is the biochemical composition of the biomass. During torrefaction this composition alters mainly due to the degradation of hemicelluloses [172]. The effects of the addition of these biopolymers on the structural transformation in aromatic ring systems of co-pyrolysis char have been reported: the addition of cellulose resulted in a decrease in small (3–5 ring) aromatic structures in co-pyrolysis char, whereas the addition of lignin promoted them and lead to a lower degree of ordering in the char [173]. He and co-workers [131] reported that the char surface of tor-refied biomass and coal co-pyrolysis char was more disordered than when raw biomass was used which may be linked to the relatively higher amount of lignin in torrefied biomass.
Few authors have reported the critical role of inorganics in the char functionalization but also in its structural reorganization. In general, the alkali and alkaline earth metallic (AAEM) species have been reported to break weak bonds to the benefit of stronger bonds, increasing the surface proportion of condensed aromatic rings [174]. In the case of torrefied biomass (with a higher amount of inorganics) an increase in the extent of these reactions occurs which may explain the increase in condensed aromatic carbons reported for the pyrolysis char [175]. This trend highly depends on the nature of AAEM present within feedstocks. Indeed, opposite tendencies were observed in the presence of high Ca and K levels that promote demethoxylation reactions [95]; thus, pre-venting the methoxyphenols known as promotors of aromatic structures to play their role of char aromatization [176].
Shape transition of torrefied materials/biochar has been reported a few times using SEM analysis. The shape of particle evolves with the severity of pyrolysis and depends on temperature [104,177]. The observation of needle-like particle transformation into lamellate particle has been quantitatively confirmed by measurements of carbon lattice, which stretched into sheets as temperature increased [123]. These structures are both driven by the original lignocellulosic composition of feedstocks [123,171,173].
Characterizing the whole structure of char is challenging as their
Table 6
Summary of the effect of torrefaction on co-pyrolysis char structural properties.
Co-pyrolysis char property Effect of torrefaction
Graphitization degree Low
Microporosity High
Degree of aromaticity High
Amorphous carbon High

![Fig. 2. Historical events that allowed the deployment of biofuels ’ research activities [10]](https://thumb-eu.123doks.com/thumbv2/123doknet/12134836.310459/4.892.192.698.88.434/fig-historical-events-allowed-deployment-biofuels-research-activities.webp)