Explorer le déploiement de capacités dynamiques :
le cas de cinq firmes de défense américaines
face aux événements du 11 septembre
Colette DepeyreUniversité Paris-Dauphine, DRM – CNRS, UMR7088
colette.depeyre@dauphine.fr Jean-Philippe Vergne
Richard Ivey School of Business
jvergne@ivey.uwo.ca
Résumé:
Le papier vise à développer une contribution à la fois théorique et méthodologique au sein du courant des capacités dynamiques, qui s’intéresse à la façon dont les entreprises modifient leurs ressources et capacités opérationnelles pour répondre à des changements dans leur environnement. Les recherches comportent aujourd’hui un ensemble de propositions clefs mais buttent régulièrement sur d’importants problèmes : la réalisation d’études empiriques approfondies, l’exploration non seulement du contenu mais également des processus à l’œuvre, la nécessité de distinguer entre différents types de changement. Prêtant attention à ces limites, nous proposons d’explorer le déploiement de capacités dynamiques au travers de trois briques : la reconnaissance que l’environnement a changé (détecter et apprécier), la décision de déployer une capacité dynamique (analyser et décider) et la réorchestration effective d’actifs de l’entreprise (mettre en œuvre). Pour ce faire, nous présentons une étude de cas longitudinale et enchâssée des principaux intégrateurs de systèmes de défense américains entre 1998 et 2007, étudiant la façon dont ils ont chacun répondu aux événements du 11 septembre. Des séries de données relatives aux discours et à l’orchestration d’actifs interne et externe de cinq entreprises (Boeing, General Dynamics, Lockheed Martin, Northrop Grumman and Raytheon) ont été collectées et organisées. Des outils de mesure sont proposés afin d’analyser, dans le temps et de manière comparative entre les firmes, l’attention des dirigeants aux changements de l’environnement, les changements décidés au niveau de la firme et la façon dont ces changements sont mis en œuvre à différents niveaux.
Mots clefs :
Unpacking dynamic capability deployment:
U.S. defense systems integrators’ response to 9/11
1. INTRODUCTIONThe dynamic capability view (DCV) examines how firms alter their resources and operational capabilities when they respond to changes in their environment (Eisenhardt & Martin, 2000; Helfat et al., 2007; Teece, Pisano, & Shuen, 1997; Zollo & Winter, 2002). Dynamic capabilities represent “the Holy Grail of strategic management” (Helfat & Peteraf, 2009: 91) as they promise to explain why and how certain firms manage to sustain a competitive advantage despite profound changes in the industries wherein they operate. While still in its infancy (Di Stefano, Peteraf, & Verona, 2010), DCV research has already converged around a set of core propositions highlighted in recent reviews. Because of imperfect market factor conditions and heterogeneous management skills, firms vary in their ability to control and orchestrate resources and capabilities, especially in dynamic environments. In this context, firms that successfully deploy dynamic capabilities are able to sustain their competitive advantage (Teece, 2007), understood as the ability to create more value than competition (Peteraf & Barney, 2003). How persistent this advantage is depends on barriers to imitation such as time compression diseconomies, asset complementarities, tacit knowledge and causal ambiguity (Leiblein, 2011).
Besides agreement on these core ideas, there is also increasing convergence across scholars that the DCV suffers from important limitations. Recent reviews of the DCV literature share three key observations regarding the evolution of the research stream over the last 15 years (Ambrosini & Bowman, 2009; Arend & Bromiley, 2009; Di Stefano et al., 2010; Easterby-Smith, Lyles, & Peteraf, 2009; Leiblein, 2011). First, there is wide agreement that more empirical work is needed to operationalize DCV constructs such as ‘reconfiguring’, ‘sensing’, or ‘leveraging’. This task is challenging methodologically and it is still unclear what type of data researchers need to gather to be able to measure such intangible notions. Second, dynamic capabilities are not synonymous with sustained superior performance – otherwise the DCV would verge on tautology. This acknowledgment provides scholars with the opportunity to explore two distinct processes: the one that drives firms to deploy DC in the first place and the one that makes deployed DC drive sustained superior performance. While the latter process, which connects DC to performance, has already been studied with some depth (Moliterno & Wiersema, 2007; Pavlou & El Sawy, 2011), the former, which explains why firms would decide to deploy DC in the first place, has received little scholarly attention.
Third, DC have been conceptualized as a means to respond to change in firms’ environment, yet the very notion of change has remained very vague in the DCV literature. A firm without DC may decide to keep changing in ways consistent with an outdated strategic plan while ignoring recent changes in its environment that would require a new direction (Arend & Bromiley, 2009). Conversely, a firm with DC may decide not to respond to changes in the environment because it estimates that the cost of doing so would offset the benefits (i.e., that firm has the capability to alter its resource base but has decided not to use it). Alternatively, a firm (with or without DC) may just get lucky and change in ways that coincidentally happen to be consistent with changes in its environment (Denrell, 2004). In other words, observing the presence or absence of change outside and inside the firm is not sufficient to provide evidence that dynamic capabilities are or are not at work.
It is this paper’s endeavor to contribute to the DCV literature while – and by – being particularly attentive to its past limitations. To operationalize fine-grained DCV constructs such as ‘sensing’, one needs to delve deep into how top management envisions a firm’s position in its environment (Augier & Teece, 2009). To distinguish between different types of change, one needs to assess them in the light of a firm’s recent trajectory and of its top management’s intentions. This implies paying particular attention to how top management processes and analyzes new information about the environment before decisions are made to deploy (or not) the firm’s dynamic capabilities in response to change. By doing this, scholars would be able to focus their investigation on phenomena that are observable and that meaningfully connect the various components of the DCV. Rather than examining the relationship between DC and (superior) performance, this paper thus proposes to investigate the process of DC deployment, from the recognition that the environment has changed to the decision to deploy DC, and to the implementation of asset re-orchestration.
To achieve this objective, we conduct an in-depth longitudinal case study of the U.S. defense systems integrators industry between 1998 and 2007. Five defense giants, namely Boeing, General Dynamics, Lockheed Martin, Northrop Grumman and Raytheon, compete for the major defense systems integration contracts of the Pentagon. In 2001, the 9/11 attacks triggered a massive overhaul of the U.S. military doctrine that dramatically modified the industry landscape. Immediately after the attacks, the five firms’ largest customer, the Pentagon, implemented a new strategy for the U.S. armed forces that puts emphasis on “network-centric warfare” (NCW) and the ability to integrate all national defense capabilities within one single system of systems (Quadrennial Defense Review Report, U.S. Department of Defense, 2001). This profound rethinking of national defense required the five U.S.
defense systems integrators to respond to an industry-wide turbulence that can be considered largely exogenous, because it was triggered by the unexpected 9/11 attacks. The goal of our empirical investigation is to answer the following question: What is the process leading to DC deployment in response to a sudden and massive change in the environment?
We do not have any preconceived ideas about which of the five firms did or did not deploy DC. Because past literature has largely overlooked the process leading to DC deployment, this paper does not seek to test logically derived hypotheses, but rather to explore that process in a controlled setting. We expect our first contribution to the DCV literature to be methodological. We will analyze top management discourse over time as well as how firms actually changed at multiple levels to reconnect the ‘sensing’ and the ‘reconfiguring’ dimensions of the DCV – and we will rely on a set of fine-grained measures to capture these notions. We expect our second contribution to be theoretical, as we will build on our empirical findings to explore the process of DC deployment.
The remainder of the paper is organized as follows. We first review the DCV literature to highlight the main characteristics of DC and how they relate to observable phenomena. We then introduce our empirical setting, describe our data collection routines, and explain how we used the data to track over time, for each of the five firms, a set of observable variables that underlie the DC deployment process (or lack thereof). We then present the main findings and discuss the various trajectories taken by the five defense systems integrators after 9/11 in light of recent performance metrics. Based on these findings, we discuss the process of DC deployment and emphasize our contributions to extant DCV literature as well as some limitations.
2. UNPACKING AND OBSERVING DYNAMIC CAPABILITIES
DC is defined as “the capacity to renew competences so as to achieve congruence with the changing business environment” (Teece et al., 1997: 515). This definition has had tremendous impact on the scholarly and business communities, yet it remains challenging for researchers when it comes to empirical investigation: how, indeed, can we observe a “capacity”? A capacity may or may not be used, so it may or may not have observable outcomes (Easterby-Smith et al., 2009; Godfrey & Hill, 1995; Loasby, 2010). What’s more, that capacity is defined as being intentional and purposeful, namely, management is aware that they are using the capacity when they do, and they do so for a reason (i.e., to achieve congruence with a changing environment). In a way, inferring the existence of such a capacity from the observation of firms may be as tricky as trying to infer whether an individual is capable of
running a marathon without ever seeing her run. If we limit our investigations to observing marathon events, a lot of people that are actually capable of running one (but do not run one) will remain outside our radar. And if we simply assume that all individuals who start running a marathon will pass the finish line, we may wrongly infer that any form of running signals the capacity to run a marathon until the end. Put differently, the question we ask in this section is: How can scholars move from defining DC as a capacity to actually observing DC deployment?
2.1.THREE BUILDING BLOCKS TO OBSERVE DC DEPLOYMENT
DC is about changing a firm’s existing resources to respond to change in the environment. However, observing change at the firm level is not enough to infer the existence of DC. Change can occur for a variety of reasons and managers are not necessarily aware that change is happening. For example, organizational inertia can erode the effectiveness of firm routines without employees noticing it. Perceiving the need for DC deployment requires two conditions. First, the firm must sense that change will be required in the near future. In fact, underlying the DC construct is the idea that firms are not equally capable of monitoring their environment adequately to sense that need for change (Schreyögg & Kliesch-Eberl, 2007). More specifically, the need for change must be perceived at a high level within the firm (i.e., top management), otherwise the information obtained about the environment will fail to translate into actionable strategic moves (Narayanan, Colwell, & Douglas, 2009). As Teece (2007: 1346) puts it, “dynamic capabilities reside in large measure with the enterprise’s top management team”. At the very beginning of the DC deployment process, we thus expect to see top management devote particular attention to what is going on in the firm’s environment. Sensing change in the environment need not result in making the decision to change the firm. Managers may decide to stay put if they estimate that the firm’s resource base is already in line with what the environment will look like in the future. Alternatively, they may recognize misalignment but still estimate that the cost of aligning firm resources will be higher than the benefits derived from it (Zollo & Winter, 2002). Thus, even once top management has sensed change in the environment, they may still decide to not alter the firm’s resource base.
Furthermore, even when they decide to do so, they may still fail to implement the proposed change strategies. The organization may be too inert, or a significant portion of its employees may resist change. If the proposed change strategy involves acquiring new resources or capabilities outside the firm, top management is still constrained by the scarcity of such assets (Lippman & Rumelt, 1982) – if they are unavailable or too expensive on the corporate
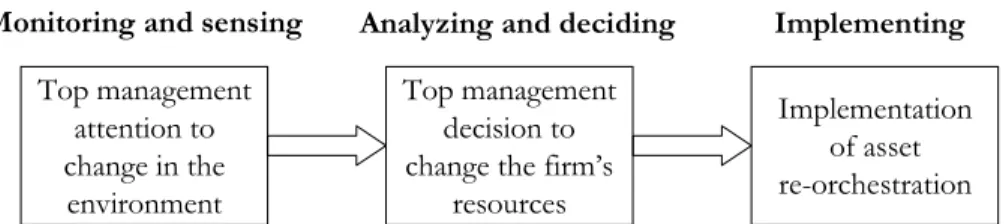
market, then change will not be implemented as proposed. In other words, to investigate DC deployment empirically, we should gather data on the following sequence.
Figure 1 – The building blocks of DC deployment
The next section will argue that each building block in the sequence can be observed if scholars gather the right data, and we will draw on this discussion to introduce the data collection and measurement section. Importantly, each building block implies a significant dose of intentional behavior, i.e., DC deployment, thus defined, cannot just be a lucky coincidence.
2.2.DIFFERENT TYPES OF DYNAMIC FIRM-LEVEL CHANGE
Observing firm-level change may be more difficult than it seems. As understood from a DC perspective, firm-level change entails a purposeful alteration of resources and/or operational capabilities (Helfat et al., 2007). Such alteration can be visible at various levels in the firm and can manifest itself in different ways. For example, it can happen within or across strategic business units (SBUs), and it can imply reshuffling firm resources internally (e.g., management) or integrating new external resources (e.g., a recently acquired patent portfolio). In addition, the alteration can be more or less extensive (Ambrosini, Bowman, & Collier, 2009). At the very least, it implies leveraging existing resources or operational capabilities to use them in the context of new activities or in areas of the firm where they were not used previously (e.g., replicating a competitive intelligence capability across SBUs). The alteration can be more significant and involve adjusting existing resources and capabilities (e.g., upgrade of a core proprietary technology). Adjusting is typically driven by management recognition of the existence of a gap between the current effectiveness of a resource and its potential effectiveness. Both leveraging and adjusting, still, imply a continuous form of change, whereby the past and the future states of the organization remain very similar, owing to the fact that no resource or capability previously unknown has been introduced. A more radical form of change occurs when new resources or capabilities are added to the firm, either because they are being developed internally or integrated within the firm following an external acquisition, an alliance or a joint-venture agreement. One can recognize that firms go beyond leveraging and adjusting when change involves the integration of new resources or
Top management attention to change in the environment Top management decision to change the firm’s
resources
Implementation of asset re-orchestration Monitoring and sensing Analyzing and deciding Implementing
capabilities that indisputably add something new to what a firm can do, at least at some level (e.g., design, production, advertising, collaborating, customer service, new area of business). Finally, we should note that firms, especially large ones, typically implement a dose of resource-level change on a continuous basis. For example, some MNCs acquire multiple companies every year as part of their baseline growth strategy, rather than as a response to exogenous change in the environment. Thus, it seems essential to look at variations in rates of resource renewal over time to distinguish between strategy-as-usual and genuine DC deployment. In other words, cross-firm comparison is not enough to tell which firms deploy DC and which do not. A more robust research design will likely include a longitudinal dimension on top of a cross-sectional component (Leiblein, 2011) so as to analyze data in light of preceding trajectories.
3. CASE SELECTION AND METHOD
The U.S. defense industry is rarely a matter of study in the area of strategic management. Interesting exceptions include Dial & Murphy (1995) on General Dynamics’ radical strategic change in the early 90s, Anand & Singh (1997) and Anand (2004) on acquisition strategies until 1996, or Baum & McGahan (2009) on the increasing role of private military companies, but overall our knowledge of this industry remains superficial. With annual defense spending around US$1.5 trillion globally and the U.S. representing half of it, this industry is huge and quite concentrated geographically. Twelve out of the fifteen largest defense contractors worldwide are American firms (SIPRI, 2009).
3.1.AN EMBEDDED CASE STUDY OF US DEFENSE SYSTEMS INTEGRATORS’ RESPONSE TO 9/11
The U.S. defense industry proved relevant to collect rich and various process data about a few firms, longitudinally, to understand DC deployment in an embedded case study setting (Yin, 2003). The 9/11 attacks represent an opportunity to study the response to a massive exogenous change and examine whether DC were deployed to deal with it.
3.1.1. The Big Five (the subunits of analysis)
In the U.S., five firms have dominated the industry since the mid-1990s: Boeing (BO), Lockheed Martin (LM), Raytheon (RA), General Dynamics (GD) and Northrop Grumman (NG). These five firms, on which we decided to focus, differ significantly from other industry players because they are systems integrators (also known as prime contractors) for the primary defense systems of the U.S. armed forces, such as bombers, submarines, destroyers, missiles, radars, battle tanks or transport vehicles. By contrast, other defense contractors only act as subcontractors for major programs or as prime contractors for much smaller projects
such as aircraft engines and other system parts. In 2009, the average military revenues for the “Big Five” were US$ 29 billion, while the sixth largest U.S. defense contractor, L-3 Communications, was far behind with US$ 13 billion worth of military sales. In 1998, 84% of the 67 main defense programs overviewed by the Government Accountability Office were led by at least one of the Big Five (GAO-08-467SP, 2008).
Table 1 – Introducing the Big Five
BOEING GENERAL DYNAMICS LOCKHEED MARTIN NORTHROP GRUMMAN RAYTHEON GENERAL INFORMATION Company creation 1916 (Boeing/McDD merger in 1997) 1899 1912 (Lockheed/ Martin Marietta merger in 1995) 1929 (Northrop/ Grumman merger in 1994) 1922
Corporate headquarters (2007) Chicago, IL Falls Church, VA
Bethesda, MD Los Angeles, VA Waltham, MA BUSINESSES Military Aircraft
✦
✦
✦
✦
Unmanned Vehicles✦
✦
✦
✦
✦
Space Sytems✦
✦
✦
✦
✦
Artillery & Missiles
✦
✦
✦
✦
✦
Surface Ships & Submarines
✦
✦
✦
✦
Military Vehicles
✦
Defense Electronics
✦
✦
✦
✦
✦
Average share of defense bus. 43% 72% 74% 85% 82%
MAIN RESULTS Turnover in 2007 (98-07 variation) 66,4 B$ (+18%) 27,2 B$ (+448%) 41,9 B$ (+59%) 32,0 B$ (+260%) 21,3 B$ (+9%)
Market cap. variation (98-07) +111% +381% +158% +428% +106%
Average EBITDA margin (98-07) 8,0% 12,3% 7,7% 11,8% 9,9%
Average rank in Pentagon Top (prime contract awards, 98-07)
2 4 1 3 5
The Big Five are responsible for all the major evolutions of the military equipment used by the U.S. armed forces (Army, Navy, Air Force, Special Forces, Rangers, National Guard, and Marines). They work very closely with their largest customer, the Pentagon, which provides guidelines regarding the future of the armed forces in relation to military doctrine, geopolitics, technology, and desired capabilities. At all levels, the Pentagon’s vision has gone through major change, not only with the end of the Cold War but even more so after 9/11.
3.1.2. From the Cold War to 9/11 and the rise of NCW (the context)
The fall of the Soviet bloc led to a rethinking of U.S. military strategy. U.S. forces had from now on to be able to fight simultaneously two major regional conflicts in the world. Then, given the rising asymmetric threats and smaller conflicts, the 1997 Quadrennial Defense
Review Report (U.S. Department of Defense, 1997)added the need for more global presence. The report called for information technologies to transform warfighting “by taking advantage of the Revolution in Business Affairs that [had] occurred in the commercial world” – with a symmetric “Revolution in Military Affairs” (RMA). But what this “revolution” was precisely about was not clear. A nebula of concepts were being discussed like the “full spectrum dominance” concept of the Joint Vision 2010 (U.S. Department of Defense, 1996) or the Navy concept of “Network-Centric Warfare” (Cebrowksi & Garstka, 1998) – ships were to be conceived as swarms and be smaller, lighter, faster; complexity was moving from the nodes (i.e. the ships) to the network. C4ISR systems (Computerized Command, Control, Communications, Intelligence, Surveillance and Reconnaissance) were also starting to be mentioned as a way to redirect the field of defense electronics. At the end of the 90s, doctrine renewal was on the way but with no clear picture of how the “integrated system of systems” that the 1997 report was envisioning would actually translate into new military equipment. There was a controversy among defense firms about what this techno-organizational change meant. Did the design and production of these systems of systems involve a shift in the way they were running their business? If such a shift should take place, what would it imply? This period of doubts will be the focus of the first sequence of our case study.
Then, the events of 9/11 sadly gave substance to the new threats that the U.S. were facing and shed light on several gaps in national defense capabilities. 9/11 acted as a trigger in the RMA. With both the Quadrennial Defense Review Report and the Network Centric Warfare Report
to Congress (U.S. Department of Defense, 2001), the “transformation” of US military was
officially underway. Several key contracts were awarded in 2002, like the ones for the U.S. Army Future Combat Systems or the U.S. Coast Guard Deepwater programs. This clarification in the shape of the new defense programs was enhanced by a dramatic increase in the U.S. defense budget. After a 10-year long decrease of more than 50%, US defense procurement and R&D outlays started to grow again in 2001, respectively by 6,2% and 4,4% in 2001 and by 7,9% and 5,7% in 2002. This period of growth will be the focus of the second sequence of our case study. The rise to prominence of the NCW concept is visible in Figure 3 below, which shows on the right-hand scale the increase in the proportion of books citing the NCW concept as registered in the Google Ngram search engine. In other words, while the
NCW revolution was discussed prior to 9/11, the terrorist attacks represented an exogenous shock that suddenly made NCW highly salient to all defense industry stakeholders. For the Big Five, the change was too massive and important to miss, and appropriate strategic responses were required.
3.1.3. A cross-sectional, longitudinal case study design and a quasi-natural experiment
Our embedded case study is thus designed with a longitudinal perspective, so as to focus on the process of DC deployment (or absence thereof) in a controlled, quasi-experimental setting, where 9/11 represents an exogenous shock that permits before/after comparison of firm behavior. The temporal bracketing (Langley, 1999) is neither theoretical nor arbitrary. The first sequence starts in 1998, a pivotal year when the post Cold War consolidation wave eventually reached an end with the cancellation of the planned merger between LM and NG. The timeframe allows focusing on the period before 9/11, with some changes that were starting to emerge, and the period after, when these changes crystallized. 9/11 both builds on trends that were going on and acts as a trigger for change. Each firm’s trajectory will be studied in detail while keeping in mind this industry-wide pace.
The design also allows for cross-case comparison (Eisenhardt, 1989) between the five firms while holding constant their environment, as they compete against one another in the same industry and have to face similar changes in market conditions. The five firms are both similar and dissimilar enough to allow for a meaningful and rich comparison (see Table 1 above) and the fact that it is an embedded case study – not a multiple-case one – provides us with many insights regarding how the evolution of competitive conditions interacts with the evolution of each firm’s capabilities.
3.2.DATA COLLECTION
Several sources of information were identified as consistent sets of data across firms and over time. Our goal was to collect rich data to design measures that capture the three building blocks of DC deployment outlined above in Figure 1.
First, we gathered 50 letters to shareholders to analyze the strategic discourse of top management (in the firms’ annual reports from 1998 to 2007). Such letters are a meaningful way to capture managerial attention, particularly for comparison across companies and in longitudinal designs (Kaplan, 2008; Pollach, Forthcoming). The letters include thematic emphases and descriptions by firms of their surrounding environment and of their strategic orientation and actions. We also gathered additional statements of top managers as reported in
press releases and newspaper articles, collected in relation to punctual actions such as a new strategic plan, an acquisition, a reorganization or a winning bid.
Then, to put these discourses into perspective – should they be decoupled from actions – and study the firms’ actions in more detail, we gathered extensive data on internal and external asset re-orchestration (e.g., reorganization of business units, renewal of product lines, acquisitions and divestitures, alliances). These data were obtained from annual reports, industry reviews by external stakeholders, two specialized databases (Mergent Database and Infobase, a private competitive intelligence provider based in Washington, D.C.). In addition, we collected commentaries on corporate activity by external actors such as financial analysts, defense experts and government officials, to look for potentially diverging interpretations of firm strategies. These data come from business newspapers and specialized press outlets such as Defense Daily, Jane’s Defence, and Defense News.
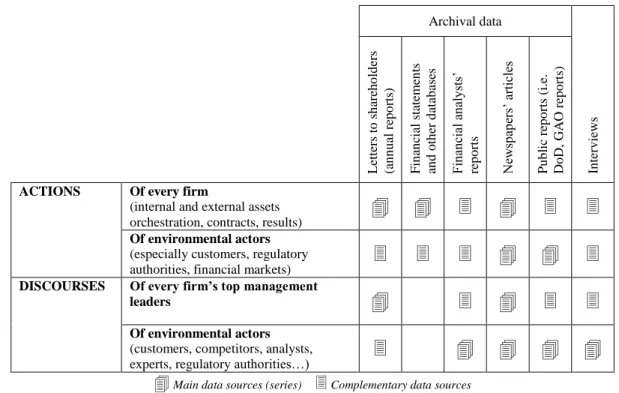
Finally, all these archival data were complemented with 21 semi-structured interviews, which were conducted in the U.S. and in Europe with company officials, defense industry experts and government representatives. We transcribed the interview material and used it to validate our interpretation of the findings. Table 2 summarizes the main sources and their use to trace the discourses and assets orchestration of the five firms.
Table 2 – Series of data and sources of information
Archival data In terv iew s Letters to sh are h o ld ers (a n n u al re p o rts) F in an cial sta tem en ts an d o th er d atab ase s F in an cial an al ysts’ re p o rts Ne ws pa pe rs’ article s P u b lic rep o rts (i. e. Do D, GA O rep o rts)
ACTIONS Of every firm
(internal and external assets
orchestration, contracts, results)
Of environmental actors
(especially customers, regulatory
authorities, financial markets)
DISCOURSES Of every firm’s top management
leaders
Of environmental actors
(customers, competitors, analysts,
experts, regulatory authorities…)
Main data sources (series) Complementary data sources
Table 2 distinguishes between main and complementary sources of data, because several sources were often combined to gather as much information as possible. For example,
financial statements or messages to shareholders allowed detecting reorganizations of business units, but to better grasp the content and context of these reorganizations, complementary information was then collected from press releases, newspapers’ articles, analysts’ reports and sometimes interviews. In the same way, data on mergers and acquisitions were compiled from specialized databases and complementary data were found in annual reports and newspapers. The combination of several sources also allowed for triangulation.
3.3.DATA REDUCTION AND MEASURES
Our goal was not only to gather rich data but also to restitute them with richness (Weick, 2007) and rigor (Gibbert, Ruigrok, & Wicki, 2008). To examine the process of DC deployment over time and across firms, we constructed a series of measures that capture the most important dimensions of DC identified in the literature review above. Since we are primarily interested in firm response (or lack thereof) to industry-wide change following 9/11, our research design emphasizes the observation of cross-firm differences in behavior over time. Put differently, we are looking for variance in the way firms alter their behavior as a reaction to the changes triggered by the 9/11 attacks. Thus, our case study design is not unlike a “differences-in-differences” model wherein firm-specific unobserved heterogeneity is controlled for by looking at the first differences of the model’s independent variables, which is made possible by a quasi-natural experiment setting wherein 9/11 represents an exogenous shock.
3.3.1. Top management attention to change in the environment
The first stage of the DC deployment process involves attentional mechanisms (Figure 1). To capture the extent of top management “sensing” (Teece, 2007) and “monitoring” (Schreyögg & Kliesch-Eberl, 2007), we content-analyzed all the letters to shareholders opening the five firms’ annual reports over the period of study (n=50). Such data have been used in prior works on managerial attention as they readily express what top management deem important and which issues they decide to attend to (Barr, 1998; Eggers & Kaplan, 2009; Fiol, 1990). In each letter, we calculated the proportion of text devoted to discussing how the defense industry is changing. By looking at proportions, we control for heterogeneity in letters’ length and are able to observe how much attention top management devotes to various topics in relative terms. We paid particular attention to the context surrounding the occurrence of words describing the new industry trend, such as “revolution in military affairs (RMA)”, “integrated systems”, “systems of systems”, “network-centric warfare (NCW)”, or
“cyberspace revolution” (e.g., “I expect each of our sectors to play a key role in this cyberspace revolution - a revolution in which wars will be won not only by the fastest and most capable aircraft, but also by the fastest computer chip an the smartest, most robust software.” – NG 1999).
3.3.2. Top management discourse on firm-level change
Using a similar coding procedure, we calculated the proportion of text devoted to firm-level change, while distinguishing between four dimensions consistent with the literature review above. This measure corresponds to the second stage of the DC deployment process (Figure 1) and captures purposeful decision-making seeking to “renew competences” (Teece et al., 1997: 515). The first dimension includes discourse indicating management decision to leverage existing resources and operational capabilities across the firm (e.g., “By creating a new business area, Integrated Systems & Solutions, we are leveraging technical expertise across the breadth of Lockheed Martin to address our customers’ requirements for highly integrated, networked solutions” – LM 2003). The second dimension includes discourse on adjusting existing resources and operational capabilities to improve their effectiveness (e.g., “We have flattened the organizational structure to improve controls and increase organizational simplicity” – RA 1999). The third dimension is about adding new resources or capabilities to the firm through external acquisitions, alliances or joint-venture agreements (e.g., “We have made acquisitions that broadened our product lines and increased our portfolio of programs and technologies – all in anticipation of our customers’ evolving requirements” – GD 1998). The fourth dimension is also about adding new resources and capabilities, but this time by developing them internally (e.g., “We created two brand-new businesses in 2000. (…) ‘Markets’ is an active concept. The best companies do more than respond to market conditions. They shape the markets of tomorrow” – BO 2000).
3.3.3. Resource and capability renewal
The third stage of the DC deployment process consists in renewing firm resources and operational capabilities “to achieve congruence with the changing business environment” (Teece et al., 1997: 515). Asset renewal includes a variety of components, such as asset acquisition and integration, internal reorganization (e.g., a SBU is dismantled and its assets are spread across other SBUs), scale or scope adjustments (e.g., non-profitable units within an existing SBU are divested), or asset recombination (e.g., a new SBU is created from a combination of assets previously spread across other SBUs). To examine asset renewal, we decided to present the most significant changes implemented by firms over the period of study
in a visual way. Figure 2 displays the results. A visual presentation of asset renewal seemed the best option to summarize the collected data, as it allowed a rich and refined comparison of renewal patterns across firms and over time without reducing a vast amount of heterogeneous data to a couple of rough proxies.
Figure 2 – Assets re-orchestration
2.A. General Dynamics’ asset re-orchestration
` 2.B. Northrop Grumman’s asset re-orchestration
&
M&Acquisitions and divestitures are represented per year for every SBU:
H when it is globally reinforced I when it is globally reduced L when there are as much
acquisitions as divestitures M&Several types of change are reported:
the setting up of a new SBU the removal of a SBU a name change
the re-orchestration of assets between SBUs the move of a business unit from one SBU to another (NC)
M&Re-orchestration is represented at the level of SBUs, as reported by the five firms in their financial statements. “Non-reporting” SBUs as well as groups of SBUs mentioned by some firms are also represented.
M&A star signals the presence of a central simulation laboratory, a key asset that was developed for the design of network-centric systems. SBU Non-reporting SBU Group of SBUs ! 1998 1999 2000 2001 2002 2003 2004 2005 2006 2007 Marine Systems Combat Systems Information Syst. & Tech.
Aerospace Other Marine Systems Combat Systems Other Information Syste--ms & Technology " # $ " " " " " " " " " " " " " " " " " ! 1998 1999 2000 2001 2002 2003 2004 2005 2006 2007 IT-Logicon Integrated Systems & Aerostructures Aerospace Space Technology Integrated Systems Electronic Systems Electronic Sensors & Systems IT Component Technologies Integrated Systems Space Technology Electronic Systems Ships Mission Systems Ships
Information & Services IT Technical Services Mission Systems H (NC) (NC) Integrated Systems Electronic Systems IT Component Technologies Ships " # $ # # # # # # # # # # " " " " # # # # # # $ $
2.C. Boeing’s asset re-orchestration
2.D. Raytheon’s asset re-orchestration
FI GURE 2.a Boeing asset re-orchestration
! !
1998 1999 2000 2001 2002 2003 2004 2005 2006 2007
Commercial Airplanes
Military Aircraft & Missile Systems Space & Communications Other Commercial Airplanes
Military Aircraft & Missile Systems Space & Communications Commercial Airplanes Aircraft & Weapon Systems Network Systems
Launch & Space Systems Support Systems Integrated Defense Systems Commercial Airplanes Precision Engage- -ment & Mobility
Network & Space Systems Support Systems Boeing Capital Corporation Boeing Capital Corporation Other Air Traffic Management Connexion by Boeing Boeing Capital Corp. Air Traffic Management Connexion by Boeing Other Other (NC) " $ # " " # # " " " " " " " " # " # # Integrated Defense Systems ! 1998 1999 2000 2001 2002 2003 2004 2005 2006 2007 Engineering & Construction Raytheon Systems Company
Defense Systems
Sensors & Elec- -tronic Systems
C3 Systems
Intelligence, Information & AIS
Commercial Electronics Training & Services Aircraft Engineering & Construction Raytheon Systems Limited
Electronic Systems C3 & Informa- -tion Systems Aircraft Integra- -tion Systems Commercial Electronics Training & Services Aircraft
Government & Defense
Integrated De- -fense Systems
Space & Air- -borne Systems Missile Systems Network Centric Systems Technical Services Aircraft Intelligence & Information Syst.
Government & Defense Integrated De- -fense Systems
Space & Air- -borne Systems Missile Systems Network Centric Systems Technical Services Aircraft Intelligence & Information Syst. (NC) " # $ " " " " " " " " " " " " " # # # " # " # # # #
2.E. Lockheed Martin’s asset re-orchestration
4. FINDINGS
4.1.INTER-FIRM AND LONGITUDINAL COMPARATIVE FINDINGS
Findings can be looked at in complementary ways. This section first reports, for each of the three building blocks, the main similarities and differences over time and across firms and spots some potential gaps between them. We then propose a grouping of firms in relation to DC deployment.
4.1.1. Observing the three building blocks, over time and across firms
First, regarding top management attention as captured in letters to shareholders (Figure 3), comparative findings show that GD and NG are the two firms that start referring early on to ongoing changes in military doctrine (i.e., before 9/11). For example, in its 1998 annual report Northrop Grumman states: “We recognized early this decade that we may be entering a period of revolutionary change in military affairs, propelled by the doctrinal implications of technologies ranging from stealth and precision targeting to advanced situation awareness and battle management capabilities. Should such a ‘revolution in military affairs’ become a central tenet of U.S. defense planning, our business focus on sensors, electronic warfare
!
1998 1999 2000 2001 2002 2003 2004 2005 2006 2007
Aeronautics
Electronics
Space & Strategic Missiles
Energy & Other
Integrated Bus. Solutions Enterprise Information Syst Information Mngt Solutions Information &
Tech--nology Services Aeronautical Systems Systems Integration Space Systems
Corporate & Other
Technology Services LM Global Telecom. Aeronautics Electronic Systems Space Systems
Corporate & Other Technology Services Integrated Syst & Solutions Aeronautics Electronic Systems Space Systems
Corporate & Other
Information Syst. & Global Services
(NC) (NC) (NC) (NC) (NC) Aeronautical Systems Systems Integration Space Systems
Corporate & Other Technology Services " # $ # # # $ $ $ $ $ $ $ # # # # # # $ " $ $ # # # #
systems, space, and information technologies will reinforce Northrop Grumman’s competitive position well into the next century.” Or General Dynamics emphasizes in 1998 the importance of “battlefield digitization skills” and in 1999 its “growing expertise in total battlespace information management systems that are key to military superiority in the 21st century”. In 1998, no other firm makes reference to these types of changes in their letters to shareholders. There is then a peak in 2001 for all firms in their attention to change in the industry as well as increasing references in the second sequence compared to the pre-9/11 period. As shown by our proxy for societal attention, from 2002 NCW becomes a popular term.
Figure 3 – Comparative discourses in letters to shareholders
Second, regarding top management discourse on firm-level change, Figure 3 shows that all the firms talk more about change before the shock of 9/11. However, if one looks closely at the four types of change, Figure 3 indicates that while BO, LM and RA talk more about adjusting capabilities during the first sequence than the second, it is the reverse for GD and NG. During the first sequence, BO, LM and RA seem indeed embedded in post-consolidation issues. Between 1994 and 1998, they led the wave of mergers and acquisitions and incorporated many assets that require some adjustments at the end of the 90s. LM and RA, in particular, suffer in 1999 a deep crisis and therefore put stress on this necessary adjustments
0 10 20 30 40 0 0,05 0,1 0,15 0,2 0,25 0,3 0,35 1998-2000 2001 2002-2007 S o ci et a l a tt e n ti o n M a n a g e ri a l a tt e n ti o n
Sensing the Network Centric revolution
NCW books BO GD LM NG RA 0 0,1 0,2 0,3 0,4
BO1 BO2 GD1 GD2 LM1 LM2 NG1 NG2 RA1 RA2
M a n a g e ri a l a tt e n ti o n
Discourse on firm-level change before (1) and after (2) 9/ 11
developing ext developing int leveraging adjusting
(e.g. “We began 2000 with firm commitments to serve customers better, improve financial performance, manage for cash, drive operational improvements, and improve planning quality” – LM 2000; “Our businesses still must improve processes and reduce complexity; we are on the right track, but it will take time” – RA 1999). Also, while BO and RA always talk more about developing new capabilities internally rather than externally, it is the reverse for GD, LM and NG, which more extensively report about mergers and acquisitions.
Third, regarding assets renewal (Figure 2), the evolution of GD departs from the other ones in that it is strikingly stable over the period. Two SBUs (Information Systems and Technologies, Aerospace) are set up in 1998 and 1999 through a series of acquisitions, without impacting the organization of the two other SBUs (Marine Systems, Combat Systems), and from then on the four SBUs remain stable until the end of the period. It does not mean that the content of each SBU does not evolve – conversely, two of them are deeply reinforced through acquisitions – but there is no asset re-orchestration between SBUs over the period of study. The evolution of NG is similar to the one of GD in that: new SBUs are created through external assets, in 2001 and 2002; other SBUs are maintained through the whole period (the only divested SBU comes from side assets acquired with Litton Industries and that were rapidly spotted as outside of the range of the firm’s activities); and there are no re-orchestration between SBUs (only some activities that are redirected from one unit to another but without shaking the overall organization of SBUs). In sum, GD and NG have the most stable trajectories.
The evolution of NG is still slightly different from that of GD: because a central simulation lab appears from 2002, because a new SBU is internally set up in 2006 (for Technical Services) and because some SBUs are grouped under the same heading also in 2006. However, these changes remain minor when compared to the trajectories of BO, LM and RA. The latter indeed have a higher degree of internal asset re-orchestration in that they each engage at least twice in a major overhaul of their SBUs’ breakdown with an adjustment of the changes overtime (the evolution of BO and LM even show some backward moves – with for example the failure of Lockheed Martin Global Telecommunications or the re-gathering of Network and Space Systems at Boeing – while RA, after a massive SBUs overhaul in 2002, remained more stable).
In relation to the exogenous shock under study, it can be noticed that 2002 is the year with the largest amount of re-orchestrations between SBUs. The figures also show the progressive highlighting of central simulation laboratories for almost all the firms, except GD. BO starts in 2000, NG follows in 2002, LM in 2003 and RA in 2005.
Regarding external asset re-orchestration, divestitures are globally more frequent during the first sequence, while mergers and acquisitions are increasingly present during the second sequence. However there are some discrepancies between firms: until 2002, while BO, LM and RA are majorly divesting assets, GD and NG are busy acquiring businesses. Moreover NG, after missing major bids in the 90s, is the only firm that gets here involved into major acquisitions that fundamentally reshape its portfolio (adding naval and space assets) when Litton, Newport News Shipbuilding and TRW are bought in 2001 and 2002. As for more minor acquisitions, LM and RA are the two firms that significantly increase their number after 2002.
To finish with this first exploration of our findings, we can note that it is striking that GD is among the firms that talks the most about change in the environment and at the firm-level, while showing very few changes in terms of internal asset re-orchestration. Over the period many assets are bought and new lines of business appear (aircraft, space), but without shaking the overall SBUs’ organization and with no mention of any central simulation lab (while it is a key asset that is put forward by the four other firms for the design of network-centric systems). To a lesser extent but still significantly, NG is also early in talking about change but does not show as much change at the level of SBUs when compared to BO, LM and RA.
4.1.2. Proposition of an induced typology
If we now go one step further in our analysis, we can spot from these findings different types in DC deployment. Regarding the first building block of DC deployment (sensing and monitoring), GD and NG stand as the two actors that somehow anticipate the industry-wide change while BO, LM and RA adopt a more reactive behavior. Regarding the second building block (analyzing and deciding), GD and NG also stand out in that, during the first sequence, they talk more about developing their business through external assets, when the three other firms insist on adjusting their assets, by comparison with the second sequence. As for the third building block (implementation of asset re-orchestration), the two sets of firms can also be opposed in that GD and NG are more active during the first sequence, making use of external renewal of assets, while BO, LM and RA are more intensive in their actions during the second sequence, and with more internal overhaul (during the first sequence, there are some adjustments in their assets but they do not seem to be well adapted yet as they are followed by new changes after 2001, or to put it another way, the change at work during the first sequence stand more as a consequence of the past than as an anticipation of new
patterns). We can also note that LM shows more delay in its post-9/11 reaction and is more fumbling.
Considering the overall process of DC deployment, we could thus infer that GD and NG deployed DC by anticipation, BO and RA by reaction, and that LM belatedly attempted to deploy DC but failed to some extent to do so. However, given the noticed discrepancies between top management attention to change and the subsequent nature of asset re-orchestration (especially for GD), we can wonder whether an anticipated deployment leads to more continuous and perhaps less extensive change in a firm’s capabilities.
4.2.ROBUSTNESS OF THE FINDINGS
4.2.1. Performance outcomes
Our case study led us to infer the existence of three distinct groups in our sample when it comes to DC deployment (or lack thereof). Because the DC literature is premised on a causal relationship between DC and performance, we checked whether a similar grouping of firms emerged from performance data. We chose to look at yearly operational margin, which is the best indicator of performance in our context. There have been several sudden variations across firms, at different points in time, in the way asset values are recorded in the companies’ balance sheets, which makes ROA a poor candidate to compare firms over time. ROE is sensitive the capital structure of firms, which in the defense industry depends on multiple factors, including the type of segments and customers served by each firm. ROI (return on operating investment) was consistently available in databases, yet the nature of the contractual relationships between the U.S. government and defense contractors makes it difficult to track which part of fixed defense program cost is supported by the State and with which time horizon. Operating margins, on the other hand, readily capture the capacity of firms to earn a living given all the contractual conditions that are fixed in advance by the customer. In addition, it is the best measure to track over time the firms’ capacity to contain costs – the primary source of competitive advantage in the industry since the fall of the USSR. In fact, the five firms discuss at length the evolution of operating margins in their annual reports, as most industry experts and stakeholders use it as the most informative indicator of firm performance. Figure 4 below displays yearly operating margins for the five firms between 1997 and 2006.
Figure 4 – Comparative EBIDTA margins
Source: Thomson One Banker
As visible on the graph above, NG and GD stand out over the whole period. They consistently outperform competition and their operating margins have a lower variance. While patterns emerge less clearly from the three other curves, LM’s operating margin hits a minimum in 2002, consistent with the fact that the firm was the least prepared to face a changing environment. On the other hand, RA and BO are able to maintain a high operating margin in 2002, as they respond to change by deploying a DC, yet their lack of anticipation in the previous period seems to have consequences later on as operating margins decrease significantly for both firms in 2003. Even if the nature of the data presented here does not allow us to infer any causal relationship between DC deployment and performance, the performance patterns are partly consistent with the typology of DC deployment proposed above. At the very least, nothing in the performance patterns seems to be at odds with the paper’s findings – and they appear consistent with the broader DC literature.
4.2.2. Cluster analysis
Based on our case study, we inferred inductively a typology of DC deployment strategies. It adds to prior developments in the DC literature by unpacking the process of DC deployment and by shedding new light on the trade-offs between deployment and non-deployment, and between deployment of an “anticipation” versus a “response” DC. However, despite our important efforts aimed at triangulating our data and validating our interpretation across multiple sources at three levels of the DC deployment process, our typology is still a product of our own interpretive schemes. To assess the extent to which the latter influence the structure of the typology, we decided to compile a table summarizing all the quantified data pertaining to DC deployment for the five firms. For both periods (i.e., before and after 9/11),
0 5 10 15 20 1998 1999 2000 2001 2002 2003 2004 2005 2006 2007 BO GD LM NG RA
it includes the proportions, averaged on a yearly basis, of top management attention devoted to sensing change and to firm stakeholders. It also includes similar proportions regarding decisions to leverage, adjust, and add (internally and externally) resources or operational capabilities. Furthermore, it includes measures of asset renewal for three different periods: 1998-2000 (before), 2001-2002 (during), and 2003-2006 (after). Finally, we included the mean operating margins before and after 9/11 in the table. We then run a hierarchical cluster analysis on the 17 variables to obtain a typology of the five firms using the Ward’s distance method. The Figure 5 below displays the results as a dendrogram.
Figure 5 – Dendrogram using Ward Linkage
The firms are grouped in three categories that are consistent with our inductively derived typology: BO and RA are grouped together, and so are NG and GD, while LM is isolated until the cluster analysis forces the existence of exactly two categories of firms, in which case LM appears closer to (BO, RA) than to (NG, GD). This is consistent with the idea that LM, BO and RA adopted a “wait and see” strategy, while NG and GD anticipated change in their environment early on.
5. CONCLUDING DISCUSSION
As outlined in the introduction, we can discuss our case-study analysis at two levels.
Our first contribution is methodological. We analyzed, over time and across firms, top management discourse on the environment and on firm-level change, as well as how firms actually changed at multiple levels, to reconnect the different dimensions of DC deployment. We relied on a set of fine-grained measures to capture these three building blocks that we identified from the literature. The collection of data on discourses and actions, their translation into three constructs and their visual representation in Figures 2 and 3 allowed us
to track down the process of DC deployment (or lack thereof) for each firm. The longitudinal and comparative perspective was essential to interpret our data and assess the presence of change for every firm.
It is interesting to notice that the observed data does not always show a systematic process whereby every deployment would imply first, sensing change in the environment, second, deciding of the type of change that is needed and third, implementing it. The firms’ trajectories can be much more fumbling: we mentioned in our literature review that a firm can sense change in the environment but decide not to change, or it can decide to change but fail to do so; also, assets can be re-orchestrated without any explicit discourse preceding it and top management can retroactively relate it to change in the environment and at the firm-level. The analysis of these vacillations was beyond the scope of our analysis. We focused on the definition of appropriate measures to track the three building blocks of DC deployment. Further analysis would then be required to explore within-firm autocorrelation across the three building blocks. We could also explore some patterns in how DC can unfold: in our case, when a new SBU is created it is most of time supported (even sometime triggered) by the acquisition of external assets; the creation of non-reporting SBUs (signaling uncertainty) can pave the way for divestitures or on the contrary catalyze the development of new initiatives; discourse on leveraging can refer to a circulation of assets between SBUs or to a deeper re-orchestration of SBUs; it can also follow a major merger or acquisition that requires a reorganization of assets within the firm, etc.
Our second contribution is theoretical. We proposed to explore the process of DC deployment
by tracking three building blocks. Our model follows Teece (2007) and Loasby (2010)1 in that
it insists on the conjectures that are formulated by the firms. When top managers talk about change in the environment and at the firm level and undertake assets re-orchestration, they formulate and re-formulate conjectures about their firm’s capabilities. Thereby DC progressively deploy. Our empirical findings allowed us to distinguish between two types of deployment: by anticipation or as a response to change in the environment. Our findings also distinguished between change at different levels (internal and external asset orchestration, re-orchestration between SBUs and addition/removal of a product line, etc.) and suggested that an anticipated deployment of DC does not equate with the most extensive change, even the contrary. Further research could explore this link between timing and extensiveness of change
1 “Because of uncertainty, entrepreneurs/managers must make informed conjectures about the path ahead. These
conjectures become working hypotheses that can be updated as evidence emerges” (Teece, 2007: 1323). “Since the set of possible combinations and applications can never be known – remember the fundamental assumption of uncertainty – the potential value of any element depends on future imaginings” (Loasby, 2010: 1308).
(in particular, our robustness check focused on rates of change, not on the detailed content of change). Based on Ambrosini et al. (2009), we distinguished between leveraging and adjusting as more continuous types of change and internal and external developments as more extensive change. However, the use of longitudinal data also proved essential to go beyond this initial typology and evaluate, for each firm, the extensiveness of change.
RÉFÉRENCES
Ambrosini, V. & Bowman, C. 2009. What are dynamic capabilities and are they a useful construct in strategic management? International Journal of Management Reviews, 11(1): 29-49.
Ambrosini, V., Bowman, C., & Collier, N. 2009. Dynamic Capabilities: An Exploration of How Firms Renew Their Resource Base. British Journal of Management, 20(S1): S9-S24.
Anand, J. & Singh, H. 1997. Asset redeployment, acquisitions and corporate strategy in declining industries. Strategic Management Journal, 18(Summer Special Issue): 99-118.
Anand, J. 2004. Redeployment of Corporate Resources: A Study of Acquisition Strategies in the US Defense Industries, 1978-1996. Managerial and Decision Economics, 25(6-7): 383-400.
Arend, R. J. & Bromiley, P. 2009. Assessing the dynamic capabilities view: spare change, everyone?
Strategic Organization, 7(1): 75-90.
Augier, M. & Teece, D. J. 2009. Dynamic Capabilities and the Role of Managers in Business Strategy and Economic Performance. Organization Science, 20(2): 410-421.
Barr, P. S. 1998. Adapting to unfamiliar environmental events: a look at the evolution of interpretation and its role in strategic change. Organization Science, 9(6): 644-649.
Baum, J. A. C. & McGahan, A. 2009. Outsourcing War: Private Military Companies and Command-and-Control Capabilities after the Cold War. Working paper.
Cebrowksi, A. K. & Garstka, J. H. 1998. Network-Centric Warfare - Its Origin and Future. U.S. Naval
Institute Proceedings Magazine, 124(139).
Denrell, J. 2004. Random Walks and Sustained Competitive Advantage. Management Science, 50(7): 922-934.
Di Stefano, G., Peteraf, M., & Verona, G. 2010. Dynamic capabilities deconstructedz : a bibliographic investigation into the origins, development, and future directions of the research domain.
Industrial and Corporate Change, 19(4): 1187-1204.
Dial, J. & Murphy, K. J. 1995. Incentives, downsizing, and value creation at General Dynamics.
Journal of Financial Economics, 37(3): 261-314.
Easterby-Smith, M., Lyles, M. A., & Peteraf, M. 2009. Dynamic Capabilities: Current Debates and Future Directions. British Journal of Management, 20: S1-S8.
Eggers, J. P. & Kaplan, S. 2009. Cognition and renewal: comparing CEO and organizational effects on incumbent adaptation to technical change. Organization Science, 20(1): 461-477.
Eisenhardt, K. M. 1989. Building theories from case study research. Academy of Management
Review, 14(4): 532-550.
Eisenhardt, K. M. & Martin, J. A. 2000. Dynamic Capabilities: What Are They? Strategic
Management Journal, 21(10/11): 1105-1121.
Fiol, C. M. 1990. Explaining strategic alliance in the chemical industry. In A. S. Huff (Ed.), Mapping
Gibbert, M., Ruigrok, W., & Wicki, B. 2008. What passes as a rigorous case study? Strategic
Management Journal, 29(13): 1465-1474.
Godfrey, P. C. & Hill, C. W. L. 1995. The Problem of Unobservables in Strategic Management Research. Strategic Management Journal, 16(7): 519-533.
Helfat, C. E., Finkelstein, S., Mitchell, W., Peteraf, M. A., Singh, H., Teece, D. J., & Winter, S. G. 2007. Dynamic Capabilities. Understanding Strategic Change in Organizations. Oxford: Basil Blackwell.
Helfat, C. E. & Peteraf, M. 2009. Understanding dynamic capabilities: progress along a developmental path. Strategic Organization, 7(1): 91-102.
Kaplan, S. 2008. Cognition, capabilities, and incentives: Assessing firm response to the fiber-optic revolution. Academy of Management Journal, 51(4): 672-695.
Langley, A. 1999. Strategies for theorizing from process data. Academy of Management Review, 24(4): 691-710.
Leiblein, M. J. 2011. What Do Resource- and Capability-Based Theories Propose? Journal of
Management, 37(4): 909-932.
Lippman, S. & Rumelt, R. 1982. Uncertain imitability: An analysis of interfirm differences in efficiency under competition. Bell Journal of Economics, 13: 418-438.
Loasby, B. J. 2010. Capabilities and strategy: problems and prospects. Industrial and Corporate
Change, 19(4): 1301-1316.
Moliterno, T. & Wiersema, M. 2007. Firm performance, rent appropriation, and the strategic resource divestment capability. Strategic Management Journal, 28(11): 1965-1987.
Narayanan, V. K., Colwell, K., & Douglas, F. L. 2009. Building Organizational and Scientific Platforms in the Pharmaceutical Industry: A Process Perspective on the Development of Dynamic Capabilities. British Journal of Management, 20(S1): S25-S40.
Pavlou, P. A. & El Sawy, O. A. 2011. Understanding the Elusive Black Box of Dynamic Capabilities.
Decision Sciences, 42(1): 239-273.
Peteraf, M. & Barney, J. B. 2003. Unraveling the resource-based tangle. Managerial and Decision
Economics, 24(4): 309-323.
Pollach, I. Forthcoming. Taming Textual Data: The Contribution of Corpus Linguistics to Computer-Aided Text Analysis. Organizational Research Methods.
Schreyögg, G. & Kliesch-Eberl, M. 2007. How dynamic can organizational capabilities be? Towards a dual-process model of capability dynamization. Strategic Management Journal, 28(9): 913-933. Teece, D. J., Pisano, G., & Shuen, A. 1997. Dynamic capabilities and strategic management. Strategic
Management Journal, 18(7): 509-533.
Teece, D. J. 2007. Explicating Dynamic Capabilities: the Nature and Microfoundations of (sustainable) enterprise performance. Strategic Management Journal, 28: 1319-1350.
Weick, K. E. 2007. The generative properties of richness. Academy of Management Journal, 50(1): 14-19.
Yin, R. K. 2003. Case Study Research: Design and Methods. Thousand Oaks, CA: Sage Publications (3rd edition).
Zollo, M. & Winter, S. G. 2002. Deliberate Learning and the Evolution of Dynamic Capabilities.