HAL Id: hal-01008968
https://hal.archives-ouvertes.fr/hal-01008968
Submitted on 9 Oct 2020HAL is a multi-disciplinary open access archive for the deposit and dissemination of sci-entific research documents, whether they are pub-lished or not. The documents may come from teaching and research institutions in France or abroad, or from public or private research centers.
L’archive ouverte pluridisciplinaire HAL, est destinée au dépôt et à la diffusion de documents scientifiques de niveau recherche, publiés ou non, émanant des établissements d’enseignement et de recherche français ou étrangers, des laboratoires publics ou privés.
Distributed under a Creative Commons Attribution| 4.0 International License
Probabilistic sensitivity analysis of a concrete wharf to
pitting corrosion and concrete quality
N. Zeidan, S. Yotte, S. M. Elachachi, Franck Schoefs, A. Daulat, R. Eldalati
To cite this version:
N. Zeidan, S. Yotte, S. M. Elachachi, Franck Schoefs, A. Daulat, et al.. Probabilistic sensitivity analysis of a concrete wharf to pitting corrosion and concrete quality. 1st International Conference on Applications Heritage and Constructions in Coastal and Marine Environment, 2008, Lisboa, Portugal. �hal-01008968�
Probabilistic sensitivity analysis of a concrete wharf to pitting corrosion
and concrete quality
Nicolas ZEIDAN1,2, Sylvie YOTTE1, Sidi M. ELACHACHI1, Franck SCHOEFS3, Alain DAULAT4, Rouba ELDALATI2
1
Bordeaux University, GHyMaC, Domaine Universitaire 33405 Talence cedex, France
2
Université Libanaise, Faculté de Génie, Branche 1, Tripoli, Lebanon
3
Nantes Atlantic University, GeM, UMR CNRS 6183,, Faculté des sciences et des techniques, 44322??? Nantes cedex France
4
Conseil Général de Gironde, esplanade Charles de Gaulle, 33000 Bordeaux, France
Abstract
Blaye wharf is an old reinforced concrete structure (built in 1933). It is located on Gironde estuary and is exposed to aggressive marine environment which induces safety reduction. A reliability analysis was carried out in order to assess the evolution of the reliability index β with time. After doing a three-dimensional finite element modelling of the wharf through CAST3M software, a linear analysis was undertaken. Dead, live and traffic loads (uniform load and concentrated wheel load) are defined according to Eurocode 2. The SLS (service limit state) reliability index β is computed for “unfavourable” beams and it is assumed in first approximation that all the variables are normally distributed. It is to be noted that it’s an element by element reliability analysis rather than a system analysis. Concerning the position of traffic loads, various cases were considered: vehicle centred on longitudinal beam, two wheels centred on the longitudinal beam, vehicle centred on the support, two wheels centred on the support without forgetting braking and/or acceleration forces. It has been shown that the reliability index is not only dependent on the material and load parameters but also on the mechanical model.
Keywords: wharf, reliability, assessment, reinforced concrete, corrosion, chloride ingress
1. Blaye wharf
Blaye wharf was built in 1933 on Gironde estuary. From Blaye boats carry cars and trucks to the opposite side of the estuary and back. On this wharf boats load and unload vehicles. It is a frame made with reinforced concrete. It has encountered many storms, many shocks with floating objects. Some parts of the frame are broken, some reinforcements are visible and corroded. General Council of Gironde, the owner, carried out a deterministic study of its stability to know if it could still be used. This study did not answer to the main question which is how long will it be safe for vehicles to move on it.
This study focuses on the behaviour of two main beams of the deck driving part of the wharf.
2. Determination of the most solicited beam
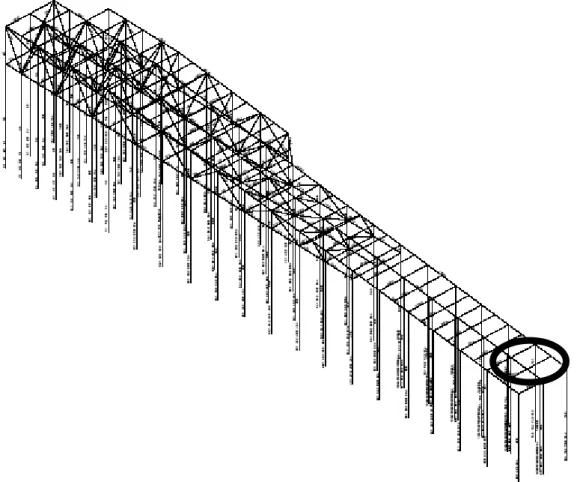
The loads that are considered here are the uniform distributed loads (UDL) due to the traffic and to the weight and the concentrated loads due to the wheels. Thus it is found that the most solicited beam is a longitudinal median beam. Figure 2 shows the beam location on the structure.
Fig2. Beams studied in the paper.
2.1 Internal resistance
The resisting torque of the beam depends on the reinforcement section As. The value taken by the various parameters are fsy=240 MPa (E24 steel) and fc=24.7 MPa (measured mean concrete résistance). The reinforcement position is given on figure 3.
Fig. 3 Reinforcement position for bearing section and for median section.
It gives a resisting torque of 217 kN.m for the median section and 408 kN.m for the bearing section. The assumption is that bending is the main internal solicitation. Thus the following computations are realised on the bending torque. It is supposed to follow a Gaussian law with a variation coefficient of 10%. Note that a detailed reliability analysis is not carried out taking into
account for example the uncertainty of reinforced bars location. Moreover, Gaussian distribution is used as a usual distribution of resistance in spite of its shortcoming: non physical values (negative values) have a non-zero probability of occurrence. However with a 10% variation coefficient, this probability is very low in comparison to the expected failure probability and is considered acceptable for the purpose of this paper.
2.2 Loading
The various loads are also supposed to follow a Gaussian law with a variation coefficient of 5% for the weight W, 20 % for traffic UDL and 50% for the traffic concentrated load TS. In this last case, this assumption is made for simplicity only. It could be in further work replaced by a log-normal distribution that avoids ‘negative values’. The coefficient of variation of 50% is great but is a current value for storm loading (ECOR, 1991). Note that In the case of Gaussian assumption and linear safety margin (MM=Mr-Ms) , β is given by the expression (1) provided by (Cornell, 1969):
2 2 s r M M s r M M
σ
σ
β
+ − = (1)With
M
s=
M
W+
M
UDL+
M
TS ; index ‘s’ and ‘r’ denote respectively the solicitation and the resistance.The main assumption of this work is that the reliability of the wharf at the design step is known. That avoids a complete reliability analysis of the wharf at the design step with a lot of shortcomings. We assume then that the original design considered a lifespan of 50 years. The wharf did not fail during this period in spite of extreme loading acting on it. We then considered that the original design lead to an annual probability of failure of 10-4. Of course the magnitude of the initial probability of failure is questionable and expert judgment as well as forensic engineering could probably help us to calibrate this quantity. We don’t address this question here but focus on the method that can be considered. The objective is to determine the solicitation value so that the probability of failure is 10-4, which means that
β
=Φ−1( )
10−4 =3.8, where φ is the standard normal distribution. The initial loads used for the calculation are unknown and the modelling of wind loading in coastal area on framed or/and low structures is still a challenge. Therefore there is a difficulty in computing the evolution of the resistance along years. We suppose that the ratio of a torque to its solicitation is a constant equal to that obtained through the Eurocode and that the coefficient of variation is also the same as in the Eurocode. Thus the calculation will be carried out with the same coefficient of proportionality of the moment to the load as in the Eurocode. The coefficients of proportionality are given in table 1. This assumption is of course very simple and modelling uncertainties should be introduced in further studies.Table 1 coefficient of proportionality of torques to solicitations
Median section Bearing section
W
M
W W=
α
2.217 1.497UDL
M
UDL UDL=
α
4.542 3.163TS
M
TS TS=
α
0.88 1.520(
)
2(
) (
2)
2 2 TS TS UDL UDL M W M TS UDL W r W r TS UDL W Mσ
α
σ
α
σ
α
σ
α
α
α
β
+ + + − − − = (2) With 1 . 0 × = ⇒ × = R M M R MR M cv Rσ
R Mσ
( )
W M cv MW M M W W MW Wσ
Wα
σ
= × ⇒ = ×0.05=0.05(
UDL)
M cvMUDL M M UDL UDL
MUDL UDL
σ
UDLα
σ
= × ⇒ = ×0.2=0.2(
TS)
M cv MTS M M TS TS MTS TSσ
TSα
σ
= × ⇒ = ×0.5=0.5With these values of the standard deviations, equation (2) becomes:
(
)
(
)
2(
( )
)
2(
(
)
)
2(
(
)
)
25
.
0
2
.
0
05
.
0
1
.
0
88
.
0
542
.
4
2168
.
2
TS
UDL
W
M
TS
UDL
W
M
TS UDL W R Rα
α
α
β
+
+
+
+
+
−
=
(3) andβ
=Φ−1(
1−10−4)
=3.8In this equation (3) due to the higher coefficient of variation of TS a variation of
W
orUDL
gives little variation of β. ThusW
orUDL
will be fixed to the value given by the Eurocode, and TS will be determined by equation (3).The resolution gives
W
= 25 kN/m3,UDL
=6.3 kN/m3, TS for central section is TS = 33.7 kN and for the bearingsection TS = 67.2 kN.3. Corrosion
The wharf is in Gironde Estuary, where salt is present in the water. The first step of corrosion phenomena is chloride ingress in the concrete. When the chloride concentration on reinforcement reaches a critical value then corrosion can occur. Corrosion speed depends on the oxygen available and on moisture. It is measured by corrosion currents. Corrosion causes a diminution of the reinforcement section.
The wharf is already damaged. The challenge is to predict the evolution from its present state to its state in ten years. A corrosion model will then be used to simulate the corrosion evolution. It will give an estimation of the loss of section, and thus of the new section Ar(t). Therefore a new resisting torque can be computed for each year.
The following approach follows that of Duprat (Duprat 2004 & 2007) in a simplified way. 3.1 Chloride ingress
We have no information on the cement constituents and building, thus it is difficult to estimate a value for the coefficient of diffusion. As this quantity depends on concrete composition and building, there is a large scatter in the values given in the literature. Thus the simulation of chloride diffusion and the determination of the time where corrosion begins are difficult. We have to choose between performing simulations with bad information and assuming that corrosion begins the first year of the wharf life. We assumed that corrosion begins the first year after the end of construction which is a very conservative assumption. Note that detailed characterization of concrete could update this assumption.
3.2 Corrosion current
Table 2 Bibliographic about corrosion current and corrosion depth Author Corrosion current per
year
Penetration depth (Gonzalez 1995) 1 to 3µA/cm² 11 to 33 µm/year (Gonzalez 1995) for
concrete exposed 6 years to see water
10 to 20 µA/cm² 80 µm/year
(Enright 1998) Unknown 13 to 127 µm/year
Corrosion rate can be estimated through corrosion currents. Several authors make a relation between the corrosion current and the penetration depth of corrosion in the reinforcement. The various values are given on table 2.
Vu (Vu 2000) gives relation (4) as law for the current, depending on the quality of concrete:
( )
c C E Icorr 64 . 1 1 78 . 3 1 − − = (4)where Icorr(1) is the current of corrosion for 1 year, E/C is the water to cement ratio and c is the cover of the reinforcement. Table 3 shows the E/C values that are taken.
Table 3: characteristics for three qualities of concrete
Quality Good Average Bad
E/C 0.5 0.57 0.65
3.3 Section loss
The reinforcement diameter loss is then given by the relation:
( ) ( )
( )
( )
( )
− + = + = −∫
− − 7 . 0 1 1 1 10 6 . 11 1 1 10 6 . 11 7 . 0 4 1 3 . 0 4 T I dt t I T P corr T corr (5)In the case of corrosion through pitting corrosion due to chlorides, a coefficient R can multiply P(T). With no information upon R we will take three values of R (3, 6, 9) corresponding to weak, moderate and strong aggressiveness of the corrosion notching.
( ) ( )
T
P
T
R
P
R=
×
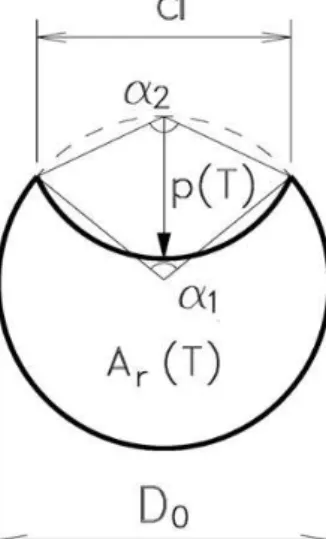
(6)Figure 4 clarifies the procedure for the loss of section calculation. Let Ar be the residual section. A hemispherical corrosion attack is assumed. Enright (Enright 1998) gives the following equations (7) to (12) to determine Ar(T) in our case.
Fig 4 Section loss ( Enright 1998)
( )
− − − = 0 4 2 1 2 1 2 0 A A A A D T Arπ
if( )
( )
( )
0 0 0 0 2 2 D T P D T P D D T P > ≤ ≤ ≤ (7)( )
( )
2 01
2
−
=
D
T
P
T
P
a
(8)( )
= T P a 2 arcsin 2 2θ
(10)( )
( )
− = 0 2 2 2 2 2 1 D T P a T P Aθ
(12)
=
0 12
arcsin
D
a
θ
(9)( )
− − = 0 2 0 2 0 1 1 2 2 2 1 D T P D a D Aθ
(11) 0 0 00
.
1
)
(
y r y yf
A
A
A
t
f
−
−
=
α
(13)4. Results
4.1 Effect of pitting corrosion
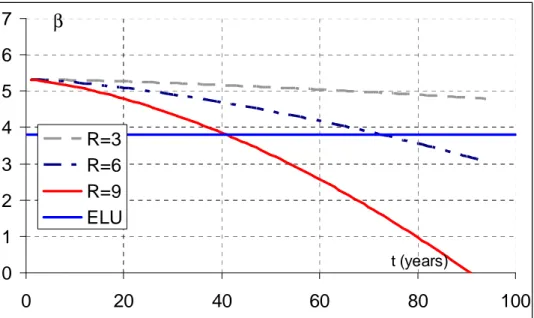
As in the Thirties dimensioning was carried out by calling upon the concept of working stress, we considered (as a design assumption) that at the start situation we can associate a reliability index
β of 5.3 (meaning a probability of failure of 6.10-8). One can see (figure 5) that for a moderate concrete quality, the speed of degradation is higher in the strong case of pitting corrosion (R=9) than in the weak case (R=3), it accounts for the ratio from 1 to 8. The same tendency is observed for the other concrete qualities. The lifespan of the studied structure element evolves from 40 years (case with R=9) to more than 120 years (R=3). It seems that the real speed of pitting corrosion lies between R=6 and R=3 for the defined ultimate limit state.
0
1
2
3
4
5
6
7
0
20
40
60
80
100
t (years)β
R=3
R=6
R=9
ELU
Figure 5: Reliability index evolution of a moderate concrete quality for various values of pitting corrodion
4.2 Effect of concrete quality:
For a poor quality of concrete (E/C=0.65), the degradation comes from two causes: on the one hand the strong porosity of the concrete which results in a multicracking which generates necessarily a greater or lower concrete damage and on the other hand from the corrosion of the reinforcements. Figure 6 shows for a same rate of pitting corrosion (R=6) the evolution of the lifespan of the structure's element for which the lifespan is increased by 30 years regarding the ULS.
0 1 2 3 4 5 6 7 0 20 40 60 80 100 t (years) β E/C=0.65 E/C=0.57
Figure 6: Reliability index evolution of a moderate concrete quality for various values of concrete quality.
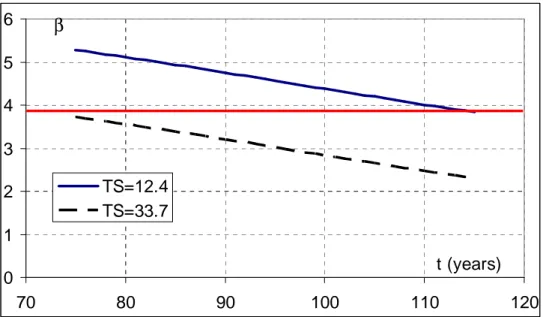
4.3 Consequences of traffic load
In order to see whether it would be desirable to limit the traffic load, we have to suppose that the ULS has been reached today (t=74 years) for a TS=33.7 kN and we recomputed
the reliability index by dividing the load by three (TS=12.4 kN) and by considering that we are in the presence of a moderate quality of concrete and a moderate pitting corrosion. One can note (figure 7) that the lifespan is increased by about 30 years. Since one does not know a priori the actual present value of the reliability index this obtained lifespan is to be regarded as a higher limit.
0 1 2 3 4 5 6 70 80 90 100 110 120 t (years)
β
TS=12.4 TS=33.7Figure 7: Influence of traffic load on reliability index
5. Conclusion
This work is a redesigning work on an old wharf, still used by cars ant trucks. The end user question was: is it safe and for how long? We brought some brief replies and the main study problem remains the lack of data about concrete quality, pitting corrosion evolution and initial design loads.
We assume that the design was done using an initial reliability index and we analyzed the evolution of this index according to time and we estimate the lifespan of some elements of the wharf while basing ourselves on targeting a reliability of 3.8 (that prescribed in the Eurocode). Regarding traffic load, the reduction of its intensity to 1/3 of its initial value allows to lengthen the lifespan sizeably.
6. References
Cornell, C.A., A probability-based structural code. Journal of the American Concrete Institute, 1969, 66, 974–985.
Duprat F., Reliability of RC beams under chloride-ingress. Construction and Building Materials, 2007, 21,(8), 1605-1616.
Duprat F., Analyse Probabiliste de la fiabilité des poutres en béton armé corrodé. Revue Française de Génie Civil, 2004, 8(2-3) ,261-288.
EnrightM.P., Frangopol D.M., Probabilistic analysis of resistance degradation of reinforced concrete bridge beams under corrosion. Engineering Structures, 1998, 20(11), 960-971.
ECOR (Engineering Committee on Oceanic Resources). Reliability Analysis for Offshore Structures. Document. Final Version, 81 pages, may 1991.
Gonzalez J.A., Andrade C., Alonso C., Feliu S., Comparison of rates of general corrosion and maximum pitting penetration on concrete embedded steel reinforcement. Cement and Concrete Research, 1995, 25(2), 257-264.
7. Aknowledgements
This work has been founded by Europe under FEDER program MEDACHS Interreg Atlantic Space project number 197.
View publication stats View publication stats