www.the-cryosphere.net/8/1871/2014/ doi:10.5194/tc-8-1871-2014
© Author(s) 2014. CC Attribution 3.0 License.
Sensitivity of Greenland Ice Sheet surface mass balance to
perturbations in sea surface temperature and sea ice cover:
a study with the regional climate model MAR
B. Noël1,2, X. Fettweis1, W. J. van de Berg2, M. R. van den Broeke2, and M. Erpicum1 1Department of Geography, University of Liège, Belgium
2Institute for Marine and Atmospheric research Utrecht, University of Utrecht, the Netherlands
Correspondence to: B. Noël (b.p.y.noel@uu.nl)
Received: 31 January 2014 – Published in The Cryosphere Discuss.: 4 March 2014 Revised: 5 September 2014 – Accepted: 12 September 2014 – Published: 20 October 2014
Abstract. During recent summers (2007–2012), several sur-face melt records were broken over the Greenland Ice Sheet (GrIS). The extreme summer melt resulted in part from a persistent negative phase of the North Atlantic Oscillation (NAO), favoring warmer atmospheric conditions than nor-mal over the GrIS. Simultaneously, large anonor-malies in sea ice cover (SIC) and sea surface temperature (SST) were ob-served in the North Atlantic, suggesting a possible connec-tion. To assess the direct impact of 2007–2012 SIC and SST anomalies on GrIS surface mass balance (SMB), a set of sen-sitivity experiments was carried out with the regional climate model MAR forced by ERA-Interim. These simulations sug-gest that perturbations in SST and SIC in the seas surround-ing Greenland do not considerably impact GrIS SMB, as a result of the katabatic wind blocking effect. These offshore-directed winds prevent oceanic near-surface air, influenced by SIC and SST anomalies, from penetrating far inland. Therefore, the ice sheet SMB response is restricted to coastal regions, where katabatic winds cease. A topic for further in-vestigation is how anomalies in SIC and SST might have indirectly affected the surface melt by changing the general circulation in the North Atlantic region, hence favoring more frequent warm air advection towards the GrIS.
1 Introduction
The Greenland Ice Sheet (GrIS) is the world’s second largest ice sheet with an area of ≈ 1.7 million km2, covering more than 80 % of Greenland. The GrIS contains almost 10 % of
the earth’s total freshwater, accounting for a ≈ 7 m global mean sea level rise if completely melted. The ice sheet thick-ness is about 3 km at its center and progressively decreases towards the ice-free tundra. Previous work has shown that the GrIS is sensitive to climate warming in response to a combi-nation of natural and anthropogenic forcing. GrIS mass loss has accelerated over the last decades (Rignot et al., 2011; En-derlin and Howat, 2013; Fettweis et al., 2013; Wouters et al., 2013) as a result of enhanced surface melting and iceberg calving (Van den Broeke et al., 2009); these processes con-tribute ≈ 25 % to recent global sea level rise (Shepherd et al., 2012), affecting coastal regions worldwide. Moreover, by in-creasing the discharge of fresh meltwater into the Atlantic Ocean and lowering its salinity, GrIS mass loss has the poten-tial to weaken the Atlantic thermohaline circulation (Hanna et al., 2009).
Since 2007, several melt records have been broken over the GrIS (Hanna et al., 2013a). In particular, July 2012 was char-acterized by the largest melt extent ever recorded during the satellite era, affecting 97 % of the ice sheet surface (Tedesco et al., 2013). To explain these events, several hypotheses have been put forward. Anomalous atmospheric circulation, at-tributed to the persistent 2007–2012 negative phase of the North Atlantic Oscillation (NAO) in summer, has favored warmer and drier conditions over the ice sheet, enhancing surface melting (Fettweis et al., 2013). The NAO phase is determined on the basis of the North Atlantic Oscillation In-dex (NAOI), computed as the normalized pressure difference between Gibraltar and Reykjavik (Jones et al., 1997; Osborn, 2004; Fettweis, 2007). A negative NAO is characterized by
1872 B. Noël et al.: Sensitivity of GrIS SMB to perturbations in SST and SIC using MAR less intense westerly flow in mid-latitudes, resulting from
weakening of both the Icelandic Low and the Azores High. This promotes southwesterly advection of subtropical air to-wards the GrIS (Fettweis, 2007). According to Fettweis et al. (2013), about 70 % of the recent surface melt increase can be attributed to this anomalous circulation. The remaining 30 % might be explained by long-term anthropogenic warming in the Arctic and the associated changes in oceanic conditions (Fettweis et al., 2013).
Regional oceanic forcing, i.e., changes in sea ice cover (SIC) and sea surface temperature (SST), could also have contributed to GrIS surface mass balance (SMB) decline. In this study, a regional climate model (RCM) is used to assess GrIS SMB sensitivity to perturbations in SIC and SST in the seas surrounding Greenland. A distinction is made between “direct” and “indirect” effects of oceanic forcing on GrIS SMB. The direct effect is defined as the local (i.e., around Greenland) impact of SIC and/or SST anomalies on near-surface air temperature and moisture, without considering feedbacks on the general circulation. Conversely, the indi-rect effect takes into account the SIC- and/or SST-induced general circulation variations (Overland et al., 2012) and their potential influence on the atmospheric conditions above Greenland. Owing to the limitations of using a RCM with constant lateral forcing, we only study the direct effect.
Previous studies of the direct effect of oceanic forcing on GrIS SMB using the regional climate model MAR (Modèle Atmosphérique Régional), forced by ERA-Interim reanaly-ses, were based on imposing SST variations (Hanna et al., 2009) or combined SIC–SST perturbations (Hanna et al., 2013a). The results suggest that independent SST variations (±2◦C) can not fully explain the GrIS melt record observed
in the summer of 2007 (Hanna et al., 2009). In a second ex-periment, Hanna et al. (2013a) used the climatological mean SST and SIC during 1979–1994 instead of 2012 to prescribe oceanic conditions in MAR. They found that this combina-tion of SIC and SST anomalies did not significantly influence GrIS SMB in the summer of 2012.
Hanna et al. (2013b) stated that perturbations in oceanic conditions might be partly responsible for the recent shift to a persistent negative NAO. This shift might contribute to large-scale circulation changes, potentially affecting GrIS SMB (Overland and Wang, 2010; Jaiser et al., 2012). To evalu-ate both the direct and indirect impact of oceanic forcing on GrIS SMB, Day et al. (2013) conducted two sensitivity experiments, consisting of an individual SIC retreat and a combination of SIC reduction and rise in SST, over a 30-year period. They used the regional climate model HadRM3, forced every 6 h by the global circulation model HadAM3. Monthly mean SIC and SST, averaged over 2061–2090 and based on the A1B scenario, were used to force HadRM3 and HadAM3. The surface climate variables, supplied by HadRM3 for both experiments, were then used to compute runoff over the GrIS with the ITM (Insolation-Temperature-Melt) SMB model. The comparison with a reference run,
characterized by present-day SST and monthly mean SIC (1961–1990), allowed Day et al. (2013) to isolate the effect of SIC and combined SIC–SST anomalies on GrIS SMB. The results indicate that an individual SIC reduction leads to a winter precipitation increase, spatially restricted to the center and the eastern parts of the GrIS. This enhanced accumula-tion results from stronger evaporaaccumula-tion over the ice-free ocean. During summer, a SIC decrease weakens North Atlantic cy-clonic activity, lowering precipitation over the southern GrIS (Hoskins and Hodges, 2002; Day et al., 2013). The higher winter precipitation increases surface albedo, reducing sum-mer runoff and hence resulting in a positive SMB anomaly. In contrast, a combined SIC–SST forcing leads to a warmer and wetter atmosphere, increasing both winter precipitation and summer surface melting over the GrIS. The mass gain is exceeded by enhanced runoff, resulting in a net decrease in SMB (Day et al., 2013).
In spite of these previous studies, large uncertainties re-main in the direct oceanic forcing’s impact on GrIS SMB. In their experiments, Hanna et al. (2009, 2013a) used a rela-tively small integration domain (≈ 6.3 × 10⁶km2), including only a narrow band of oceanic pixels around the GrIS. Conse-quently, oceanic pixels located close to the edges of the RCM domain are strongly constrained by the lateral boundary forc-ing, potentially suppressing the oceanic impact on the at-mospheric conditions. The integration domain area selected for this study (Fig. 1) is twice as large (≈ 13.2 × 10⁶km2) and extends 300 km further from the ice sheet margins in the northward and southward directions, 550 km eastwards and 950 km towards the west. In addition, both previous studies using MAR only analyzed a single year, prescrib-ing oceanic anomalies from May to September. Other issues are that HadRM3 significantly underestimates total precipi-tation and ITM SMB overestimates runoff, likely impacting the results of the sensitivity experiments. Finally, monthly mean SIC and SST were prescribed in HadRM3, neglecting interdiurnal dynamics of oceanic forcing and their influence on the atmospheric conditions. As a result, these previously published sensitivity experiments might not use sufficiently large oceanic perturbations to generate a significant impact on GrIS SMB.
In this paper, we use MAR forced by ERA-Interim to eval-uate whether single or combined SIC and SST anomalies could significantly impact GrIS SMB by prescribing modi-fied oceanic conditions within a larger integration domain at 40 km spatial resolution. Regional models of GrIS SMB have improved considerably in recent years, and MAR presents relatively small contemporary biases since it has been espe-cially developed to model GrIS SMB (Fettweis, 2007). Our sensitivity experiments cover the entire year, and 6-hourly anomalies in SIC and SST are prescribed for 2007–2012, in-stead of fixed monthly mean values. These simulations do not attempt to improve on reanalysis, but rather to analyze the sensitivity of GrIS SMB to external perturbations, using a
(a) Reference SIC (b) SIC +6 (c) SIC -6
(d) Reference SST (e) SST -4 (f) SST +4
1
Figure 1. Panel representing the entire integration domain used for every simulations. Top: reference simulation (a) SIC (% normalized to 1) and anomalies in SIC from the sensitivity experiment (b) SIC + 6, (c) SIC − 6 on the 1 June 2012. Bottom: reference simulation (d) SST (◦C) and anomalies in SST from the sensitivity experiment (e) SST − 4, (f) SST + 4 on the 1 June 2012. The black box area depicted in (a) and (d) is used to calculate SST in Table 1.
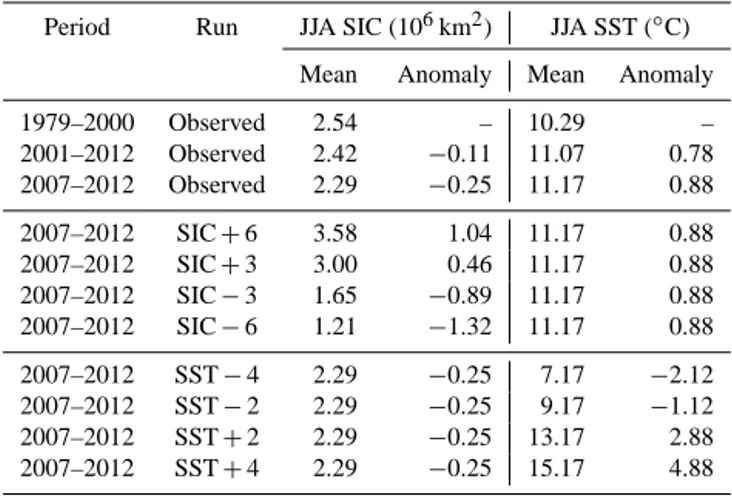
Table 1. Observed and applied JJA SIC and SST within MAR do-main. The SST is calculated for the assumed sea-ice-free ocean only (SIC ≤ 0.2) using the region within the black box displayed in Fig. 1.
Period Run JJA SIC (106km2) JJA SST (◦C) Mean Anomaly Mean Anomaly
1979–2000 Observed 2.54 – 10.29 – 2001–2012 Observed 2.42 −0.11 11.07 0.78 2007–2012 Observed 2.29 −0.25 11.17 0.88 2007–2012 SIC + 6 3.58 1.04 11.17 0.88 2007–2012 SIC + 3 3.00 0.46 11.17 0.88 2007–2012 SIC − 3 1.65 −0.89 11.17 0.88 2007–2012 SIC − 6 1.21 −1.32 11.17 0.88 2007–2012 SST − 4 2.29 −0.25 7.17 −2.12 2007–2012 SST − 2 2.29 −0.25 9.17 −1.12 2007–2012 SST + 2 2.29 −0.25 13.17 2.88 2007–2012 SST + 4 2.29 −0.25 15.17 4.88
well-evaluated RCM which incorporates an interactive snow routine.
In Sect. 2, MAR is briefly introduced as well as the ref-erence and sensitivity simulations. Section 3 describes the impacts of SIC and/or SST anomalies on GrIS SMB. The impact of oceanic forcing on the katabatic wind intensity is discussed in Sect. 4, followed by conclusions in Sect. 5.
2 Model and setup
2.1 The regional climate model MAR
MAR consists of a 3-D atmospheric model that predicts the evolution of the coupled land–atmosphere system resulting from radiative and atmospheric forcing within the integra-tion domain boundaries (Gallée and Schayes, 1994). MAR is coupled to the 1-D module SISVAT (Soil Ice Snow Veg-etation Atmosphere Transfer) (Gallée and Schayes, 1994; Ridder and Gallée, 1998), which simulates mass and energy fluxes between the surface–vegetation–atmosphere system. SISVAT includes a 1-D multi-layered snow model, based on the CEN (Centre d’Etudes de la Neige) snow model CRO-CUS (Brun et al., 1992), which computes the energy fluxes between the sea ice, the ice sheet surface, the snow-covered tundra and the atmosphere (Gallée et al., 2001; Fettweis, 2007). CROCUS consists of a thermodynamic and water bal-ance module including sub-modules for meltwater refreez-ing, snow metamorphism, snow/ice discretization and sur-face albedo (Brun et al., 1992; Gallée et al., 2001). Drifting snow is not considered as it is assumed to have a minor effect on SMB relative to other components (Lenaerts et al., 2012). MAR’s ability to model GrIS SMB was demonstrated by comparing MAR outputs (Fettweis, 2007) with in situ measurements (Lefebre et al., 2003, 2005; Gallée et al., 2005; Rae et al., 2012; Vernon et al., 2013) and satellite observations (Fettweis et al., 2005, 2011; Tedesco and Fet-tweis, 2012). By simulating GrIS SMB using different spa-tial resolutions, ranging from 15 to 50 km over 1990–2010,
1874 B. Noël et al.: Sensitivity of GrIS SMB to perturbations in SST and SIC using MAR Franco et al. (2012) showed that spatial resolution has no
significant impact on the modeled-integrated GrIS SMB in MAR.
2.2 Setup of MAR simulations
ERA-Interim reanalysis data (Stark et al., 2007; Dee et al., 2011) are used to force MAR at its lateral boundaries every 6 h over 2007–2012. The reanalysis is available at a 0.75◦×
0.75◦spatial resolution.
Since MAR is not coupled to an ocean model, the ocean surface conditions, i.e., SIC and SST, are also prescribed every 6 h from ERA-Interim. The ice sheet topography, based on Bamber et al. (2013), is kept fixed. The inte-gration domain, depicted in Fig. 1, extends up to 900 km around the GrIS margins (a) to include the neighboring sea ice and oceans and (b) to avoid direct influence of lateral forcing on simulated near-surface conditions above the seas surrounding Greenland. This research is based on MAR version 2 (MARv2), with model settings as used in Fettweis et al. (2013).
2.3 Reference run and sensitivity experiments
The reference simulation covers the period 2002–2012. The first 5 years were used to spin up the snow model since a proper snow cover initialization, driving the surface albedo and the bare ice exposure, is essential to accurately model GrIS SMB (Lefebre et al., 2005). The sensitivity experi-ments are branched from the reference run in 2007. There-fore, only the 2007–2012 period is considered in this study. ERA-Interim SIC and SST 6-hourly fields are prescribed in MAR for the reference simulation (Fig. 1a, d). The atmo-spheric boundary conditions at each MAR vertical level are likewise imposed by ERA-Interim and remain identical in each sensitivity experiment. Therefore, the conducted sensi-tivity experiments only account for the direct and local (i.e., around Greenland) oceanic impact on GrIS SMB, since no oceanic forcing feedback on the general circulation is con-sidered here. This study should therefore be regarded as a limited-area model study of the sensitivity of GrIS SMB to oceanic conditions.
2.3.1 SIC anomaly forcing
In the SIC sensitivity experiments, the SIC of each oceanic grid cell is replaced by the maximum (resp. minimum) SIC value from a distance range of three to six grid cells sur-rounding the current one. This adjustment is applied on the 6-hourly SIC field from ERA-Interim. As a result, SIC is progressively increased (resp. decreased) in three or six pe-ripheral grid cells, i.e., by 120 or 240 km of horizontal dis-tance, extending outward (resp. inward) from the actual sea ice boundary. This method avoids abrupt and hence unrealis-tic changes in SIC between adjacent ice-free and ice-covered oceanic grid cells (Fig. 1b, c) and does not perturb the
sea-sonal cycle. These experiments are referred to as SIC ±3 and SIC ±6 in the following sections.
To prevent sea ice from obtaining a surface temperature (ST) higher than the melting point (0◦C) and open-water characterized by an ST lower than the assumed saltwater freezing point (−3◦C), an ST correction is applied to each pixel subjected to SIC change, computed as
ST0(i,j )=SIC(i,j )·min(STmelting,ST(i,j )) + (1 − SIC(i,j )) ·max(STfreezing,ST(i,j )),
where ST0(i,j )is the corrected surface temperature in◦C for the pixel (i,j); SIC(i,j )is the new computed SIC of the pixel
(i,j); ST(i,j )is the pixel (i,j) uncorrected surface temperature
in◦C; STmeltingis the melting point (0◦C) while STfreezingis the saltwater freezing point (−3◦C).
2.3.2 SST anomaly forcing
In the SST experiments, 6-hourly SST is increased (resp. de-creased) by 2 or 4◦C over the ice-free ocean (Fig. 1e, f).
These experiments are called SST ± 2 and SST ± 4. For an SST reduction, ice-free oceanic grid cells are converted into ice-covered grid cells when ST drops below the assumed salt-water freezing point (−3◦C). For sea-ice-covered grid cells, the ST is limited to the melting point (0◦C) to prevent any SIC change.
2.3.3 Combined SIC–SST anomaly forcing
For the combined sensitivity experiments, an increase (resp. decrease) in SIC is combined with a decrease (resp. increase) in SST to consider the sea ice insulation feedback. The 6-hourly SIC and SST anomalies are computed according to Subsects. 2.3.1 and 2.3.2, respectively. These experiments are named SIC ± 3 / SST ∓ 2 and SIC ± 6 / SST ∓ 4 in the following sections.
2.3.4 Magnitude of perturbations in oceanic conditions To assess the magnitude of the perturbations in the oceanic conditions applied in our sensitivity experiments, Table 1 lists ERA-Interim control and perturbed June-July-August (JJA) SST and SIC values. The annual mean integrated SIC is computed for our whole model integration domain, whereas the annual mean SST is calculated for the region confined by the black box in Fig. 1. This area was selected because it remains free of sea ice in all experiments, hence excluding numerical artifacts introduced by differences in open ocean area. The 1979–2000 period is used as a reference, because summer SIC has declined and SST has risen since 2001.
The sensitivity experiments represent a 2.5 to 5 times higher (resp. lower) anomaly in SIC (+3, +6; resp. −3, −6) and/or SST (−2, −4; resp. +2, +4) compared to the JJA mean anomaly of the reference oceanic conditions for 2007– 2012 with respect to the 1979–2000 mean. By applying
Table 2. Top: annual mean cumulated GrIS SMB (Gt yr−1) and its components (Gt yr−1) for the reference run (2007–2012). Bottom: difference in SMB (Gt yr−1and %) and its components (Gt yr−1) between each sensitivity experiment and the reference run over 2007– 2012. The last column lists JJA mean cumulated snowfall (Gt/JJA) over the GrIS for the reference run (top) and the anomalies (Gt/JJA) induced by each sensitivity experiment (bottom). Significant anomalies are displayed in bold for each experiment.
Mean (Gt yr−1) SMB SMB % Snowfall Rainfall Runoff Melting JJA SF
Reference 237 – 555 28 354 585 117
Anomaly (Gt yr−1) SMB SMB % Snowfall Rainfall Runoff Melting JJA SF
SIC + 3 −8 −3.4 −7 0 1 1 1 SIC + 6 −15 −6.3 −16 −1 −1 −1 2 SIC − 3 10 +4.2 9 0 −2 −2 1 SIC − 6 16 +6.8 13 0 −3 −4 2 SST − 2 8 +3.4 −7 −2 −17 −13 5 SST − 4 15 +6.3 −12 −4 −29 −22 8 SST + 2 −5 −2.1 17 4 25 23 −4 SST + 4 −13 −5.5 37 9 59 54 −9 SIC + 3 / SST − 2 −1 −0.4 −14 −2 −14 −10 4 SIC + 6 / SST − 4 2 +0.8 −19 −4 −22 −15 7 SIC − 3 / SST + 2 1 +0.4 23 4 26 24 −4 SIC − 6 / SST + 4 −7 −3 48 10 64 58 −10
larger perturbations relative to previous work, we aim to ver-ify and/or newly assess the sensitivity of modeled GrIS SMB to locally modified oceanic conditions, and determine which processes transfer/block the signal to/from the GrIS surface.
3 Results
Hereafter, only anomalies in precipitation and runoff are dis-cussed, since these components are the main drivers of GrIS SMB variability (Box et al., 2004). The anomalies in the an-nual mean SMB components are listed in Table 2, with sig-nificant values printed in bold. The significance was evalu-ated using a one-sided Student’s t test with a 95 % degree of confidence, based on the differences in GrIS-integrated an-nual SMB components between the sensitivity experiments and the reference simulation over 2007–2012.
3.1 SIC sensitivity experiments
A local increase in SIC surrounding the GrIS results in re-duced evaporation over the North Atlantic Ocean. This leads to a significant negative snowfall anomaly, mainly in the southeastern GrIS where precipitation peaks (Fig. 2a, b). Snowfall anomalies at other locations are smaller and hence not visible in Fig. 2. No significant changes in rainfall, runoff and melting are simulated for a rise in SIC (Table 2). For the SIC +6 experiment, the wintertime near-surface air tempera-ture decreases by about 10◦C over the newly sea-ice-covered areas, resulting from a substantial sensible heat flux reduc-tion. In summer, the marginal sea ice and the surrounding SST are both close to the ice melting point (0◦C),
allow-ing no large change in near-surface air temperature above the ocean. Therefore, a sea ice increase in summer does not sig-nificantly impact GrIS runoff, since this ablation process is sensitive to positive anomalies in near-surface air tempera-ture. This emphasizes that SIC operates as a heat and mois-ture insulator over the ocean, mainly affecting wintertime sensible heat exchange and evaporation, whereas it presents a weaker influence on summer near-surface air temperature, resulting in almost unchanged runoff over the GrIS (Fig. 3b, e). As a result, the significant snowfall decrease in the south-eastern GrIS leads to a locally significant negative anomaly in SMB (Fig. 5b).
Conversely, a SIC retreat generates respectively a signifi-cant increase in snowfall over the southeast in combination with a scattered, small decrease in runoff. This ablation re-duction results from the local rise in summer snowfall (Ta-ble 2), enhancing the summer surface albedo and hence low-ering the melt energy available at the surface. Both these pro-cesses imply a small but significant positive anomaly in SMB along the southeastern GrIS margin (Fig. 5e).
3.2 SST sensitivity experiments
Higher SST induces an increase in evaporation leading to sig-nificantly enhanced snowfall (Fig. 2f) and rainfall (Fig. 4f) over the southeastern GrIS margins. In addition, positive SST anomalies partially convert summer snowfall into rain-fall over this region (Table 2), wetting the snow cover and hence reducing the summer surface albedo. This in-creases the surface melting and runoff through the posi-tive melt–albedo feedback. Similarly, a significant increase
1876 B. Noël et al.: Sensitivity of GrIS SMB to perturbations in SST and SIC using MAR
(a) Reference
(b) SIC +6 (c) SST -4 (d) SIC +6/SST -4
(e) SIC -6 (f) SST +4 (g) SIC -6/SST +4
1
(a) Reference
(b) SIC +6 (c) SST -4 (d) SIC +6/SST -4
(e) SIC -6 (f) SST +4 (g) SIC -6/SST +4
1
1
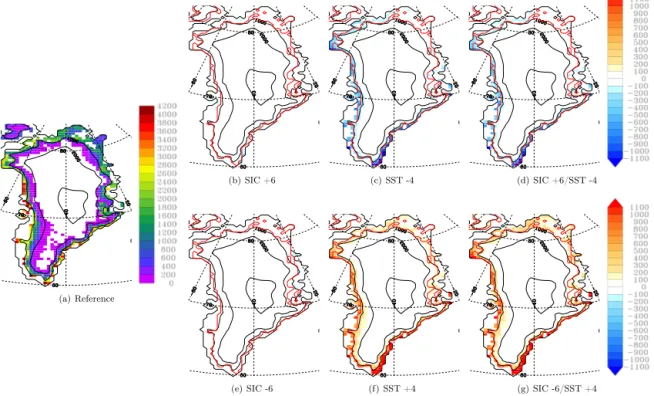
Figure 2. Annual mean cumulated snowfall (mmWE yr−1) for the reference run (a), using the MAR model over 2007–2012. Difference in annual mean cumulated snowfall (mmWE yr−1) between (b) SIC + 6, (c) SST − 4, (d) SIC + 6 / SST − 4, (e) SIC − 6, (f) SST + 4, (g) SIC − 6 / SST + 4 experiments and the reference run. The thick red line defines the GrIS area in MAR.
(a) Reference
(b) SIC +6 (c) SST -4 (d) SIC +6/SST -4
(e) SIC -6 (f) SST +4 (g) SIC -6/SST +4
1
(a) Reference
(b) SIC +6 (c) SST -4 (d) SIC +6/SST -4
(e) SIC -6 (f) SST +4 (g) SIC -6/SST +4
1
1
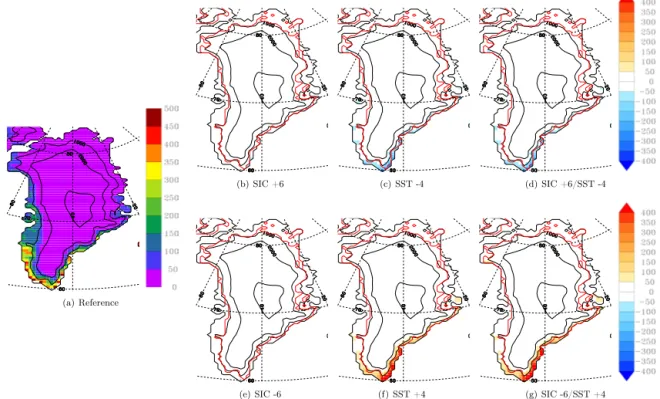
Figure 3. Annual mean cumulated runoff (mmWE yr−1) for the reference run (a) over 2007–2012. Difference in annual mean cumulated runoff (mmWE yr−1) between (b) SIC + 6, (c) SST − 4, (d) SIC + 6 / SST − 4, (e) SIC − 6, (f) SST + 4, (g) SIC − 6 / SST + 4 experiments and the reference run. The thick red line defines the GrIS area in MAR.
(a) Reference
(b) SIC +6 (c) SST -4 (d) SIC +6/SST -4
(e) SIC -6 (f) SST +4 (g) SIC -6/SST +4
1
(a) Reference
(b) SIC +6 (c) SST -4 (d) SIC +6/SST -4
(e) SIC -6 (f) SST +4 (g) SIC -6/SST +4
1
1
Figure 4. Annual mean cumulated rainfall (mmWE yr−1) for the reference run (a) over 2007–2012. Difference in annual mean cumu-lated rainfall (mmWE yr−1) between (b) SIC + 6, (c) SST − 4, (d) SIC + 6 / SST − 4, (e) SIC − 6, (f) SST + 4, (g) SIC − 6 / SST + 4 experiments and the reference run. The thick red line defines the GrIS area in MAR.
(a) Reference
(b) SIC +6 (c) SST -4 (d) SIC +6/SST -4
(e) SIC -6 (f) SST +4 (g) SIC -6/SST +4
1
(a) Reference
(b) SIC +6 (c) SST -4 (d) SIC +6/SST -4
(e) SIC -6 (f) SST +4 (g) SIC -6/SST +4
1
1
Figure 5. Annual mean cumulated SMB (mmWE yr−1) for the reference run (a), using the MAR model (2007–2012). Difference in the annual mean cumulated SMB (mmWE yr−1) between (b) SIC + 6, (c) SST − 4, (d) SIC + 6 / SST − 4, (e) SIC − 6, (f) SST + 4, (g) SIC − 6 / SST + 4 experiments and the reference run. The thick red line defines the GrIS area in MAR.
1878 B. Noël et al.: Sensitivity of GrIS SMB to perturbations in SST and SIC using MAR in runoff is simulated over the ablation zone in western
Greenland, resulting from higher near-surface temperatures induced by the warmer surrounding ocean (Fig. 3f).
Integrated over the GrIS, the local mass loss, induced by enhanced runoff in western Greenland, exceeds the mass gain in the southeast (Table 2). This leads to a small negative inte-grated SMB anomaly (Fig. 5f). Opposite results are obtained for a reduction in SST (Fig. 5c).
3.3 Combined SIC–SST sensitivity experiments A combined decrease in SIC and rise in SST enhances the positive snowfall anomaly relative to individual SIC or SST perturbations (Table 2 and Fig. 2g), as both forcings favor increased evaporation above the northern Atlantic Ocean. Anomalies in rainfall and runoff (Figs. 4 and 3d, g) are also significant and similar to these induced by an individ-ual increase in SST (Figs. 4 and 3c, f), since SIC pertur-bations have no significant influence on the summer near-surface air temperature. The decline in runoff is smaller for the SIC + 6 / SST − 4 experiment compared to the SST − 4 simulation (Table 2), because a SIC extension only generates significant negative snowfall anomalies. This results from the weakened SST influence on near-surface air temperature and hence on runoff when the sea ice expands. Likewise, the re-duction in summer snowfall is similar to the SST + 4 experi-ment, as SIC anomalies have no significant influence on sum-mer snowfall (Table 2).
For a coupled increase in SIC and drop in SST, both the lo-cal mass loss, resulting from snowfall reduction in southeast Greenland, and the coastal mass gain due to decreased runoff are similar in magnitude and hence almost in balance when integrated over the whole GrIS (Fig. 5d). Opposite results are obtained for the SIC − 6 / SST + 4 experiment as displayed in Fig. 5g. As a result, the local SMB anomalies induced by the combined forcing experiments are smaller than those simulated in the individual sensitivity simulations (Table 2). This highlights the importance of accurately modeling the snowfall / runoff ratio as significant anomalies in these com-ponents tend to compensate for each other, leaving the inte-grated SMB almost unchanged.
4 Discussion
None of the sensitivity experiments result in a large di-rect SST or/and SIC impact on SMB when integrated over the GrIS for the 2007–2012 period (Table 2). At most, SIC ± 6 perturbations account for a ±7 % anomaly in inte-grated SMB (Table 2). Compared to the 1979–2000 inter-annual variability (≈ 100 Gt yr−1or ≈ 25 %; Fettweis et al., 2013), these SMB anomalies are minor and fall within the MAR SMB uncertainty range of about ±10 % (Fettweis et al., 2013). Although significant regional SMB anoma-lies exist in our sensitivity experiments, these are mostly
re-stricted to the western coastal regions, driven by runoff per-turbations, and the southeastern region, driven by snowfall changes (Fig. 5). These results suggest that integrated GrIS SMB varies quasi-linearly with individual perturbations in SIC and SST, whereas a nonlinear relationship is found for the combined SIC–SST forcings. This nonlinear relationship results from the compensating effect between ablation and accumulation anomalies when these are integrated over the whole ice sheet.
4.1 Katabatic wind blocking effect
An important role in limiting the oceanic forcing impact on GrIS SMB is played by katabatic winds (Rennermalm et al., 2009). Katabatic winds result from negatively buoyant air over a sloping surface (Van Angelen et al., 2013), induced by a negative net surface energy budget, cooling the near-surface air (Ettema et al., 2010). This leads to the forma-tion of an anticyclonic circulaforma-tion pattern centered over the GrIS, allowing cold and hence dense near-surface air to flow down from the GrIS summit towards the surrounding ocean (Heinemann, 1999).
Figure 6 depicts the JJA mean anomalies in air tempera-ture (◦C), accounting for runoff perturbations, and the annual mean anomalies in specific humidity (g kg−1), representative of the annual total accumulation, in the SIC − 6 / SST + 4 ex-periment. As katabatic winds are directed offshore, they pre-vent near-surface oceanic moisture and temperature anoma-lies, induced by SIC or/and SST perturbations, from penetrat-ing far onto the GrIS and hence from substantially affectpenetrat-ing its SMB. Over the tundra areas and surrounding oceans, kata-batic winds cease as a result of progressive decrease of the surface slope, allowing a small oceanic influence on the SMB in low-lying coastal regions. However, humidity anomalies persist above the katabatic layer (Fig. 6), slightly enhancing moisture advection towards the ice sheet interior in south-eastern Greenland, allowing local positive SMB anomalies to spread further inland. The western Greenland coast is more sensitive to oceanic forcing than the eastern coast (Fig. 6) partly due to its gentler slopes, leading to weaker katabatic winds. Since humidity and temperature perturbations are mainly restricted to the atmospheric boundary layer (Fig. 6), heat and moisture advection in the free atmosphere is not considerably affected by changes in near-surface conditions over the ocean. In agreement with Rennermalm et al. (2009), Ettema et al. (2010) and Van Angelen et al. (2013), the im-pact of oceanic forcing on GrIS SMB is enhanced in summer, when katabatic winds weaken (Fig. 6a).
4.2 Oceanic forcing impacts on katabatic winds Since sea ice does not substantially affect near-surface air temperature in summer, anomalies in SIC have no major impact on the JJA thermal gradient between the ice sheet and the ocean (Fig. 7b, e), leading to negligible changes in
(a) JJA mean air temperature anomaly (°C)
(b) Annual mean specific humidity anomaly (g/kg)
1
Figure 6. Longitudinal section through the GrIS (64◦N), showing in the background (a) the difference between JJA mean air tem-perature (◦C) from the SIC − 6 / SST + 4 and the reference run, (b) same for annual mean specific humidity (g kg−1). The over-laid vectors represent (a) JJA mean wind speed (m s−1) for the reference run over 2007–2012, (b) same for annual mean. The wind speed can be estimated using the arrow size (5 m s−1) beneath the graphs. The grey area corresponds to the tundra region surrounding the GrIS.
katabatic wind intensity (Fig. 8b, e). In winter, a SIC de-crease results in a sharp rise in near-surface temperature, gen-erating a surface pressure reduction over the oceanic areas affected by a sea ice retreat (Fig. 9e). This leads to a small increase in the strength of winter katabatic flow (Fig. 10e).
The horizontal temperature gradient increases with rising SST (Figs. 7 and 9f), resulting in enhanced katabatic winds over coastal regions (Figs. 8 and 10f). However, changes in surface conditions are less extensive in winter than in sum-mer as the SST anomalies are restricted to ice-free oceanic areas. An increase in katabatic wind intensity is thus limited to the summer season (Fig. 8f).
Similar results are simulated for individual SST (Figs. 7 and 8c, f) and combined SIC–SST anomalies in summer (Figs. 7 and 8d, g) since summer SIC perturbations have no important effect on near-surface air temperature. In winter, the combined effects of SIC retreat and SST rise on surface
pressure add up to provide slightly stronger katabatic winds (Fig. 10d, g).
5 Conclusions
A regional climate model (MAR) was used to assess the GrIS SMB sensitivity to perturbations in SIC and SST in the seas surrounding Greenland. The results confirm previous find-ings that the direct impact of oceanic forcing on GrIS SMB is small and mainly limited to coastal regions, especially along the western periphery, where local SMB anomalies are in-duced by runoff perturbations, and the southeastern coast, where SMB is driven by precipitation variability. Changes in SIC significantly affect winter snowfall in the southeastern GrIS by modifying the moisture and heat fluxes between the ocean and the atmosphere. Solid precipitation is enhanced for a SIC retreat, leading to a significant positive anomaly in in-tegrated GrIS SMB. An increase in SST also enhances evap-oration and near-surface warming, leading to a rise in GrIS runoff which exceeds the increase in precipitation. When in-tegrated over the whole ice sheet, the net result is a small negative SMB anomaly. A combined SIC withdrawal associ-ated with an SST increase leads to both higher snowfall and runoff. Therefore, these ablation and accumulation processes compensate for each other, leaving integrated SMB almost unchanged.
These results are consistent with previous studies focusing on individual changes in SIC (Day et al., 2013), SST (Hanna et al., 2009), and combined SIC–SST forcings (Hanna et al., 2013a). However, Day et al. (2013) suggest a net decrease in integrated SMB induced by an Arctic SIC reduction com-bined with a global SST increase, raising the atmospheric temperature worldwide and affecting the general circula-tion. Nevertheless, this may also be due to the fact that HadRM3 underestimates contemporary GrIS precipitation (Vernon et al., 2013) and the ITM SMB model overestimates runoff (Day et al., 2013). This stresses the importance of accurately modeling contemporary SMB components, since their response to combined oceanic forcings is nonlinear as a result of the feedback between albedo, conditioned by snow-fall anomalies, and surface melt.
Given the small direct oceanic impact on GrIS SMB, the 2007–2012 melt records are thus more likely attributed to the recent persistent negative phase of the NAO, favor-ing anomalous southwesterly warm air advection towards the GrIS in the free atmosphere. Higher upper atmosphere temperatures would enhance the downward longwave radi-ation and hence increase the surface melting. Oceanic forc-ing might have indirectly contributed to the recent negative NAO shift (Overland and Wang, 2010; Jaiser et al., 2012). Continued sea ice retreat in summer may thus lead to pro-longed phases of negative NAO, further accelerating GrIS surface melt (Jaiser et al., 2012). By prescribing fixed an-nual mid-Pliocene Warm Period (≈ 3 Ma) reconstructed SIC
1880 B. Noël et al.: Sensitivity of GrIS SMB to perturbations in SST and SIC using MAR
(a) Reference
(b) SIC +6 (c) SST -4 (d) SIC +6/SST -4
(e) SIC -6 (f) SST +4 (g) SIC -6/SST +4
1 (a) Reference (b) SIC +6 (c) SST -4 (d) SIC +6/SST -4 (e) SIC -6 (f ) SST +4 (g) SIC -6/SST + 4 1 660 700 740 780 820 860 900 940 980 1020 (a) Reference (b) SIC +6 (c) SST -4 (d) SIC +6/SST -4
(e) SIC -6 (f) SST +4 (g) SIC -6/SST +4
1
Figure 7. JJA mean surface pressure (hPa) for the reference run (a) over 2007–2012. Difference in JJA mean surface pressure (hPa) between (b) SIC + 6, (c) SST − 4, (d) SIC + 6 / SST − 4, (e) SIC − 6, (f) SST + 4, (g) SIC − 6 / SST + 4 experiments and the reference run.
1
1
1
1
1
1
(a) Reference (b) SIC +6 (c) SST -4 (d) SIC +6/SST -4(e) SIC -6 (f) SST +4 (g) SIC -6/SST +4
1
1
1
1
1
1
1
(a) R eference (b) SIC +6 (c) SS T -4 (d) SIC +6/SST -4 (e) SIC -6 (f ) SST +4 (g) SIC -6/SST +4 1 0 1 2 3 4 5 6 7 8 9 10 11 12 13 14 15 16 171
1
1
1
1
1
(a) Reference (b) SIC +6 (c) SST -4 (d) SIC +6/SST -4(e) SIC -6 (f) SST +4 (g) SIC -6/SST +4
1
Figure 8. JJA mean wind speed (m s−1) for the reference run (a) over 2007–2012. Difference in the JJA mean wind speed (m s−1) between (b) SIC + 6, (c) SST − 4, (d) SIC + 6 / SST − 4, (e) SIC − 6, (f) SST + 4, (g) SIC − 6 / SST + 4 experiments and the reference run.
(i.e., sea ice-free Arctic Ocean in summer) and SST (i.e., 6 to 12◦C warmer than present day) in the GENESIS 3.0 global climate model, Koenig et al. (2014) show that a more permanent negative NAO pattern might occur in a future warmer climate. Their ice sheet model results suggest that this general circulation perturbation might considerably af-fect the GrIS SMB and lead to both a reduced ice sheet extent (≈ −71 %) and volume (≈ −83 %), resulting in a sea level rise of 5.8 m in a 5000-year time span. Arctic amplification,
partly induced by the positive melt–albedo feedback, may thus be a factor in the negative NAO trend observed since 2007 (Overland and Wang, 2010; Jaiser et al., 2012).
Finally, our results suggest that direct oceanic forcing is unlikely to be involved in the various melt records that have been set over the GrIS since 2007. The main reason is that katabatic winds, flowing down the ice sheet slopes, are strong enough to prevent near-surface oceanic air from penetrating far onto the ice sheet and hence affecting its
(a) Reference
(b) SIC +6 (c) SST -4 (d) SIC +6/SST -4
(e) SIC -6 (f) SST +4 (g) SIC -6/SST +4
1 (a) Reference SIC +6 (c) SST -4 (d) SIC +6/SST -4 SIC -6 (f ) SST +4 (g) SIC -6/SST + 4 1 660 700 740 780 820 860 900 940 980 1020 (a) Reference (b) SIC +6 (c) SST -4 (d) SIC +6/SST -4
(e) SIC -6 (f) SST +4 (g) SIC -6/SST +4
1
Figure 9. Annual mean surface pressure (hPa) for the reference run (a) over 2007–2012. Difference in annual mean surface pressure (hPa) between (b) SIC + 6, (c) SST − 4, (d) SIC + 6 / SST − 4, (e) SIC − 6, (f) SST + 4, (g) SIC − 6 / SST + 4 experiments and the reference run.
1
1
1
1
(a) Reference
(b) SIC +6 (c) SST -4 (d) SIC +6/SST -4
(e) SIC -6 (f) SST +4 (g) SIC -6/SST +4
1
1
1
1
1
(a) R eference (b) SIC +6 (c) SS T -4 (d) SIC +6/SST -4 (e) SIC -6 (f ) SST +4 (g) SIC -6/SST +4 1 0 1 2 3 4 5 6 7 8 9 10 11 12 13 14 15 16 171
1
1
1
(a) Reference (b) SIC +6 (c) SST -4 (d) SIC +6/SST -4(e) SIC -6 (f) SST +4 (g) SIC -6/SST +4
1
Figure 10. Annual mean wind speed (m s−1) for the reference run (a) over 2007–2012. Difference in the annual mean wind speed (m s−1) between (b) SIC + 6, (c) SST − 4, (d) SIC + 6 / SST − 4, (e) SIC − 6, (f) SST + 4, (g) SIC − 6 / SST + 4 experiments and the reference run.
SMB. At most, oceanic forcing may have slightly con-tributed to local SMB anomalies in coastal regions, where katabatic winds dissipate. In a future warmer climate, a rise in SST associated with a decline in SIC might even reinforce Greenland katabatic winds by enhancing the thermal contrast between the warmer ocean and the cold ice sheet interior. This might thus further reduce the direct oceanic impact on GrIS SMB. However, even though direct oceanic forcing does not considerably affect GrIS SMB, it does enhance the
calving rate of marine terminating glaciers in the southeast and northwest of Greenland (Thomas et al., 2003; Howat et al., 2005; Luckman and Murray, 2005; Bindschadler, 2006), when warm North Atlantic water infiltrates coastal fjords and melts the front and bottom of floating glacier tongues (Hanna et al., 2009).
Edited by: I. M. Howat
1882 B. Noël et al.: Sensitivity of GrIS SMB to perturbations in SST and SIC using MAR References
Bamber, J. L., Griggs, J. A., Hurkmans, R. T. W. L., Dowdeswell, J. A., Gogineni, S. P., Howat, I., Mouginot, J., Paden, J., Palmer, S., Rignot, E., and Steinhage, D.: A new bed elevation dataset for Greenland, The Cryosphere, 7, 499–510, doi:10.5194/tc-7-499-2013, 2013.
Bindschadler, R.: Hitting the Ice Sheets Where It Hurts, Science, 311, 1720–1721, doi:10.1126/science.1125226, 2006.
Box, J. E., Bromwich, D. H., and Bai, L. S.: Greenland ice sheet surface mass balance 1991–2000: application of Polar MM5 mesoscale model and in situ data, J. Geophys. Res., 109, D16105, doi:10.1029/2003JD004451, 2004.
Brun, E., David, P., Sudul, M., and Brunot, G.: A numerical model to simulate snow-cover stratigraphy for operational avalanche forecasting, J. Glaciol., 38, 13–22, 1992.
Day, J. J., Bamber, J. L., and Valdes, P. J.: The Greenland Ice Sheet’s surface mass balance in a seasonally sea ice-free Arctic, J. Geophys. Res.-Earth, 118, 1533–1544, doi:10.1002/jgrf.20112, 2013.
Dee, D. P., Uppala, S. M., Simmons, A. J., Berrisford, P., Poli, P., Kobayashi, S., Andrae, U., Balmaseda, M. A., Balsamo, G., Bauer, P., Bechtold, P., Beljaars, A. C. M., van de Berg, L., Bid-lot, J., Bormann, N., Delsol, C., Dragani, R., Fuentes, M., Geer, A. J., Haimberger, L., Healy, S. B., Hersbach, H., Hólm, E. V., Isaksen, L., Køallberg, P., Köhler, M., Matricardi, M., McNally, A. P., Monge-Sanz, B. M., Morcrette, J.-J., Park, B.-K., Peubey, C., de Rosnay, P., Tavolato, C., Thépaut, J.-N., and Vitart, F.: The ERA-Interim reanalysis: configuration and performance of the data assimilation system, Q. J. Roy. Meteor. Soc., 137, 553–597, doi:10.1002/qj.828, 2011.
Enderlin, E. M. and Howat, I. M.: Submarine melt rate estimates for floating termini of Greenland outlet glaciers (2000–2010), J. Glaciol., 59, 67–75, doi:10.3189/2013JoG12J049, 2013. Ettema, J., van den Broeke, M. R., van Meijgaard, E., and van de
Berg, W. J.: Climate of the Greenland ice sheet using a high-resolution climate model – Part 2: Near-surface climate and en-ergy balance, The Cryosphere, 4, 529–544, doi:10.5194/tc-4-529-2010, 2010.
Fettweis, X.: Reconstruction of the 1979–2006 Greenland ice sheet surface mass balance using the regional climate model MAR, The Cryosphere, 1, 21–40, doi:10.5194/tc-1-21-2007, 2007. Fettweis, X., Gallée, H., Lefebre, F., and van Ypersele, J.-P.:
Green-land surface mass balance simulated by a regional climate model and comparison with satellite-derived data in 1990–1991, Clim. Dynam., 24, 623–640, doi:10.1007/s00382-005-0010-y, 2005. Fettweis, X., Tedesco, M., van den Broeke, M., and Ettema, J.:
Melting trends over the Greenland ice sheet (1958–2009) from spaceborne microwave data and regional climate models, The Cryosphere, 5, 359–375, doi:10.5194/tc-5-359-2011, 2011. Fettweis, X., Hanna, E., Lang, C., Belleflamme, A., Erpicum, M.,
and Gallée, H.: Brief communication “Important role of the mid-tropospheric atmospheric circulation in the recent surface melt increase over the Greenland ice sheet”, The Cryosphere, 7, 241– 248, doi:10.5194/tc-7-241-2013, 2013.
Franco, B., Fettweis, X., Lang, C., and Erpicum, M.: Impact of spa-tial resolution on the modelling of the Greenland ice sheet sur-face mass balance between 1990–2010, using the regional cli-mate model MAR, The Cryosphere, 6, 695–711, doi:10.5194/tc-6-695-2012, 2012.
Gallée, H. and Schayes, G.: Development of a Three-Dimensional Meso-γ Primitive Equation Model: Katabatic Winds Simulation in the Area of Terra Nova Bay, Antarc-tica, Mon. Weather Rev., 122, 671–685, doi:10.1175/1520-0493(1994)122<0671:DOATDM>2.0.CO;2, 1994.
Gallée, H., Guyomarc’h, G., and Brun, E.: Impact of snow drift on the Antarctic ice sheet surface mass balance: possible sensitiv-ity to snow-surface properties, Bound.-Lay. Meteorol., 99, 1–19, 2001.
Gallée, H., Peyaud, V., and Goodwin, I.: Simulation of the net snow accumulation along the Wilkes Land transect, Antarc-tica, with a regional climate model, Ann. Glaciol., 41, 17–22, doi:10.3189/172756405781813230, 2005.
Hanna, E., Cappelen, J., Fettweis, X., Huybrechts, P., Luckman, A., and Ribergaard, M. H.: Hydrologic response of the Greenland ice sheet: the role of oceanographic warming, Hydrol. Process., 23, 7–30, doi:10.1002/hyp.7090, 2009.
Hanna, E., Fettweis, X., Mernild, S. H., Cappelen, J., Ribergaard, M. H., Shuman, C. A., Steffen, K., Wood, L., and Mote, T. L.: At-mospheric and oceanic climate forcing of the exceptional Green-land Ice Sheet surface melt in summer 2012, International J. Cli-matol., 23, 7–30, doi:10.1002/joc.3743, 2013a.
Hanna, E., Jones, J. M., Cappelen, J., Mernild, S. H., Wood, L., Stef-fen, K., and Huybrechts, P.: The influence of North Atlantic at-mospheric and oceanic forcing effects on 1900–2010 Greenland summer climate and ice melt/runoff, International J. Climatol., 33, 862–880, doi:10.1002/joc.3475, 2013b.
Heinemann, G.: The KABEG’97 field experiment: an aircraft-based study of katabatic wind dynamics over the Greenland ice sheet, Bound.-Lay. Meteorol., 93, 75–116, 1999.
Hoskins, B. J. and Hodges, K. I.: New perspectives on the Northern Hemisphere winter storm track, J. Atmos. Sci., 59, 1041–1061, doi:10.1175/1520-0469(2002)059<1041:NPOTNH>2.0.CO;2, 2002.
Howat, I. M., Joughin, I., Tulaczyk, S., and Gogineni, S.: Rapid re-treat and acceleration of Helheim Glacier, east Greenland, Geo-phys. Res. Lett., 32, L22502, doi:10.1029/2005GL024737, 2005. Jaiser, R., Dethloff, K., Handorf, D., Rinke, A., and Co-hen, J.: Impact of sea ice cover changes on the Northern Hemisphere atmospheric winter circulation, Tellus, 64, 11595, doi:10.3402/tellusa.v64i0.11595, 2012.
Jones, P. D., Jonsson, T., and Wheeler, D.: Extension to the North Atlantic Oscillation using early instrumental pressure observations from Gibraltar and South-West Iceland, Interna-tional J. Climatol., 17, 1433–1450, doi:10.1002/(SICI)1097-0088(19971115)17:13<1433::AID-JOC203>3.0.CO;2-P, 1997. Koenig, S. J., DeConto, R. M., and Pollard, D.: Impact of
Re-duced Arctic Sea Ice on Greenland Ice Sheet Variability in a Warmer Than Present Climate, Geophys. Res. Lett., 41, 3933– 3942, doi:10.1002/2014GL059770, 2014.
Lefebre, F., Gallée, H., van Ypersele, J.-P., and Greuell, W.: Modeling of snow and ice melt at ETH Camp (West Green-land): a study of surface albedo, J. Geophys. Res., 108, 4231, doi:10.1029/2001JD001160, 2003.
Lefebre, F., Fettweis, X., Gallée, H., van Ypersele, J.-P., Marbaix, P., Greuell, W., and Calanca, P.: Evaluation of a high-resolution regional climate simulation over Greenland, Clim. Dynam., 25, 99–116, doi:10.1007/s00382-005-0005-8, 2005.
Lenaerts, J. T. M., van den Broeke, M. R., van Angelen, J. H., van Meijgaard, E., and Déry, S. J.: Drifting snow climate of the Greenland ice sheet: a study with a regional climate model, The Cryosphere, 6, 891–899, doi:10.5194/tc-6-891-2012, 2012. Luckman, A. and Murray, T.: Seasonal variation in velocity before
retreat of Jakobshavn Isbrae, Greenland, Geophys. Res. Lett., 32, L08501, doi:10.1029/2005GL022519, 2005.
Osborn, T. J.: Simulating the winter North Atlantic Oscillation: the roles of internal variability and greenhouse gas forcing, Clim. Dynam., 22, 605–623, doi:10.1007/s00382-004-0405-1, 2004. Overland, J. E. and Wang, M.: Large-scale atmospheric circulation
changes are associated with the recent loss of Arctic sea ice, Tel-lus, 62, 1–9, doi:10.1111/j.1600-0870.2009.00421.x, 2010. Overland, J. E., Francis, J. A., Hanna, E., and Wang, M.: The recent
shift in early summer Arctic atmospheric circulation, Geophys. Res. Lett., 39, L19804, doi:10.1029/2012GL053268, 2012. Rae, J. G. L., Aõalgeirsdòttir, G., Edwards, T. L., Fettweis, X.,
Gre-gory, J. M., Hewitt, H. T., Lowe, J. A., Lucas-Picher, P., Mottram, R. H., Payne, A. J., Ridley, J. K., Shannon, S. R., van de Berg, W. J., van de Wal, R. S. W., and van den Broeke, M. R.: Greenland ice sheet surface mass balance: evaluating simulations and mak-ing projections with regional climate models, The Cryosphere, 6, 1275–1294, doi:10.5194/tc-6-1275-2012, 2012.
Rennermalm, A. K., Smith, L. C., Stroeve, J. C., and Chu, V. W.: Does sea ice influence Greenland ice sheet surface-melt?, Env-iron. Res. Lett., 4, 024011, doi:10.1088/1748-9326/4/2/024011, 2009.
Ridder, K. D. and Gallée, H.: Land surface-induced regional climate change in Southern Israel, J. Appl. Meteorol., 37, 1470–1485, doi:10.1175/1520-0450(1998)037<1470:LSIRCC>2.0.CO;2, 1998.
Rignot, E., Velicogna, I., van den Broeke, M. R., Monaghan, A., and Lenaerts, J. T. M.: Acceleration of the contribution of the Greenland and Antarctic ice sheets to sea level rise, Geophys. Res. Lett., 38, L05503, doi:10.1029/2011GL046583, 2011. Shepherd, A., Ivins, E. R., A, G., Barletta, V. R., Bentley, M. J.,
Bet-tadpur, S., Briggs, K. H., Bromwich, D. H., Forsberg, R., Galin, N., Horwath, M., Jacobs, S., Joughin, I., King, M. A., Lenaerts, J. T. M., Li, J., Ligtenberg, S. R. M., Luckman, A., Luthcke, S. B., McMillan, M., Meister, R., Milne, G., Mouginot, J., Muir, A., Nicolas, J. P., Paden, J., Payne, A. J., Pritchard, H., Rignot, E., Rott, H., Sørensen, L. S., Scambos, T. A., Scheuchl, B., Schrama, E. J. O., Smith, B., Sundal, A. V., van Angelen, J. H., van de Berg, W. J., van den Broeke, M. R., Vaughan, D. G., Velicogna, I., Wahr, J., Whitehouse, P. L., Wingham, D. J., Yi, D., Young, D., and Zwally, H. J.: A Reconciled Estimate of Ice-Sheet Mass Bal-ance, Science, 338, 1183–1189, doi:10.1126/science.1228102, 2012.
Stark, J. D., Office, E. M., Donlon, C. J., Martin, M. J., and McCul-loch, M. E.: OSTIA: An operational, high resolution, real time, global sea surface temperature analysis system, OCEANS 2007 – Europe, 1–4, doi:10.1109/OCEANSE.2007.4302251, confer-ence Publications, 2007.
Tedesco, M. and Fettweis, X.: 21st century projections of surface mass balance changes for major drainage systems of the Green-land ice sheet, Environ. Res. Lett., 7, 045405, doi:10.1088/1748-9326/7/4/045405, 2012.
Tedesco, M., Fettweis, X., Mote, T., Wahr, J., Alexander, P., Box, J. E., and Wouters, B.: Evidence and analysis of 2012 Greenland records from spaceborne observations, a regional climate model and reanalysis data, The Cryosphere, 7, 615–630, doi:10.5194/tc-7-615-2013, 2013.
Thomas, R. H., Abdalati, W., Frederick, E., Krabill, W. B., Man-izade, S., and Steffen, K.: Investigation of surface melting and dynamic thinning on Jakobshavn Isbrae, Greenland, J. Glaciol., 49, 231–239, doi:10.3189/172756503781830764, 2003. Van Angelen, J. H., van den Broeke, M. R., Wouters, B., and
Lenaerts, J. T. M.: Contemporary (1960–2012) evolution of the climate and surface mass balance of the Greenland ice sheet, Surv. Geophys., 35, 1155–1174, doi:10.1007/s10712-013-9261-z, 2013.
Van den Broeke, M., Bamber, J., Ettema, J., Rignot, E., Schrama, E., van de Berg, W. J., van Meijgaard, E., Velicogna, I., and Wouters, B.: Partitioning Recent Greenland Mass Loss, Science, 326, 984– 986, doi:10.1126/science.1178176, 2009.
Vernon, C. L., Bamber, J. L., Box, J. E., van den Broeke, M. R., Fettweis, X., Hanna, E., and Huybrechts, P.: Surface mass bal-ance model intercomparison for the Greenland ice sheet, The Cryosphere, 7, 599–614, doi:10.5194/tc-7-599-2013, 2013. Wouters, B., Bamber, J. L., van den Broeke, M. R., Lenaerts, J.
T. M., and Sasgen, I.: Limits in detecting acceleration of ice sheet mass loss due to climate variability, Nat. Geosci., 6, 613–616, doi:10.1038/ngeo1874, 2013.