E-proceedings of the 36th IAHR World Congress 28 June – 3 July, 2015, The Hague, the Netherlands
1 COMPOSITE HYDRAULIC MODELING TO DESIGN A COMPLEX DAM SPILLWAY
ERPICUM S.(1), DEWALS B.J.(1), ARCHAMBEAU P.(1) & PIROTTON M.(1)
(1)
University of Liege, Argenco Department, HECE Research group, Liege, Belgium, [email protected]; [email protected]
ABSTRACT
The paper presents the application of a composite hydraulic modeling approach to the rehabilitation studies of a complex dam spillway. First, a physical scale model of the existing works has been built and operated. It enabled to define very accurately the actual discharge capacity and to validate a numerical model of the system. Second, the numerical model has been used to rapidly test several rehabilitation solutions. Finally, the final design has been validated and optimized using the physical model. The paper shows how composite hydraulic modeling enables to combine the inherent advantages of physical and numerical modeling approaches, which are complementary, while being beneficial to the delay as well as the quality of the analysis.
Keywords: Numerical modeling, Physical modeling, Depth-averaged flow model, Weir, Spillway rehabilitation 1. INTRODUCTION
Physical modeling and numerical modeling are two efficient analysis approaches in hydraulic engineering. They may be combined within so-called composite or hybrid modelling (Frostick et al., 2011; Novak et al., 2010). This enables to optimally take benefit of the respective strengths of each modelling approach, while compensating for their specific drawbacks (Erpicum et al., 2012; Sutherland et al., 2011). Within the various strategies to combine physical and numerical modelling for saving costs while enhancing the quality of a study (Dewals et al., 2013), this paper presents an application of the “validation and extrapolation process”. In such an approach, a numerical model is first validated against experimental data and subsequently used to extend the analysis beyond the range of parameters which have been considered in the available experimental facility.
The subject of the study is a spillway (Figure 1) made of three 12-m wide gated bays on the top of a broad crested weir. The structure is located on the left bank of a valley closed by a concrete gravity dam. The gates discharge in a channel with a limited bottom slope and a decreasing width followed by a steep slope section to the downstream natural valley. The channel axis is not aligned along the weir axis.
Figure 1. Downstream view of the existing structures.
The dam is operated by the French electricity production company “Société Hydro-Electrique du Midi (SHEM)”. Its maximum discharge capacity is not precisely known. However, a recent update in the site hydrology suggested that an increase of the spillway discharge capacity is required to maintain the dam safety level. In this context, the SHEM entrusted the Hydraulic Engineering Laboratory of the University of Liege, part of the HECE research group, with the hydraulic design of an optimized solution.
E-proceedings of the 36th IAHR World Congress,
28 June – 3 July, 2015, The Hague, the Netherlands
2
In addition to the non-conventional profile of the existing broad crested weir, the study is complex because of the topographic characteristics of the channel downstream of the gates. Indeed, it appears that, depending on the discharge, the flow control section may shift from the weir crest to a section somewhere in the channel.
Because of these specific characteristics, a proper physical model study represents the most reliable approach to tackle the problem with the required level of confidence. However, as the expected flow conditions are complex and the structure geometry non common, the optimization process will probably have to consider a large range of parameters and possible solutions. A full physical modeling approach will thus be time and cost consuming. That’s why it has been decided to couple to the experimental approach a numerical model study in the way presented in this paper. First, a physical scale model of the existing works has been built and operated. It enabled to define very accurately the existing discharge capacity and to validate a numerical model of the system. Second, the numerical model has been used to rapidly test several rehabilitation solutions. Finally, the optimized design has been validated using the physical model.
2. MATERIAL AND METHOD 2.1 Physical model
The physical model has been build considering the Froude similarity (free surface flows) with a 1:35 scale factor. Considering the design discharge, the Reynolds number on the scale model is around 105. Its order of magnitude is 107 in the prototype. Both structures operate thus in turbulent flow conditions and the scale model is a little bit rougher than the prototype.
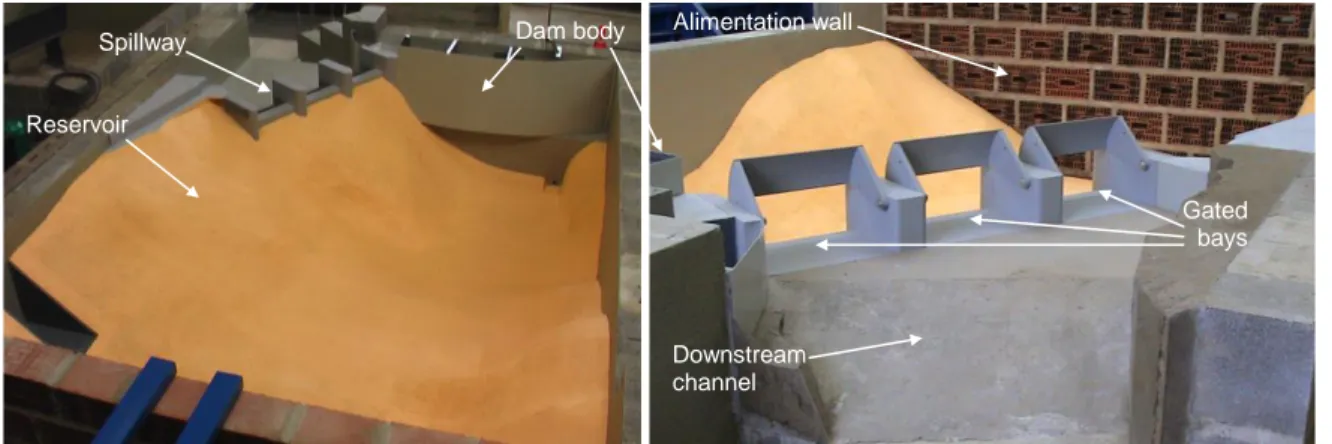
The scale model includes (Figure 2) a part of the reservoir around the spillway, the 3 gated bays and a reach of the downstream channel ending in the steep slope section. It has been build using plastic, aluminum (concrete structures) and mortar (reservoir and channel topography). The upstream boundary condition is the discharge, injected in the reservoir through a permeable screen. No downstream boundary condition is imposed as the flow conditions in the steep slope channel section are supercritical. An electromagnetic discharge meter on the water alimentation pipe has been used to measure the steady discharges injected in the model and a point gauge placed in the reservoir, close to the spillway in an area with low flow velocity, has been used to measure the reservoir levels.
Figure 2. Physical model representing the existing configuration - Upstream (left) and downstream (right) views.
In a first step, the physical model was representing the existing geometric configuration of the spillway (Figure 2). In a second step, it has been modified to test and validate the final design defined from numerical modeling.
2.2 Numerical model
Numerical modeling of the spillway has been considered using a state of the art two-dimensional (2D) depth-averaged flow model developed by the authors (Erpicum et al., 2010; Dewals et al., 2008). The expected flow conditions on the broad crested weirs and in the channel are mainly two-dimensional and a full 3D modeling approach is thus not needed to capture the main flow characteristics. However, requiring less computation means and being less complex to generate than a 3D approach, a 2D modeling will help in reducing the delays of the study while maintaining the adequate level of quality.
The 2D model, called Wolf2D, uses a finite volume method based on Cartesian multiblock grids. It is widely recognized nationally and internationally and is routinely exploited for research, education and consultancy at the University of Liege. It has been verified against many experimental and other reference test cases (for instance Erpicum et al., 2010; Erpicum et al., 2009; Dewals et al., 2008). In this study, it has been applied to model the flow downstream of the weirs and to analyze the effect of various modifications of the channel geometry.
A fine mesh size of 25 cm has been chosen. A Manning-Strickler roughness coefficient equal to 60 m1/3/s has been applied on the whole computation domain. All the simulations considered the gates fully opened and the design discharge of 673 m³/s. The upstream boundary condition was the discharge upstream of the weirs, in the reservoir. No downstream boundary condition was needed thanks to the steep slope of the downstream channel section (supercritical flow conditions).
In this modeling configuration, less than 10 to 15 minutes are needed to get a converged solution for a steady discharge, whatever the channel topography.
Reservoir
Spillway Dam body Alimentation wall
Downstream channel
Gated bays
E-proceedings of the 36th IAHR World Congress 28 June – 3 July, 2015, The Hague, the Netherlands
3 3. RESULTS
3.1 Existing structures and numerical model validation
In a first step, the discharge capacity of the existing spillway has been assessed by dedicated tests on the physical model. From these tests, it appeared that the discharge coefficient of the existing weirs decreases with increasing upstream head and becomes a constant for discharges above 220 m³/s (value around 0.36). The low value of the discharge coefficient suggests that some or all the bays are submerged for high discharges, with a shift of the control section from the weirs crest to the downstream channel whose width is smaller than the bays cumulated width.
Thus, these first results showed that
The spillway is under designed regarding up-to-date discharge capacity requirements;
The channel topography is the limiting component for the left and the central bays;
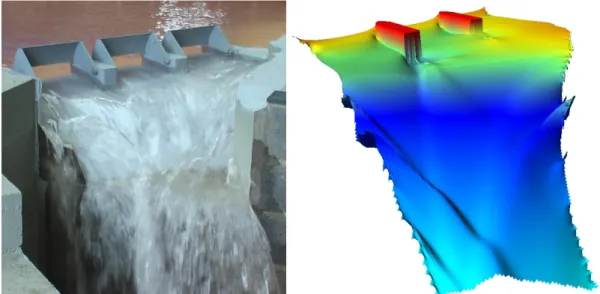
The physical model has also been used to validate the 2D numerical model by comparison of the numerical results with the experimental ones (Figure 4). In particular, the numerical results showed that, for the design discharge and the existing configuration, the regime transition for the flow through the left and the central bay is located on the slope change in the downstream channel and not on the weirs crest (Figure 5 - left).
Figure 4. Experimental (left) and numerical (right) modeling of the design discharge (673 m³/s) in the existing configuration. 3.2 Numerical optimization
Numerical modeling has been performed to define the minimal modifications of the channel topography needed to avoid downstream submergence of the bays. 12 modifications of the downstream channel width and slope have been tested. Thanks to the quick convergence of simulations, these tests have been performed in a few days while it would have required weeks to be done on the physical model.
Efficiency of the rehabilitation solutions has been assessed regarding the Froude number distribution in the simulation domain (Figure 5). For a bay to operate properly, and thus to act as a control section of the flow, the Froude number has to increase from values below 1 to values above 1 near the weir crest. In particular, for bays where the Froude number is lower than 1 everywhere, there is no critical flow section and the weir is submerged (left bay on figure 5-left for instance).
Figure 5. Computed Froude numbers (blue: lower than 1; red: higher than 1) – Existing configuration (left); first modified solution (center); optimized design (right)
E-proceedings of the 36th IAHR World Congress,
28 June – 3 July, 2015, The Hague, the Netherlands
4
3.3 Validation
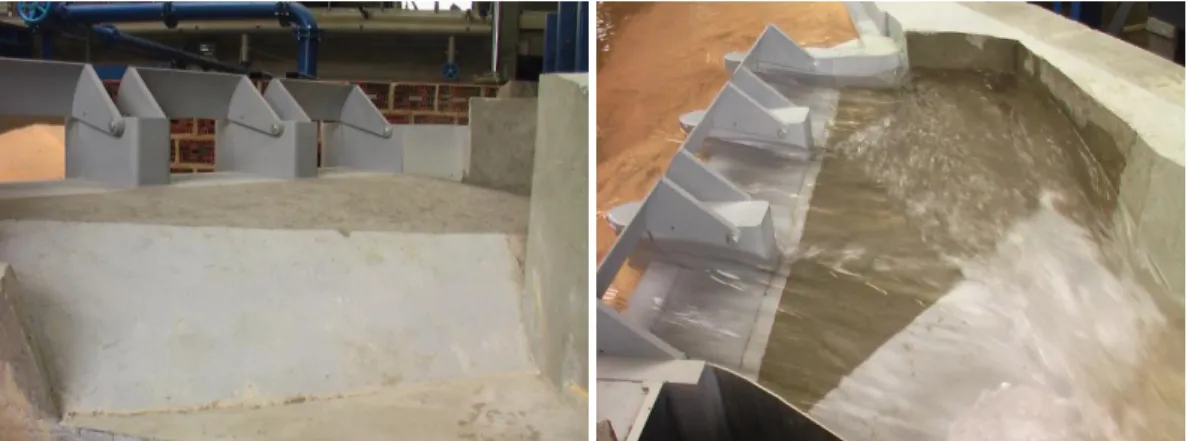
The optimized solution defined using the numerical model combines an increase of the channel slope immediately downstream of the bays and an increase of its width along the left bank (Figure 5-right), in front of the left bay.
For the purpose of validation, it has been reproduced on the physical model (Figure 6). The results of the experimental tests showed that the discharge coefficient of the broad crested weirs in the bay is equal to a constant value of 0.38, whatever the discharge. In addition, the observation of the flow conditions (Figure 6-right) showed that the bays are not submerged and that the modifications of the downstream channel topography are useful. This validates thus the numerical results.
Figure 6. Physical model - Optimized geometry of the spillway (left) and flow for a reservoir at its maximum level (right). 4. CONCLUSION
In this paper, the combined application of physical and numerical modeling to the rehabilitation studies of a complex dam spillway has been proved to be beneficial to the delay as well as the quality of the analysis. This approach combines the inherent advantages of both technics, which are complementary, and represents thus undoubtedly the best option for the future of complex hydraulic modeling analyses.
ACKNOWLEDGMENTS
The Authors greatly acknowledge the French Company “Société Hydro-Electrique du Midi (SHEM)” for entrusting the Hydraulic Engineering Laboratory of the University of Liege with the study presented in this paper and for giving its permission to publish the experimental and the numerical results.
REFERENCES
Dewals, B.J., Erpicum, S., Archambeau, P. and Pirotton, M. (2008). Depth-integrated flow modelling taking into account bottom curvature. Journal of Hydraulic Research, 44 (6), 787-795
Dewals, B.J., Archambeau, P., Rulot, F., Pirotton, M. and Erpicum, S. (2013). Physical and numerical modelling in low-head structures design. Proc. of the Int. Work. on Hydraulic Design of Low-Head Structures, Ed. D. Bung and S. Pagliara, Karlsruhe, Germany, 11-30.
Erpicum, S., Meile, T., Dewals, B.J., Pirotton, M. and Schleiss, A. (2009). 2D numerical flow modeling in a macro-rough channel. International Journal for Numerical Methods in Fluids, 61 (11), 1227-1246.
Erpicum, S., Dewals, B.J., Archambeau, P. and Pirotton, M. (2010). Dam-break flow computation based on an efficient flux-vector splitting. Journal of Computational & Applied Mathematics, 234, 2413-2151.
Erpicum, S., Dewals, B.J., Archambeau, P. and Pirotton, M. (2012). Composite modeling to enhance hydraulic structures studies. La Houille Blanche, 6, 34-40.
Frostick, L. E., McLelland, S. J. and Mercer, T. G. (2011). Users guide to physical modelling and experimentation – IAHR design manual. CRC Press,245 pp.
Novak, P., Guinot, V., Jeffrey, A. and Reeve, D.E. (2010). Hydraulic modelling – An introduction. Spon Press, 599 pp. Sutherland, J. and Barfuss, S.L. (2011). Composite modelling: combining physical and numerical models. Proc. of the 34th