1
I
maging is pivotal to modern health care and is an essentialcomponent of many patients’ diagnostic scenarios.1 In recent
decades, the use of nonionizing techniques in cardiovascular imaging has grown considerably, mainly because of the increased use of ultrasound and magnetic resonance imaging (MRI).2
Cardiac magnetic resonance (CMR) imaging offers expanding potential in research and diagnosis, with tissue discrimination unequalled by any other imaging technique.3 MRI uses a
power-ful electromagnetic field to induce a resonance effect of some atomic nuclei in the body.4 MRI is thought to have no long-term
side effects, conversely to ionizing radiation-based imaging techniques (x-ray angiography, coronary computed tomographic angiography, and nuclear imaging), which can induce cell death or persistent DNA damage, resulting in mutagenesis, carcino-genesis, and genomic instability.5–8 However, genotoxic
con-cerns have been recently raised.9,10 Several studies reported an
immediate post-MRI increase of histone H2AX phosphoryla-tion (γ-H2AX) in lymphocytes, a marker of DNA double-strand breaks, in a magnitude comparable with damages produced by
low-dose ionizing radiation.11–13 Whether MRI-induced DNA
damage can persist or evolve over time is unknown. In this study, we sought to evaluate the early and late biological responses of blood cells (DNA double-strand breaks, cell count, cell death, and cell activation) to CMR in normal subjects.
See Editorial by Kaufmann
See Clinical Perspective
Methods
PopulationThe study was approved by the local Institutional Human Research Committee and conducted according to the ethical guidelines and principles of the international Helsinki declaration. After informed consent, 20 healthy male subjects ≥20 years (31.4±7.9 years) with normal physical cardiac examination (with no systolic nor diastolic murmur), normal ECG, without history of any cardiovascular disease or history of current smoking, no chronic excessive alcohol consump-tion, not currently on medical therapy with cardio-active drugs were prospectively recruited. Every volunteer was asked not to practice Background—Cardiac magnetic resonance (CMR) is increasingly used for the diagnosis and management of cardiac diseases. Recent studies have reported immediate post-CMR DNA double-strand breaks in T lymphocytes. We sought to evaluate CMR-induced DNA damage in lymphocytes, alterations of blood cells, and their temporal persistence.
Methods and Results—In 20 prospectively enrolled healthy men (31.4±7.9 years), blood was drawn before and after (1–2 hours, 2 days, 1 month, and 1 year) unenhanced 1.5T CMR. Blood cell counts, cell death, and activation status of lymphocytes, monocytes, neutrophils, and platelets were evaluated. The first 2-hour post-CMR were characterized by a small increase of lymphocyte B and neutrophil counts and a transient drop of total lymphocytes because of a decrease in natural killer cells. Among blood cells, only neutrophils and monocytes displayed slight and transient activation. DNA double-strand breaks in lymphocytes were quantified through flow cytometric analysis of H2AX phosphorylation (γ-H2AX). γ-H2AX intensity in T lymphocytes did not change early after CMR but increased significantly at day 2 ≤1 month before returning to baseline levels of 1-year post-CMR.
Conclusions—Unenhanced CMR is associated with minor but significant immediate blood cell alterations or activations figuring inflammatory response, as well as DNA damage in T lymphocytes observed from day 2 until the first month but disappearing at 1-year follow-up. Although further studies are required to definitely state whether CMR can be used safely, our findings already call for caution when it comes to repeat this examination within a month. (Circ Cardiovasc Imaging. 2015;8:e003697. DOI: 10.1161/CIRCIMAGING.115.003697.)
Key Words: blood cells ◼ cell death ◼ DNA damage ◼ flow cytometry ◼ lymphocytes
© 2015 American Heart Association, Inc.
Circ Cardiovasc Imaging is available at http://circimaging.ahajournals.org DOI: 10.1161/CIRCIMAGING.115.003697
Received May 4, 2015; accepted July 23, 2015.
From the Department of Cardiology and Radiology, GIGA-Cardiovascular Sciences (P.L., A.N., C.D., A.H., A.G., L.J.-F.T., C.O.) and Hematology Department, University Hospital Sart Tilman (C.G., A.G.), University of Liège, Liège, Belgium; and Gruppo Villa Maria Care and Research, E.S. Health Science Foundation, Lugo (RA), Italy (P.L.).
*Drs Lancellotti and Nchimi contributed equally to this work.
The Data Supplement is available at http://circimaging.ahajournals.org/lookup/suppl/doi:10.1161/CIRCIMAGING.115.003697/-/DC1.
Correspondence to Patrizio Lancellotti, MD, PhD, Department of Cardiology, University of Liège Hospital, CHU Sart Tilman, Avenue de l’Hopital, 1 B-4000 Liège, Belgium. E-mail plancellotti@chu.ulg.ac.be
Biological Effects of Cardiac Magnetic Resonance
on Human Blood Cells
Patrizio Lancellotti, MD, PhD
*; Alain Nchimi, MD, PhD
*; Céline Delierneux, MSc;
Alexandre Hego, BSc; Christian Gosset, MSc; André Gothot, MD, PhD;
Luaba Jean-Flory Tshibanda, MD; Cécile Oury, PhD
by guest on September 4, 2015
http://circimaging.ahajournals.org/
Downloaded from http://circimaging.ahajournals.org/ by guest on September 4, 2015 Downloaded from http://circimaging.ahajournals.org/ by guest on September 4, 2015 Downloaded from
intense sport, not to use sunlamps, or tanning bed the week before the first blood drawing. They did not travel by plane during the time of the study. A negative control group of 5 age-matched male subjects responding to the same inclusion criteria but who did not undergo CMR examination was also included.
CMR Protocol
Twenty subjects underwent unenhanced CMR examination using a 1.5 T system (Aera, Siemens Medical Systems, Erlangen, Germany), equipped with a 45 mT/m maximum gradient and 200 T/m per sec-ond slew rate. Subjects were placed supine and examinations were performed using a 6-channel body coil placed on subject’s chest. All sequences were acquired using electrocardiographic synchroniza-tion/triggering, at deep breath hold using integrated parallel imag-ing to accelerate image acquisition by a factor of 2. In this imagimag-ing protocol, the sequences performed usually for most heart diseases included: heart scouting; short-axis dark-blood T2 weighted and T1 weighted, multiplanar ventricular and valve cine, T1 mapping using inversion-recovery Look-Locker sequence (variable inversion time), bidimensional dynamic saturation prepared, and tridimensional in-version-recovery T1-weighted sequences (Table 1). Imaging field-of-views were adapted to the subject’s size. Tissue-specific absorption rates were recorded and the total absorbed energy was calculated as the sum of the specific absorption rate of each set of sequences mul-tiplied by the subject’s body weight.
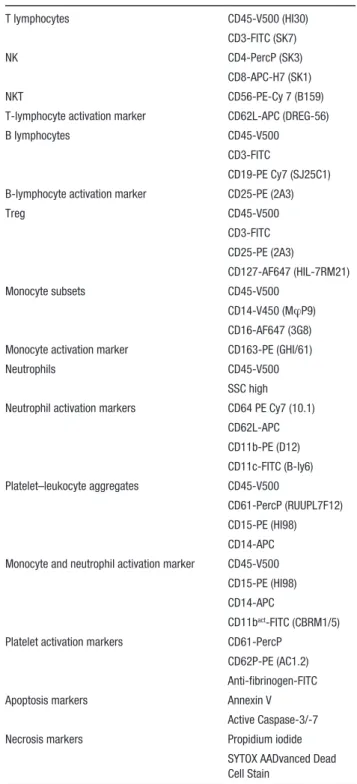
Blood Sample Collection and Flow Cytometry Anticoagulated blood samples were collected by venipuncture from the volunteers before and after (1–2 hours, 2 days, 1 month, and 1 year) CMR examination. Blood cell count was determined in EDTA blood samples using a Cell-Dyn 3700 hemocytometer (Abbott Laboratories). Heparinized blood was used to study differential counts of leukocyte subsets and assess their activation by flow cy-tometry according to standard procedures (FACS Verse, BD). Data analyses were performed using the BD FACSuite software. Subset-specific antibody panels are depicted in Table 2. Platelet activation and the presence of platelet–monocyte and platelet–neutrophil aggre-gates were analyzed in citrated blood. Platelet activation was assessed in flow cytometry by measuring the expression of P-selectin, a marker of degranulation, and fibrinogen binding, as a result of integrin αIIbβ3 activation, on cell surface. Activated platelets are positive for both the markers. All the antibodies were purchased from BD biosciences except for the antihuman CD11b-Activated Antibody (CBRM1/5; eBioscience) and the polyclonal antifibrinogen antibody (Dako).
Levels of γ-H2AX in T-lymphocyte subsets and in natural killer (NK) cells were determined by flow cytometry by incubating whole blood with a mixture of the following antibodies: CD45-V500 (HI30), CD3-FITC (SK7), CD4-PercP (SK3), CD8-APC-H7 (SK1), and CD56-PE CY7 (B159). After fixation, cells were permeabilized in 0.5% Triton-X100, before adding the primary anti–γ-H2AX rab-bit monoclonal antibody (Cell Signaling) and Alexa Fluor 647 con-jugated secondary anti-rabbit IgG (H+L), F(ab′)2 Fragment (Cell Signaling).
Apoptosis of T lymphocytes was analyzed by flow cytometry using the Annexin V apoptosis detection kit (BD biosciences), or a combination of the CellEvent Caspase 3/7 Green Detection Reagent and the SYTOX AADvanced Dead Cell Stain (Life Technologies).
Statistical Analysis
Statistical analysis was performed with GraphPad-Prism (GraphPad Software, Inc). All data are presented as mean±SD. The Wilcoxon signed-rank test was used to assess significant differences between the analyzed variables before and after CMR examination. Values of
P<0.05 were considered significant.
Results
CMR ExaminationThe unenhanced CMR examination was completed using the same protocol in all patients within a range of 35 to 40 min-utes. The total specific absorption rate was 518.4±71.6 J/kg and the total energy absorbed was 44±6 kJ. The cardiac struc-ture and function appeared normal in all subjects.
Lymphocyte DNA Double-Strand Breaks
Flow cytometric analysis of γ-H2AX levels indicated that CMR did not cause significant DNA damage in T lympho-cytes when assessed 1 or 2 hours after the examination (Figure 1). However, a follow-up of the volunteers 2 days and 1 month after CMR revealed a significant increase of the mean of γ-H2AX median fluorescence of intensity (arbitrary units) when compared with values measured before CMR (396.9±214.5 [95% confidence interval {CI}, 286.7–507.2] after 2 days, and 529.1±424.1 [95% CI, 294.2–763.9] after
Table 1. Cardiac Magnetic Resonance Imaging Protocol Parameters
Sequence Slice No. Readout Repetition Time, ms Echo time, ms Flip Angle, ° Inversion/ Saturation Time, ms Slice Thickness, mm In-Plane Resolution, mm² Quantity Frames No. Mean SAR, J/kg Scouting 24–50 SSFP 289–330 1.12 80 NA 8 1.6×1.6 1 NA 50.4±24.9 Short-axis dark bloodT2 IR 8 TSE 800 52 180 170 (Slice- selective) 5 1.3×1.3 1 NA 63.6±16.5 Cine heart 14 SSFP 34.97 1.16 80 NA 6 2×2 1 25 220±81.7 Short-axis dark bloodT1 8 TSE 700 24 180 NA 5 1.3×1.3 1 NA 117.8±84.4 Modified look-locker 4 SSFP 325 1.12 35 129–209 8 1.4×1.4 2 NA 5.2±1.3 SP dynamic T1 4–5 GRE 162.25 1.10 12 100 (Nonselective) 10 2.4×2.4 1 50 17.8±2.2
Cine valves 1 GRE 49.21 3.28 15 NA 8 1.3×1.3 3–4 25 40.6±35.3
3D T1 IR 12 GRE 848 1.65 10 Variable
(Nonselective)
4 1.6×1.6 3 NA 15.6±4.7
GRE indicates gradient echo; IR, inversion recovery; NA, not applicable; SAR, specific absorption rate; SP, saturation prepared; SSFP, Steady-state free precession; and TSE, turbo spin echo.
1 month versus 238.4±88.2 [95% CI, 194.6–282.3] before CMR; P<0.02; Table 3).
To verify that this increase of γ-H2AX intensity was because of CMR and not to magnetic field unrelated factors, we assessed the extent of γ-H2AX changes over 2 days in blood samples drawn from 5 distinct healthy volunteers who did not undergo CMR examination. In these samples, we did not observe any significant changes in lymphocyte γ-H2AX levels (mean median intensity of fluorescence: T0 day 240.1±72.5,
[95% CI, 150.1–330.2] versus T2 days 282.3±107.3, [95% CI, 149.1–415.5]; P=0.31;Figure in the Data Supplement).
Further evidence supporting a causal relationship between γ-H2AX intensity changes and CMR is provided by a strong correlation between the augmentation of γ-H2AX levels at 1 month and individual-specific absorption rate (r=0.79; P=0.0005; Figure 2). The analysis was repeated after 1 year on blood samples from the same study volunteers (obtained in 12 subjects; Figure 1). None of them displayed persistent T-lymphocyte DNA damage 1 year after CMR.
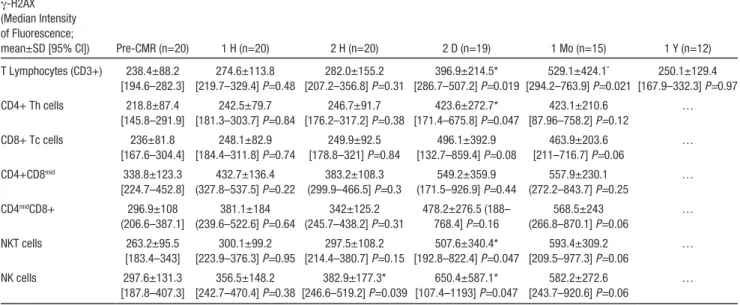
To further characterize CMR effect on lymphocyte DNA damage, we compared γ-H2AX levels in 5 CD3+ T-lymphocyte subsets as well as in NK cells (Figure 3; Table 3). We did not detect significant increase of γ-H2AX levels in any T-lymphocyte subset when the analysis was per-formed 1 or 2 hours after CMR. In contrast, a slight γ-H2AX increase was observed at 2 hours for NK CD56 mid cells, the most abundant NK cell population in blood, which persisted after 2 days (Figure 3C). At this time, γ-H2AX was similarly elevated in CD4+ T-helper cells and in CD8+ T-cytotoxic cells. A significant increase was also observed in NKT CD3-CD56+ cells. To address the biological effect of this phenomenon, we investigated whether the augmentation of γ-H2AX levels was associated with cell death. We did not detect apoptosis or necrosis in any T-lymphocyte subset throughout the follow-up period. The percentage of Annexin V+ T lymphocytes (Table 4) or those expressing active caspase-3/7 (not shown) never exceeded the levels measured before CMR.
Blood Cell Counts
Changes in blood cell counts were assessed during follow-up using a routine hemocytometer and flow cytometry. A
Table 2. Cell Type–Specific Antibody Panels, Activation, and Apoptosis Markers
T lymphocytes CD45-V500 (HI30)
CD3-FITC (SK7)
NK CD4-PercP (SK3)
CD8-APC-H7 (SK1)
NKT CD56-PE-Cy 7 (B159)
T-lymphocyte activation marker CD62L-APC (DREG-56)
B lymphocytes CD45-V500
CD3-FITC
CD19-PE Cy7 (SJ25C1) B-lymphocyte activation marker CD25-PE (2A3)
Treg CD45-V500 CD3-FITC CD25-PE (2A3) CD127-AF647 (HIL-7RM21) Monocyte subsets CD45-V500 CD14-V450 (MφP9) CD16-AF647 (3G8) Monocyte activation marker CD163-PE (GHI/61)
Neutrophils CD45-V500
SSC high Neutrophil activation markers CD64 PE Cy7 (10.1)
CD62L-APC CD11b-PE (D12) CD11c-FITC (B-ly6) Platelet–leukocyte aggregates CD45-V500 CD61-PercP (RUUPL7F12) CD15-PE (HI98) CD14-APC Monocyte and neutrophil activation marker CD45-V500
CD15-PE (HI98) CD14-APC
CD11bact-FITC (CBRM1/5)
Platelet activation markers CD61-PercP CD62P-PE (AC1.2) Anti-fibrinogen-FITC
Apoptosis markers Annexin V
Active Caspase-3/-7 Necrosis markers Propidium iodide
SYTOX AADvanced Dead Cell Stain
NK cells indicates natural killer cells.
Figure 1. A, Amount of DNA double-strand breaks in peripheral
T lymphocytes before and 1 hour, 2 hours, 2 days, 1 month, and 1 year after cardiac magnetic resonance (CMR) scan assessed by flow cytometry analysis of γ-H2AX median fluorescence of intensity. Data represent the mean±SD (*P<0.05). B, Individual
values are interconnected with a line. MFI indicates median fluo-rescence intensity.
slight transient drop of total lymphocytes occurred 1 hour after CMR, which we found to be because of a decrease of absolute counts of NK and NKT cells (Table 5). Lympho-cyte B and neutrophil counts were transiently augmented 2 hours after CMR. Although total monocyte counts were not affected, detailed analysis of the 3 monocyte subsets (classi-cal CD14++CD16−, intermediate CD14++CD16+, and non-classical CD14+CD16++; Ziegler–Heitbrock and Hofer Front Immunol 2013) revealed a slight but significant increase of intermediate monocyte absolute counts (Figure 4B). Nei-ther platelet counts nor platelet–leukocyte aggregates were affected by CMR (data not shown).
Blood Cell Activation
We conducted flow cytometric analysis of cell surface acti-vation markers (Table 2). We found that CMR increased the expression levels of the monocytic CD163 marker 1 and 2 hours after the examination, which persisted after 1 month (Figure 4A). The levels of neutrophil and monocyte Mac-1 integrin in its active conformation were augmented after 2 days on CMR (Figure 4A and 4B). We did not find any evi-dence of lymphocyte activation, based on CD62L cell surface expression. Absolute counts of regulatory T cells were not modified either. Platelets were only slightly activated after 2 days, as assessed by P-selectin exposure on platelet surface (Figure 4C). However, the ability of platelets to bind fibrino-gen never exceeded pre-CMR basal levels.
Discussion
The main finding of this present study is that 1.5T CMR induces DNA double-strand breaks (increased γ-H2AX inten-sity) in T lymphocytes and in NK cells, in the absence of any contrast agent. In these conditions: (1) blood cell count changes were the initial (1–2 hours) responses, consisting in early transient drop of NK and NKT cells along with slight rises in neutrophils and B cells, meanwhile neutrophils and
monocytes displayed moderate and transient activation marker expression; (2) the increase in γ-H2AX intensity in T lymphocytes was detectable only 2 days after CMR and persisted after 1 month but not at 1-year follow-up; (3) the different T lymphocyte subsets exhibited equal sensitivity to CMR-induced DNA damage; (4) the levels of DNA damage were low and did not result in T-lymphocyte apoptosis or lym-phocyte activation.
CMR Scanning and DNA Damage of Circulating Lymphocytes
Our results confirmed and extended previous results showing an increase in DNA double-strand breaks (increased γ-H2AX foci/levels or micronuclei) in circulating T lymphocytes after standard CMR exposure.11–14 We showed that γ-H2AX
inten-sity in NK cells could be a more sensitive marker than T lymphocytes to evaluate early CMR-induced DNA damage. We also reported, for the first time, the dynamic evolution of DNA damage over long-time periods (≤1 month). Fiechter et al.11 showed significant DNA damage in patient T
lympho-cytes as soon as 1 or 2 hours post contrast enhanced CMR.
Table 3. Serial Measurements of γ-H2AX Intensity in Blood Lymphocyte Subsets Before and After CMR
γ-H2AX (Median Intensity of Fluorescence;
mean±SD [95% CI]) Pre-CMR (n=20) 1 H (n=20) 2 H (n=20) 2 D (n=19) 1 Mo (n=15) 1 Y (n=12) T Lymphocytes (CD3+) 238.4±88.2 [194.6–282.3] 274.6±113.8 [219.7–329.4] P=0.48 282.0±155.2 [207.2–356.8] P=0.31 396.9±214.5* [286.7–507.2] P=0.019 529.1±424.1* [294.2–763.9] P=0.021 250.1±129.4 [167.9–332.3] P=0.97 CD4+ Th cells 218.8±87.4 [145.8–291.9] 242.5±79.7 [181.3–303.7] P=0.84 246.7±91.7 [176.2–317.2] P=0.38 423.6±272.7* [171.4–675.8] P=0.047 423.1±210.6 [87.96–758.2] P=0.12 … CD8+ Tc cells 236±81.8 [167.6–304.4] 248.1±82.9 [184.4–311.8] P=0.74 249.9±92.5 [178.8–321] P=0.84 496.1±392.9 [132.7–859.4] P=0.08 463.9±203.6 [211–716.7] P=0.06 … CD4+CD8mid 338.8±123.3 [224.7–452.8] 432.7±136.4 (327.8–537.5] P=0.22 383.2±108.3 (299.9–466.5] P=0.3 549.2±359.9 (171.5–926.9] P=0.44 557.9±230.1 (272.2–843.7] P=0.25 … CD4midCD8+ 296.9±108 (206.6–387.1] 381.1±184 (239.6–522.6] P=0.64 342±125.2 (245.7–438.2] P=0.31 478.2±276.5 (188– 768.4] P=0.16 568.5±243 (266.8–870.1] P=0.06 … NKT cells 263.2±95.5 [183.4–343] 300.1±99.2 [223.9–376.3] P=0.95 297.5±108.2 [214.4–380.7] P=0.15 507.6±340.4* [192.8–822.4] P=0.047 593.4±309.2 [209.5–977.3] P=0.06 … NK cells 297.6±131.3 [187.8–407.3] 356.5±148.2 [242.7–470.4] P=0.38 382.9±177.3* [246.6–519.2] P=0.039 650.4±587.1* [107.4–1193] P=0.047 582.2±272.6 [243.7–920.6] P=0.06 … CI indicates confidence interval; CMR, cardiac magnetic resonance; and NK cells, natural killer cells.
*Significantly different when compared with pre-CMR values.
Figure 2. Significant correlation between specific absorption
rates and increases of γ-H2AX intensity in CD3+ lymphocytes at 1-month post cardiac magnetic resonance.
By keeping lymphocytes from 8 healthy subjects in culture for ≤120 hours, Simi et al12 reported that such DNA changes
are dose-dependent and quickly returned to normal within 48 hours, suggesting a transient effect when the exposure was within diagnostic range of energy absorption. The timeframe and lasting effects of low-frequency electromagnetic fields on DNA depend on several factors, such as the cell type, the
efficacy of DNA repair (consistent with H2AX dephosphor-ylation), the mode of exposure, the type of magnetic waves (static magnetic field, radiofrequency pulses, and gradient magnetic fields), the intensity and duration of exposure, and the use of contrast agent.15–21
During CMR, all these factors can contribute at differ-ent degrees to DNA damage. Iron-mediated reactive oxygen
Figure 3. Flow cytometric analysis of DNA double-strand breaks in peripheral T-lymphocyte subsets and natural killer (NK) cells before
and 1 hour, 2 hours, 2 days, and 1 month after cardiac magnetic resonance (CMR). A, Representative dot plots showing the gating
strat-egy used to differentiate T-lymphocytes subset based on side scattered light (SSC), forward scattered light (FSC), and on anti-CD3, CD4, and CD8 antibodies. B, γ-H2AX median fluorescence of intensity in CD4+ T-helper cells, CD8+ T-cytotoxic cells, CD4+CD8mid and in
CD8+CD4mid cells. Data represent the mean±SD (*P<0.05). C, γ-H2AX intensity analyzed in NK and NKT cells. Representative dot plots
showing the gating strategy used to differentiate CD56high- and CD56mid-NK cells and CD3+CD56+ NKT cells (left). Data representing
the mean±SD (*P<0.05) are shown (right). MFI indicates median fluorescence intensity.
Table 4. Serial Measurements of Early Apoptosis in Blood T Lymphocytes Before and After CMR
Annexin V+ (%; mean±SD [95% CI]) Pre-CMR (n=20) 1 H (n=20) 2 H (n=20) 2 D (n=19) 1 Mo (n=15) CD4+ Th cells 1.011±0.58 [0.73–1.29] 1.08±0.73 [0.73–1.43] P=0.95 1.06±0.66 [0.74–1.38] P=0.86 0.99±0.61 [0.69–1.28] P=0.43 0.91±0.44 [0.68–1.15] P=0.84 CD8+ Tc cells 1.89±1.33 [1.25–2.53] 2.23±1.84 [1.34–3.11] P=0.54 1.91±1.48 [1.2–2.62] P=0.93 1.63±1.14 [1.075–2.18] P=0.21 1.83±1.3 [1.16–2.5] P=0.77 CI indicates confidence interval; and CMR, cardiac magnetic resonance.
species might be involved in CMR-induced DNA lesions.22,23
In the study of Fiechter et al,11 the potentially higher absorbed
energy and the concomitant use of gadolinium could partici-pate and potentiate the early onset of DNA strand breaks.11
The dose-dependent genotoxic effect of gadolinium admin-istration during CMR scanning has been recently high-lighted in a few in vitro studies.20 So it could be that the
joint administration of the contrast agent would accelerate the DNA damage processes. We extend the data of Fiechter et al11 by showing that CMR is able to induce DNA lesion
by itself, at similar level when analyses are performed after 2 days (2-fold increase in γ-H2AX intensity as in Fiechter et al’s11 study).
The persistence of induced DNA damage is a key issue when assessing residual genotoxic risk.23–25 It depends on the
efficacy of DNA repair, which relates to the amount of DNA breaks.26 This might explain the important interindividual
variation in the time course of γ-H2AX decline after CMR. In our study, unexpectedly, the level of γ-H2AX continued to increase in half of our subjects 1 month after CMR examina-tion. These findings are compatible with the fact that most of the lymphocytes reside in the thymus, lymph nodes, ton-sils, intestine, spleen, and bone marrow, whereas only 2% are present in the peripheral blood. Knowing that 80% of all lym-phocytes migrate between tissues and the peripheral blood, with an overall recirculation time of ≈12 hours, we assume that blood samples taken >12 hours after CMR will reflect its average effect on whole lymphocyte pool. It is thus likely that
CMR causes more DNA damage in tissue lymphocytes than in blood cells, what we actually measure when we analyze blood lymphocytes after 2 days. The persistence of elevated γ-H2AX levels in blood lymphocytes 1 month after CMR may thus represent unrepaired DNA breaks or delayed mobi-lization of lymphocyte pools from other tissues. Interestingly, a return to basal γ-H2AX intensity levels was observed in all cases examined back at 1-year post CMR examination, sug-gesting complete DNA repair and the absence of persisting deleterious DNA damage.
CMR and Blood Cell Counts/Activation
Hitherto, no studies have reported the in vivo effects of CMR on the broad spectrum of human white blood cells and plate-lets. Intriguingly, after CMR examination, we noticed a slight quickly reversible drop of NK and NKT cell numbers and a mild elevation of lymphocyte B cells. Interestingly, CMR did not induce apoptosis of blood T lymphocytes, which is in agreement with the weak induction of γ-H2AX in these cells. Indeed, apoptosis only seems to occur when cellular γ-H2AX levels reach specific threshold values.16,17,19 Other
intracellular abnormalities have been shown to occur during static magnetic fields with changes in erythrocyte membrane permeability, membrane elasticity, and erythrocyte sedimen-tation rate.15,21
Neutrophils and monocytes displayed transient expres-sion of activation markers. These findings that CMR elic-its a slight inflammatory response suggest that magnetic
Table 5. Serial Blood Cell Counts Before and After CMR
Blood Cell Counts (Cells/μL; mean±SD [95% CI]) Pre-CMR (n=20) 1 H (n=20) 2 H (n=20) 2 D (n=19) 1 Mo (n=15) Total lymphocytes 1994±615.6 [1697–2291] 1846±562.7* [1575–2117] P=0.045 1948±505.3 [1705–2192] P=0.636 1903±526.1 [1649–2156] P=0.31 2014±555.4 [1729–2300] P=0.806 CD4+ Th cells 823.2±298.8 [679.2–967.2] 770.9±271.3 [640.2–901.7] P=0.072 826.8±266.1 [698.6–955.1] P=0.912 801.3±281.9 [665.5–937.2] P=0.382 809.6±231.5 [690.5–928.6] P=0.804 CD8+ Tc cells 574.5±243.6 [457.1–691.9] 543.4±240 [427.7–659] P=0.119 552.1±213.4 [449.2–655] P=0.36 517.8±177.8 [432.1–603.5] P=0.202 564.6±210.1 [456.6–672.6] P=0.627 Treg cells 55.6±25.6 [43.3–67.9] 51.2±22 [40.6–61.8] P=0.101 52.1±20.8 [42.1–62.1] P=0.553 56.1±25.1 [43.9–68.2] P=0.58 54.4±19.2 [44.5–64.2] P=0.878 NKT cells 86±43.8 [62.6–109.4] 72.6±31.3* [55.9–89.3] P=0.024 74.2±29.9 [58.3–90.2] P=0.22 79.9±43.6 [56.6–103.1] P=0.846 85.1±51.3 [55.5–114.7] P=1.0 NK cells 274.6±114.2 [219.6–329.7] 214.2±89.9* [170.8–257.5] P=0.002 215.9±99.3* [168–263.7] P=0.0045 262.5±109.6 [209.7–315.4] P=0.665 307.5±181.2 [214.4–400.7] P=0.662 B lymphocytes 204±72.3 [169.1–238.9] 198.6±60.9 [169.2–227.9] P=0.992 228.4±70.1* [194.7–262.2] P=0.0292 196.7±67.9 [163.9–229.4] P=0.786 199.2±70.5 [163–235.5] P=0.485 Neutrophils 3119±1002 [2636–3602] 3074±999.6 [2592–3555] P=0.52 3363±1042* [2860–3865] P=0.014 3434±1436 [2742–4126] P=0.247 3415±1268 [2763–4067] P=0.4 Total monocytes 463.2±130.3 [400.3–526] 467.9±142.4 [399.2–536.5] P=0.97 501.6±177.2 [416.2–587] P=0.26 450±139.8 [382.6–517.4] P=0.86 488.8±140.6 [416.5–561.1] P=0.44 Classical monocytes 320.9±93.6 [275.7–366] 320.8±123.3 [261.4–380.2] P=0.55 341.2±149.1 [269.4–413.1] P=0.55 302.3±104.4 [252–352.7] P=0.28 292.1±98.6 [241.4–342.8] P=0.25 Intermediate monocytes 41.1±23 [29.7–52.6] 48±24 [36–59.9] P=0.29 47.2±29.9 [32.3–62] P=0.5 50.6±31.1 [35.6–65.6] P=0.08 55.9±35.1* [37.8–73.9] P=0.014 Nonclassical monocytes 69.1±46.9 [46.5–91.8] 65.3±52 [40.3–90.4] P=0.32 65.7±47.5 [41.8–95.1] P=0.75 68.4±55.2 [41.8–95.1] P=0.47 86.6±52.4 [59.6–113.5] P=0.087 CI indicates confidence interval; CMR, cardiac magnetic resonance; and NK cells, natural killer cells.
fields can affect immune cell function. Accordingly, it has been reported that exposure of mouse macrophages to 25 to 150 mT static magnetic fields altered their phagocytic capacity; likewise, mitogenic responses of spleen lympho-cytes were decreased.14 Further studies are thus required to
address the impact of CMR in immune-related pathologi-cal conditions.
Clinical Implications
CMR has largely been considered a safe technology. However, a body of evidence is swiftly accumulating showing similar risk of DNA damage, which could represent a serious health hazard for patients because their persistence can potentially be carcinogenic.27 The dynamic increase in γ-H2AX
inten-sity over the first month of follow-up in half of our cases can reflect (1) the nontransient nature of these anomalies, (2) individual tissue/cell vulnerabilities to magnetic field, (3) variable DNA repair capacities, and (4) delayed recirculation of injured T lymphocyte pools. These temporal changes are not predicted by the γ-H2AX intensity in the early phases post CMR, suggesting that testing DNA damage soon after scanning does not reflect the magnitude of the phenomenon. Our findings, however, also support the conclusion of limited
harmfulness of the DNA damage after CMR. Indeed, the low level of DNA lesions (absolute amount) is insufficient to pro-duce long-term genetic instability, cell death, lymphocyte activation or persistent changes in blood lymphocyte subset proportions. Although the little effect on neutrophil and the absence of platelet activation is also reassuring, the mean-ing of the increase in pathological intermediate monocytes at 1-month follow-up remains unclear. Moreover, whether a cumulative DNA injury effect may be caused by repeating CMR examinations is currently unknown. Therefore, until a more exhaustive monitoring of the potential risk of diagnostic CMR is available, our data could suggest restricting CMR rep-etition during the months after a first examination. Of course, similar caution and restrictions already apply to the use of car-diac x-ray–based and nuclear imaging techniques.
Limitations
Our data pertain only to CMR and cannot be extrapolated to other MRI examination, that is, different field strength (1.5T, 3T, and 7T) and protocols (contrast administration and duration of exposure). Although similar effects on cir-culating blood cells could be expected, the changes reported here could be dependent on the strength of the magnetic field
Figure 4. Flow cytometric analysis of cell surface activation markers on monocytes (A), neutrophils (B), and platelets (C) after cardiac
and the energy absorbed. Also, the impact of MRI, if any, on other tissues, such as the brain and abdominal organs can-not be extrapolated from our data. Because of evident ethi-cal reasons, no attempt was made to compare the effects of different imaging approaches in our population. However, this information would be crucial to identify the cumula-tive effects on DNA damage (genetic instability) secondary to these imaging techniques. Such an analysis is more suit-able in an animal model. The extent of DNA repair might have been underestimated because only 12 subjects had a 1-year blood control. However, γ-H2AX returned to baseline levels in all. Although we proved the association between CMR and DNA damage, with only 20 subjects and 1-year follow-up, our study cannot answer the question as to know whether CMR-induced DNA damage would be associated with cancer risk. The cellular damage induced by CMR was quantified by assessing the amounts of DNA double-strand breaks in T lymphocytes and NK cells through flow cyto-metric analysis of histone H2AX phosphorylation levels in whole blood samples. Because of its simplicity, this method can easily be available in clinical laboratories. However, it is known that the flow cytometry method is less sensitive compared with counting γ-H2AX foci in single cells by immunofluorescence microscopy. This could have led to an underestimation of the extent of early post-CMR DNA dam-age. We show that measuring γ-H2AX intensity in NK cells could be more sensitive than in T lymphocytes. However, the short half-life of these cells (≈2 weeks) do not allow the assessment of persistent DNA damage over time, in contrast to the long-lived T lymphocytes.28 Because of the potential
impacts of aging on the susceptibility of lymphocytes DNA damage and repair, our results might not be translated to older subjects.29,30 Despite our data support our conclusions,
we acknowledge that a concurrently studied control group of similar size as our study population with blinded blood samples being processed in the same analysis set could have strengthened our findings further by eliminating any pos-sible methodological issues. Finally, from a statistical point of view, the slight changes in blood cell counts or activation markers should be viewed with caution. Because a lot of sta-tistical testing has been done on a relatively small sample of subjects, the P values were indeed not adjusted for multiple comparisons.
Conclusions
Our study proved the association between CMR scanning and DNA double-strand breaks in T lymphocytes independently of contrast administration. Such DNA damage appeared to evolve during the first month of examination, but completely disappeared at 1-year follow-up. They are not associated with T-lymphocytes apoptosi or activation. Early responses to CMR slightly affect other blood cells, but transiently. Despite clear benefit of CMR for diagnosis of cardiovascular diseases and patient outcome improvement, our findings may call for caution when it comes to repeat CMR examination within a month. This warning could be even more important when using intravenous contrast agents. We can, however, not make any firm statement yet, and therefore, there is an urgent need for more in depth studies on safety.
Acknowledgments
We thank the GIGA-imaging core facility and magnetic resonance imaging and computed tomography unit personnel of the medical imaging department of the Liège University Hospital, for their as-sistance and technical help.
Sources of Funding
This work was supported by the Belgian National Fund for Scientific Research (F.R.S.-FNRS: FNRS-FRSM 3.4611.11), the University Hospital of Liège (CHU, Fonds d’Investissement pour la Recherche Scientifique). C. Delierneux holds an FRIA fellowship. C. Oury is FRS-FNRS Research Associate.
Disclosures
None.References
1. Lancellotti P, Plonska-Gosciniak E, Madalina G, Bucciarelli-Ducci C, Cosyns B, Cardim N, Galderisi M, Edvardsen T, Neglia D, Plein S, Kitsiou A, Nieman K, Stefanidis A, Maurer G, Bogdan PA, Habib G. Cardiovascular imaging practice in europe. A report from the european association of cardiovascular imaging. Eur Heart J Cardiovasc Imaging. 2015; 16:697–702. doi: 10.1093/ehjci/jev116.
2. Lancellotti P, Habib G, Negila D, Plein S. Cardiovascular imaging. Eur
Heart J. 2014;35:1161–1162. doi: 10.1093/eurheartj/ehu128.
3. Petersen SE, Almeida AG, Alpendurada F, Boubertakh R, Bucciarelli-Ducci C, Cosyns B, Stefanidis AS, Tann O, Westwood M, Plein S; ; Education Committee of European Association of Cardiovascular Imaging Association (EACVI). Update of the European Association of Cardiovascular Imaging (EACVI) Core Syllabus for the European Cardiovascular Magnetic Resonance Certification Exam. Eur Heart J
Cardiovasc Imaging. 2014; 15:728–729. doi: 10.1093/ehjci/jeu076. 4. Nagel E, Narula J. Evolution and revolution in CMR imaging. JACC
Cardiovasc Imaging. 2013;6:837–838. doi: 10.1016/j.jcmg.2013.05.007. 5. Ozsahin M, Crompton NE, Gourgou S, Kramar A, Li L, Shi Y, Sozzi WJ,
Zouhair A, Mirimanoff RO, Azria D. CD4 and CD8 T-lymphocyte apopto-sis can predict radiation-induced late toxicity: a prospective study in 399 patients. Clin Cancer Res. 2005;11:7426–7433. doi: 10.1158/1078-0432. CCR-04-2634.
6. Berrington de González A, Darby S. Risk of cancer from diagnos-tic X-rays: estimates for the UK and 14 other countries. Lancet. 2004; 363:345–351.
7. Löbrich M, Rief N, Kühne M, Heckmann M, Fleckenstein J, Rübe C, Uder M. In vivo formation and repair of DNA double-strand breaks af-ter computed tomography examinations. Proc Natl Acad Sci U S A. 2005;102:8984–8989. doi: 10.1073/pnas.0501895102.
8. Kuefner MA, Grudzenski S, Schwab SA, Wiederseiner M, Heckmann M, Bautz W, Lobrich M, Uder M. DNA double-strand breaks and their repair in blood lymphocytes of patients undergoing angio-graphic procedures. Invest Radiol. 2009;44:440–446. doi: 10.1097/ RLI.0b013e3181a654a5.
9. Knuuti J, Saraste A, Kallio M, Minn H. Is cardiac magnetic resonance imaging causing DNA damage? Eur Heart J. 2013;34:2337–2339. doi: 10.1093/eurheartj/eht214.
10. Phillips JL, Singh NP, Lai H. Electromagnetic fields and DNA damage.
Pathophysiology. 2009;16:79–88. doi: 10.1016/j.pathophys.2008.11.005. 11. Fiechter M, Stehli J, Fuchs TA, Dougoud S, Gaemperli O, Kaufmann PA.
Impact of cardiac magnetic resonance imaging on human lymphocyte DNA integrity. Eur Heart J. 2013;34:2340–2345. doi: 10.1093/eurheartj/eht184. 12. Simi S, Ballardin M, Casella M, De Marchi D, Hartwig V, Giovannetti
G, Vanello N, Gabbriellini S, Landini L, Lombardi M. Is the genotoxic effect of magnetic resonance negligible? Low persistence of micronucleus frequency in lymphocytes of individuals after cardiac scan. Mutat Res. 2008;645:39–43. doi: 10.1016/j.mrfmmm.2008.08.011.
13. Lee JW, Kim MS, Kim YJ, Choi YJ, Lee Y, Chung HW. Genotoxic ef-fects of 3 T magnetic resonance imaging in cultured human lymphocytes.
Bioelectromagnetics. 2011;32:535–542. doi: 10.1002/bem.20664. 14. Flipo D, Fournier M, Benquet C, Roux P, Le Boulaire C, Pinsky C, LaBella
FS, Krzystyniak K. Increased apoptosis, changes in intracellular Ca2+, and functional alterations in lymphocytes and macrophages after in vitro expo-sure to static magnetic field. J Toxicol Environ Health A. 1998;54:63–76.
15. Ali MA. Magnetic resonance imaging and associated alteration in some biophysical properties of blood. Rom J Biophys. 2007;17:277–286. 16. Schwenzer NF, Bantleon R, Maurer B, Kehlbach R, Schraml C, Claussen
CD, Rodegerdts E. Detection of DNA double-strand breaks using gam-maH2AX after MRI exposure at 3 Tesla: an in vitro study. J Magn Reson
Imaging. 2007;26:1308–1314. doi: 10.1002/jmri.21138.
17. Xu S, Chen G, Chen C, Sun C, Zhang D, Murbach M, Kuster N, Zeng Q, Xu Z. Cell type-dependent induction of DNA damage by 1800 MHz radio-frequency electromagnetic fields does not result in significant cellular dys-functions. PLoS One. 2013;8:e54906. doi: 10.1371/journal.pone.0054906. 18. Teodori L, Grabarek J, Smolewski P, Ghibelli L, Bergamaschi A, De
Nicola M, Darzynkiewicz Z.. Exposure of cells to static magnetic field accelerates loss of integrity of plasma membrane during apoptosis.
Cytometry. 2002; 49:113–118. doi: 10.1002/cyto.10160.
19. Ahmadianpour MR, Abdolmaleki P, Mowla SJ, Hosseinkhani S. Static magnetic field of 6 mT induces apoptosis and alters cell cycle in p53 mutant Jurkat cells. Electromagn Biol Med. 2013;32:9–19. doi: 10.3109/15368378.2012.692748.
20. Cho S, Lee Y, Lee S, Choi YJ, Chung HW. Enhanced cytotoxic and genotoxic effects of gadolinium following ELF-EMF irradiation in human lymphocytes. Drug Chem Toxicol. 2014;37:440–447. doi: 10.3109/01480545.2013.879662.
21. Myakoshi J, Effects of a static magnetic field at the cellular level. Prog
Biophys Mol Biol. 2005; 87:213–23.
22. Wiseman H, Halliwell B. Damage to DNA by reactive oxygen and ni-trogen species: role in inflammatory disease and progression to cancer.
Biochem J. 1996;313 (pt 1):17–29.
23. Ghodbane S, Lahbib A, Sakly M, Abdelmelek H. Bioeffects of static mag-netic fields: oxidative stress, genotoxic effects, and cancer studies. Biomed
Res Int. 2013;2013:602987. doi: 10.1155/2013/602987.
24. Khanna KK, Jackson SP. DNA double-strand breaks: signaling, re-pair and the cancer connection. Nat Genet. 2001;27:247–254. doi: 10.1038/85798.
25. Mills KD, Ferguson DO, Alt FW. The role of DNA breaks in genomic instability and tumorigenesis. Immunol Rev. 2003;194:77–95.
26. Muslimovic A, Ismail IH, Gao Y, Hammarsten O. An optimized method for measurement of gamma-H2AX in blood mononuclear and cultured cells. Nat Protoc. 2008;3:1187–1193. doi: 10.1038/nprot.2008.93. 27. Bonassi S, Znaor A, Ceppi M, Lando C, Chang WP, Holland N,
Kirsch-Volders M, Zeiger E, Ban S, Barale R, Bigatti MP, Bolognesi C, Cebulska-Wasilewska A, Fabianova E, Fucic A, Hagmar L, Joksic G, Martelli A, Migliore L, Mirkova E, Scarfi MR, Zijno A, Norppa H, Fenech M. An increased micronucleus frequency in peripheral blood lymphocytes pre-dicts the risk of cancer in humans. Carcinogenesis. 2007;28:625–631. doi: 10.1093/carcin/bgl177.
28. Ziegler-Heitbrock L, Hofer TP. Toward a refined definition of monocyte subsets. Front Immunol. 2013;4:23. doi: 10.3389/fimmu.2013.00023. 29. Dorshkind K, Montecino-Rodriguez E, Signer RA. The ageing immune
system: is it ever too old to become young again? Nat Rev Immunol. 2009;9:57–62. doi: 10.1038/nri2471.
30. Scarpaci S, Frasca D, Barattini P, Guidi L, Doria G. DNA damage rec-ognition and repair capacities in human naïve and memory T cells from peripheral blood of young and elderly subjects. Mech Ageing Dev. 2003;124:517–524.
CLINICAL PERSPECTIVE
Cardiac magnetic resonance (CMR) has largely been considered a safe technology. However, a body of evidence is swiftly accumulating showing risk of DNA damage, which could represent a serious health hazard for patients because their per-sistence can potentially be carcinogenic. Our study proved the association between CMR scanning and DNA double-strand breaks in T lymphocytes independently of contrast administration. Such DNA damage appeared to evolve during the first month after examination, but completely disappeared at 1-year follow-up. These temporal changes are not predicted by the γ-H2AX intensity measured during the first hours post-CMR, indicating that testing DNA damage soon after scanning does not reflect the magnitude of the phenomenon. CMR-induced DNA damage is also not associated with T-lymphocytes apoptosis or activation. Early responses to CMR slightly affect blood cell count and their activation, but transiently. Despite clear benefit of CMR for diagnosis of cardiovascular diseases and patient outcome improvement, our findings may call for caution when it comes to repeat CMR examination within a month. This warning could be even more important when using intravenous contrast agents. Of course, similar caution and restrictions already apply to the use of cardiac x-ray–based and nuclear imaging techniques. We can, however, not make any firm statement yet, and therefore, there is an urgent need for more in depth studies on safety.
SUPPLEMENTAL MATERIAL
Supplemental Figure. Assessment of time-dependent variation of the amount of DNA
double strand breaks in blood T lymphocytes (CD3+) from five healthy individuals (flow
cytometry analysis of
-H2AX median fluorescence of intensity). Individual values are
connected with a line.
Gothot, Luaba Jean-Flory Tshibanda and Cécile Oury
Print ISSN: 1941-9651. Online ISSN: 1942-0080
Copyright © 2015 American Heart Association, Inc. All rights reserved. Dallas, TX 75231
is published by the American Heart Association, 7272 Greenville Avenue,
Circulation: Cardiovascular Imaging
doi: 10.1161/CIRCIMAGING.115.003697
2015;8:
Circ Cardiovasc Imaging.
http://circimaging.ahajournals.org/content/8/9/e003697
World Wide Web at:
The online version of this article, along with updated information and services, is located on the
http://circimaging.ahajournals.org/content/suppl/2015/09/03/CIRCIMAGING.115.003697.DC1.html
Data Supplement (unedited) at:
http://circimaging.ahajournals.org//subscriptions/
is online at:
Circulation: Cardiovascular Imaging
Information about subscribing to
Subscriptions:
http://www.lww.com/reprints
Information about reprints can be found online at:
Reprints:
document.
Permissions and Rights Question and Answer
information about this process is available in the
requested is located, click Request Permissions in the middle column of the Web page under Services. Further Center, not the Editorial Office. Once the online version of the published article for which permission is being
can be obtained via RightsLink, a service of the Copyright Clearance
Circulation: Cardiovascular Imaging
in
Requests for permissions to reproduce figures, tables, or portions of articles originally published
![Table 4. Serial Measurements of Early Apoptosis in Blood T Lymphocytes Before and After CMR Annexin V+ (%; mean±SD [95% CI]) Pre-CMR (n=20) 1 H (n=20) 2 H (n=20) 2 D (n=19) 1 Mo (n=15) CD4+ Th cells 1.011±0.58 [0.73–1.29] 1.08±0.73 [0.73–1.43] P=0.95 1.](https://thumb-eu.123doks.com/thumbv2/123doknet/5966590.147795/5.877.80.798.99.691/table-serial-measurements-early-apoptosis-blood-lymphocytes-annexin.webp)
