ABSTRACT:
The base hypothesis for the assessment of fire resistance of timber structures by simple calculation models is that for temperatures above 300 ºC, timber is no longer able to sustain any load. Consequently, the determination of the location of the 300 ºC isotherm, the charring depth, is decisive for the result of fire resistance calculation methods. Charring rate of timber is dependent of numerous factors, such as wood species (density, permeability or composition), moisture or direction of burning (along or across the grain).
Eurocode 5, Part 1-2, presents several methods for the calculation of fire resistance of timber structures that are divided into simplified and advanced. In this paper simplified and advanced methods are compared regarding the
calculation of the charring depth and residual cross section strength. Finite element simulations have been performed, employing the proposed timber properties of Eurocode 5 using finite element code SAFIR. The influence of parameters such as timber density and moisture has been investigated. The results obtained with finite element calculations were then compared with Eurocode 5 simplified models. Some inconsistencies between methods have been observed. This paper presents some proposals to overcome some of the inconsistencies as well as to extend the applicability of the models.
1. INTRODUCTION
Fire resistance of wooden members or structures is strongly dependent of the rate at which wood burns. Therefore, codes of practice such as Eurocode 5 Part 1-2 [1], named in this paper as EC5, specify models for the calculation of the amount of charred timber after a certain period of time.
Charred timber is bounded by the transition between the pyrolysis layer, the zone where thermal degradation of timber and char formation are actually occurring, and the char layer, a zone of cracked charcoal that has no relevant strength or stiffness properties. This transition is usually considered to be located at the 300 ºC isotherm, named the char-line. Charring depth is the distance between the outer surface of the original member and the position of the char-line. The speed at which charring depth advances in the material is called the charring rate and is an essential parameter for fire resistance of wooden structures because it allows
the determination of the size of the residual section of timber. Charring rate of timber is dependent of numerous factors, such as wood species, density, moisture, permeability, composition, or direction of burning (along or across the grain). However, only some of these factors can be actually considered in practical applications.
EC5 allows the use of simplified and advanced methods for the calculation of the amount of charred timber. Simplified methods use the charring rate model that is based on the fact that, despite of the evolution of charring depth with time is non-linear, in practice, due to its limited non-linearity, it can be considered as linear. This means that the charring rate can be considered independent of time. Cross section strength is then calculated assuming that the properties of the remaining timber remained similar to room temperature properties.
Advanced methods, use more sophisticated analysis and design procedures that supposedly lead to more accurate predictions of the fire behavior of structures. The method proposed in EC5 for the determination of distribution of temperature within structural sections is a conductive model based on thermal properties of timber . Following the thermal calculation, a structural calculation is then performed taking into account the progressive degradation of mechanical properties of timber from 20 to 300°C for the calculation of the cross section strength.
The present work investigates the influence of moisture content and density on the charring rate calculated using the charring rate and the conductive models of EC5. In addition, a comparison of the residual cross section strength calculated using simplified rules and advanced methods is also carried out. Some proposals for improving the consistency between the different models of EC5 are also presented. The study was carried out based on numerical finite element
simulations using the finite element code SAFIR [2], which is a special purpose finite element code, developed at University of Liege for studying structures subjected to fire.
2. EUROCODE 5 MODELS FOR CHARRING RATE AND THERMAL ANALYSIS
For the calculation of thermal fields within structural elements, EC5 allows the use of a conductive model based on the resolution of two- or three-dimensional, transient, heat transfer differential equations, incorporating thermal properties that vary with temperature. However, effects such as mass transfer within the elements or structure, reaction energy released inside the timber due to pyrolysis or
degradation of material, cracking of charcoal, which increases the heat transfer in the char layer, are not explicitly accounted for. EC5 presents conductivity values for the char layer that are apparent in order to take into account increased heat transfer due to shrinkage cracks above about 500 °C that increase heat transfer due to convection and radiation. In addition, specific heat capacity values include the energy necessary to evaporate the water, which explains the presence of the peak between 99 and 120 °C.
Charring rate models use the charring rate concept to calculate the residual section of a wooden cross-section after a certain exposure to fire. EC5 allows the use of two different charring rates: the one-dimensional design charring rate under standard fire exposure, β0, and the notional charring rate, βn. When using the one-dimensional charring rate, calculation of cross-sectional properties should be based on the actual charring depth including corner roundings. The use of the notional charring rate allows consideration of rectangular residual cross sections. For charring rate comparisons, the one-dimensional charring, β0, rate will be considered in the current work and compared with the conductive model because this eliminates unnecessary complications linked to geometrical considerations and allows concentrating purely on the thermal models.
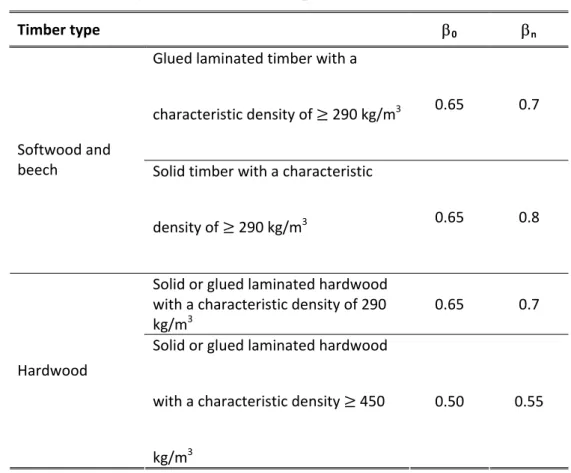
The charring rate values given in EC5 for softwoods and hardwoods are presented in Table 1. Charring rate values presented in EC5 are independent of density for softwoods with densities above 290 kg/m3 and for hardwoods with densities above 450 kg/m3. For hardwoods the charring rate varies linearly for densities between 290 and 450 kg/m3.
Table 1. Charring rate of timber for simple models of EC5. Timber type β0 βn Glued laminated timber with a characteristic density of 290 kg/m3 0.65 0.7 Softwood and beech Solid timber with a characteristic density of 290 kg/m3 0.65 0.8 Solid or glued laminated hardwood with a characteristic density of 290 kg/m3 0.65 0.7 Hardwood Solid or glued laminated hardwood with a characteristic density 450 kg/m3 0.50 0.55
3. CHARRING RATE CALCULATION
3.1. Influence of density
The charring rate changes with timber density as it has been demonstrated by several authors [3-6]. However, this dependence is only marginally considered in the charring rate models of EC5 as shown in Table 1.
The values of Table 1 have been compared with values obtained by the
conductive model. This model does not make any difference between hardwood and softwood, but density is taken into account.
For calculations of charring depth using the conductive model, the coefficient of heat transfer by convection was considered as 9 W/m2K on unexposed surfaces and 25 W/m2K on surfaces heated with the standard time-temperature curve, according to Eurocode 1, Part 1-2 [8]. The surface emissivity of timber was taken as 0.8. Thermal conductivity, specific heat capacity and density ratio were used with values defined in EC5. Moisture content of timber, w, was considered equal to 0.12. Densities of 200, 290, 450, 600, 800 and 1000 kg/m3 were investigated.
The curves showing the evolution of the charring depth with time present a slight convexity. The charring rate is the first derivative of the curves. Because of the nearly linear character of the curves, average charring rates were calculated for 30 and 60 minutes (taken as the secant value from the origin). From here, the secant charring rate used for comparison purposes is the secant charring rate at 60 minutes. Using this procedure, the values of charring rate were calculated and presented in Table 2. It is apparent that significant differences exist for different densities.
Table 2. Charring rates calculated with the EC5 conductive model (mm/min). Density [kg/m3]
200 290 450 600 800 1000 Charring rates at 60 min 1.032 0.876 0.682 0.600 0.512 0.461
Comparison of calculated charring rate values with EC5 charring rate model for softwoods shows good agreement for densities around 450 kg/m3. For smaller densities the EC5 conductive model shows bigger charring rates. For hardwoods the results of charring rate model and conductive model are in agreement for densities around 800 kg/m3.
The potential regression curve that fits to the results of the conductive model presented in Table 2 reads:
49 . 0 12 28 . 14 − = ρ βρ (1)
with a coefficient r2 = 0.998. Numerical calculations are in agreement with the theory of heat transfer in materials with constant thermal properties that tells that the thermal propagation speed is proportional to the square root of thermal diffusivity: ρ λ β c ∝ (2)
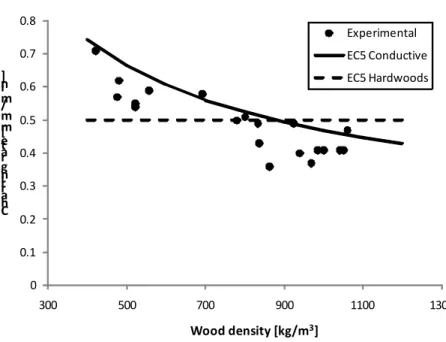
The results obtained numerically were further compared with experimental measurements performed previously at the University of Liege for tropical hardwoods and some softwoods [9]. Comparison of the conductive model with experimental data is presented in Fig. 1. This Figure shows ??? experimental results. EC5 charring rate value for hardwoods is also plotted. It can be observed that the conductive model forms an upper envelope of the experimental values.
0 0.1 0.2 0.3 0.4 0.5 0.6 0.7 0.8 300 500 700 900 1100 1300 C h a rr in g r a te [ m m /m in ] Wood density [kg/m3] Experimental EC5 Conductive EC5 Hardwoods
Fig. 1 – Relation between charring rate and timber density.
3.2. Influence of moisture
The water content of timber has an influence on the thermal behavior of timber. Heat conductivity of solid timber depends on moisture content [10-13] but the effects of changes in conductivity of timber below 300 ºC on the charring rate are not significant. Temperature in timber will remain approximately constant at about 100 ºC until all the water has been evaporated and this is the main
phenomenon whereby moisture influences the charring rate. Density of timber is also affected by the moisture content. The charring rate of timber is dependent on moisture content as was demonstrated, for example by [3-4, 14-15].
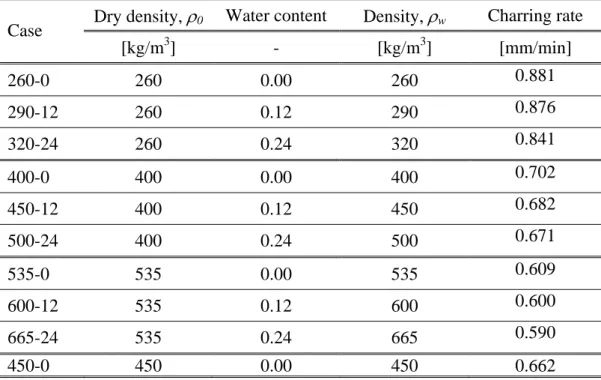
EC5 specific heat and density ratio curves were defined for service class 1, which means water content around 0.12. However, density ratio is defined in EC5 as a function of the water content, indicating that this curve could be used also for water contents different from 0.12. Using this last assumption, the charring rate was calculated with the conductive model for timber with different moisture contents. The base densities considered were 290, 450 and 600 kg/m3 with 12 % moisture. Thus, dry density of timber is 260, 400 and 535 kg/m3, respectively. Water contents were equal to 0.0, 0.12 and 0.24 (see Table 3). In addition, in order to compare two situations with the same overall density but with two different moisture contents, dry timber with dry density of 450 kg/m3 was also
considered (see Table 3). The calculated average charring rates after 60 minutes are presented in Table 3. There is no significant influence of the moisture content, which indicates that variations of the charring rate with moisture that have been reported in the literature cannot be reproduced with the conductive model proposed in EC5.
Table 3. Density, moisture content and charring rate in numerical tests with modified conductive model.
Dry density, ρ0 Water content Density, ρw Charring rate Case [kg/m3] - [kg/m3] [mm/min] 260-0 260 0.00 260 0.881 290-12 260 0.12 290 0.876 320-24 260 0.24 320 0.841 400-0 400 0.00 400 0.702 450-12 400 0.12 450 0.682 500-24 400 0.24 500 0.671 535-0 535 0.00 535 0.609 600-12 535 0.12 600 0.600 665-24 535 0.24 665 0.590 450-0 450 0.00 450 0.662
3.3. Possible model improvements
3.3.1. Influence of moisture content in the conductive model
The effect of moisture when using the conductive model can be taken into account using a modified heat capacity curve that depends of moisture. In the modified conductive model, the proposed values for specific heat capacity are based on the assumption that the heat capacity of timber with a water content w, cw, is given by equation (3) [16], in which the effect due to wood–water bond was neglected, the liquid water specific heat capacity is 4190 J/kgK and c0 represents the heat
capacity of dry timber. It was further considered that specific heat values proposed by EC5 include 12 % water. Equation (3) was then used to calculate the heat capacity of dry timber.
w w c cw + + = 1 4190 0 [J/kgK] (3)
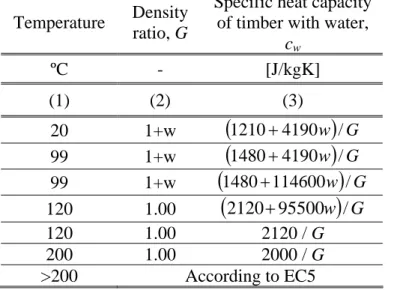
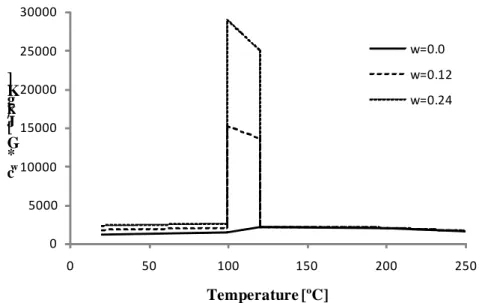
The new expression for the temperature dependent specific heat (see column 3 in Table 3), was based on the following considerations: (i) from 20 to 99°C, equation (3) is used as such, with the appropriate value for the dry timber c0; (ii) from 120°C and beyond, it is assumed that the heat capacity given by EC5 is of dry timber; and (iii) from 99 to 120°C, the term that multiplies w was adapted in order to make the contribution linked to evaporation proportional to the water content. The factor that multiplies the water content in column 3 of Table 3, for
temperatures between 99 and 120°C, can also be approximately obtained by summing, on one hand, the specific heat capacity of liquid water with, on the other hand, the energy consumed in water evaporation (2250 kJ/kg) divided by the temperature interval (21 °C). The modified specific heat curve multiplied by the density ratio for 0, 12 and 24 % moisture is presented on Fig. 2.
Table 3. Modified thermal parameters to account for the effect of water content Temperature Density
ratio, G
Specific heat capacity of timber with water,
cw ºC - [J/kgK] (1) (2) (3) 20 1+w
(
1210+4190w /)
G 99 1+w(
1480+4190w /)
G 99 1+w(
1480+114600w /)
G 120 1.00(
2120+95500w /)
G 120 1.00 2120 / G 200 1.00 2000 / G >200 According to EC50 5000 10000 15000 20000 25000 30000 0 50 100 150 200 250 cw * G [ J /k g K ] Temperature [ºC] w=0.0 w=0.12 w=0.24
Fig. 2 – Modified specific heat capacity multiplied by G for different water contents.
The influence of the water content on the charring rate of timber was recalculated for the same densities and moisture previously analyzed, now using the
conductive model with the modified properties. The relation between charring rate and moisture for all cases is shown in Fig. 3.
26 0 ‐0 29 0 ‐12 32 0 ‐24 40 0 ‐0 45 0 ‐12 50 0 ‐24 53 5 ‐0 60 0 ‐12 66 5 ‐24 0.0 0.2 0.4 0.6 0.8 1.0 1.2 0 12 24 Ch ar ra te [mm/m in ] Water content [%] 290 450 600 Density [kg/m3] Density [kg/m3] 45 0 ‐0
Fig. 3 – Relation between charring rate and water content.
The differences between the different charring rates are now much bigger: 11 to 14 % reduction of the charring rate is observed when the moisture changes from 12 to 24 %, and 22 to 26 % increase if the moisture changes from 12 to 0 %. It can also be observed that the change of the water content (from case 400-0 to 450-12)
produces a bigger variation of the charring rate than the corresponding change in density (from case 400-0 to 450-0).
A moisture normalized charring rate, βz,w, is defined here as the ratio between the charring rate at a specific water content and the charring rate at w=0.12, for the same dry timber density. The relation between the moisture normalized charring rate and the water content was obtained by regression analysis as being
5 . 1 , 1 12 . 1 ⎟ ⎠ ⎞ ⎜ ⎝ ⎛ + = w w z β (4)
With the moisture normalized charring rate, it is possible to obtain the charring rate at any water content, in the range 0 to 0.24, from the charring rate of timber with w=0.12, independently of timber density.
3.3.2. Charring rate model
The charring rate values proposed by EC5 are independent of density for
softwoods and show only a small dependence of density for hardwoods with low densities. Additionally, the charring rate values don’t show any dependence of moisture. Therefore, there is some inconsistency between the results of the charring rate model and that of the conductive model. To reduce the differences between the charring rate and the conductive models of EC5, a modified charring rate model is proposed. The proposal consists in modify the basic charring rate calculated for timber with 0.12 moisture and density of 450 kg/m3, β450,12, by multiplying it by two factors: one that depends of timber density and another that depends of moisture. The density term is derived from the results obtained from the numerical analysis. In fact, that this correction term already exists in EC5 for panels and a similar expression also existed in the pre-standard version of EC5 for softwood densities below 290 kg/m3.
For moisture, the results of the modified conductive model, see Equation (4), were used to calculate the modification factor.
The charring rate, βρ,w, for timber with moisture content, w, and density at 12% moisture, ρ, can thus be obtained from β450,12 as:
0.5 1.5 , 450,12 450 1.12 1 w w ρ β β ρ ⎛ ⎞ ⎛ ⎞ =⎜ ⎟ ⎜ ⎟ + ⎝ ⎠ ⎝ ⎠ (5)
3.3.3. Comparison of conductive and charring rate models
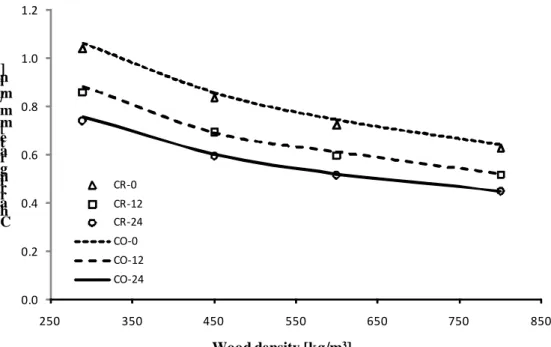
The results obtained with the possible improvement of both models are presented in Fig. 4. The evolution of the charring rate with timber density is plotted for water contents of 0, 12 and 24 %, for both the charring rate (CR) and conductive (CO) models. With suggested improvements more coherent charring rate values are obtained. Additionally, increased consistency between conductive and charring rate models is obtained.
0.0 0.2 0.4 0.6 0.8 1.0 1.2 250 350 450 550 650 750 850 C h a r r in g r a te [ m m /m in ] Wood density [kg/m3] CR‐0 CR‐12 CR‐24 CO‐0 CO‐12 CO‐24
Fig. 4 – Comparison of proposed modified models.
4. CALCULATION OF RESIDUAL CROSS SECTION STRENGTH
For the calculation of the residual strength of timber cross-sections, two different simplified rules are presented in EC5: (i) the reduced properties method (RPM) that accounts for the reduction of the mechanical properties within the residual cross section; and (ii) the reduced cross section method (RCSM) that reduces the residual section further, by eliminating also the pyrolysis layer, but maintains the mechanical properties of wood intact. In each case, calculation of the residual cross section is based on charring rate concept. In addition, an advanced calculation method (ACM) is presented where temperature dependent strength and stiffness were used to calculate the residual strength of a cross section
submitted to a certain thermal field. In this work the residual strength of a timber section calculated using the RCSM is compared with that obtained using the ACM.
4.1. Comparison of RCSM and ACM
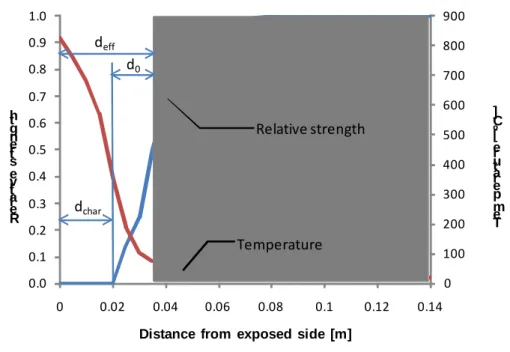
In Fig. 5, the principles of the RCSM are illustrated for the case of one-dimensional behavior. The two curves shown indicate the temperature profile after a certain period of time and the corresponding relative strength using EC5 reduced properties. The total strength of a cross section submitted to a
compression force is proportional to the area below the relative strength curve. The RCSM is based on the calculation of a distance deff which leads to an equivalent uniform stress (shaded area) within the cross-section where the strength of timber remains unchanged (relative strength equal to 1.0). The
distance deff can be calculated as the sum of two terms: (i) dchar, that is the charring depth; and (ii) d0, that is the equivalent charred timber. Since the differences between dchar when different methods of calculation are used have been described previously in this paper, the term d0 will be subsequently analyzed.
0 100 200 300 400 500 600 700 800 900 0.0 0.1 0.2 0.3 0.4 0.5 0.6 0.7 0.8 0.9 1.0 0 0.02 0.04 0.06 0.08 0.1 0.12 0.14 T e m p e ra tu re [ º C ] R e la ti v e s tr e n g th
Distance from exposed side [m]
d0 Relative strength Temperature deff dchar
Fig. 5 – Typical temperature profile and relative strength with definition of main parameters used in RCSM.
(
/20;1)
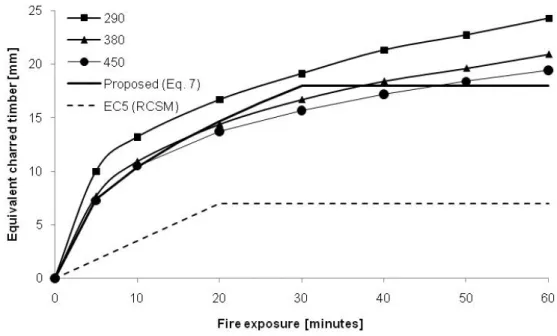
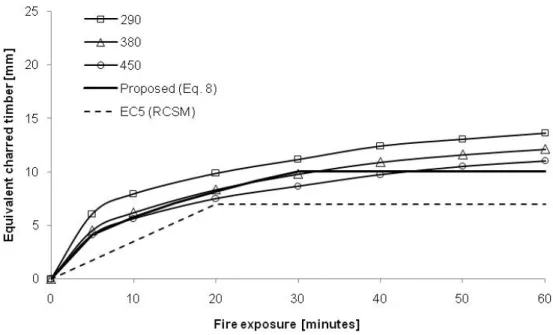
min , 7 0 0 0 k k t d = = . (6) It can be observed from equation (6) that the equivalent charred timber aspresented in RCSM is independent of the type of stress while in the ACM the strength reduction with increasing temperature is different for compression, tension or shear. The behavior of equivalent charred timber with time was investigated for three timber densities (moisture content equal to 0.12) 290, 380 and 450 kg/m3. The results are plotted in Fig. 6 and 7 for the cases of compression and tension, respectively, and compared with equation (6). Two main findings can be observed: first, there are some differences between the compressive and tensile behavior observed when the ACM is used; and, second, the differences between RCSM and ACM are also important, especially in the case of compression.
Fig. 6 – Relation between fire exposure and equivalent charred timber in compression.
Fig. 7 – Relation between fire exposure and equivalent charred timber in tension.
The results obtained indicate that the RCSM method gives an reasonably good approximation for tensile stresses and for the case of timber with 450 kg/m3. In the case of compressive stresses the differences were much bigger
.
4.2. Possible improvement
To improve the coherence of both methods different expressions for the calculation of equivalent charred timber are proposed for compression and tension. The proposal includes modification of the threshold value of 7 mm and the correction parameter k0. For the correction parameter a square root curve was proposed for the first 30 minutes instead of the linear approximation for the first 20 minutes indicated in EC5. The proposed threshold value for tension is 10 mm:
(
)
0 10 0, 0 min / 30;1
d = k k = t . (7)
For compression the threshold value that is proposed is 18 mm.
(
)
0 18 0, 0 min / 30;1
d = k k = t . (8)
The proposed equations were plotted in Figs. 6 and 7 as solid lines. It can be observed that beyond 30 minutes, the proposed equations slightly underestimate the equivalent charred timber obtained using the ACM.
5. CONCLUSIONS
Advanced and simplified methods are presented in EC5 to calculate fire resistance of structures. Both models have some limitations, but most important, they have some inconsistencies. This paper presents proposals to overcome some of the inconsistencies as well as to extend their applicability.
A modified specific heat capacity curve has been proposed for the conductive model allowing to consider different moisture contents.
An expression to calculate the charring rate as a function of density and moisture content has been suggested for the charring rate model that is compatible with the conductive model.
Modified expressions for use with the reduced cross section method were proposed to improve the consistency with the advanced calculation method.
REFERENCES
[1] EN 1995-1-2:2004. Eurocode 5: Design of timber structures - Part 1-2: General - Structural fire design. CEN, 2004.
[2] Franssen J-M. SAFIR. A Thermal/Structural Program Modelling Structures under Fire, Engineering Journal, A.I.S.C., 2005: 42 (3), pp. 143-158.
[3] White RH, Erik V, Nordheim EV. Charring rate of wood for ASTM E 119 fire exposure. Fire Technology. 1992: 28 (1), pp. 5-30.
[4] White RH, Tran HC. Charring Rate of Wood Exposed to a Constant Heat Flux. Slovak Republic, s.n. Wood & Fire Safety - 3rd Int.l Scientific Conference, 1996, pp. 175-183.
[5] Njankouo JM, Dotreppe J-C, Franssen J-M. Experimental study of the
charring rate of tropical hardwoods. Fire and Materials, 2004: 28, pp. 15-24, DOI: 10.1002/fam.831.
[6] König J, Walleij L. One-dimensional charring of timber exposed to standard and parametric fires in initially unprotected and postprotection situations. Swed Inst Wood Technol Res. 1999. Rapport I 9908029.
[7] Australia, Standards. AS 1720.4. Timber structures Part 4: fire resistance of structural timber members. North Sydney, Australia : Standards Australia, 1990.
[8] EN 1991-1-2:2002. Eurocode 1: Actions on structures - Part 1-2: General actions - Actions on structures exposed to fire. CEN, 2002.
[9] Njankouo JM, Dotreppe J-C, Franssen, J-M. Fire resistance of timbers from tropical countries and comparison of experimental charring rates with various models. Construction and Building Materials. 2005: 19 (5), pp. 376-386. [10] Gu H, Hunt JF. Two-dimensional finite element heat transfer model of softwood. Part III. Effect of misture content on thermal conductivity. [ed.] Society of Wood Science and Technology. Wood and Fiber Science. 2007: 39, pp. 159-166.
[11] FPL. Thermal conductive properties of wood, green or dry, from -40° TO +100° C: A literature review. Madison, Wyscosin, USA : Forest Products Lab., 1977. Report FPL-9.
[12] Parker WJ. Development of a model for the heat release rate of wood - a status report. U.S. Dep. Commerce. 1985. Report NBSIR 85-3163.
[13] Ragland KW, Aerts DJ. Properties of Wood for Combustion Analysis. Bioresource Technology. 1991: 37, pp. 161-168.
[14] Schaffer EL. Charring rate of selected woods transverse to grain. Forest Products Laboratory. Madison, wiscosin, USA : s.n., 1967. Research paper FPL 69.
[15] Hietaniemi J. A Probabilistic Approach to Wood Charring Rate. VTT
Building and Transport. Finland : VTT Information Service, 2005. VTT Working Papers 31.
[16] FPL. Wood handbook. Wood as an engineered material. Madison, Wisconsin, USA : Forest Products Laboratory, 1999.