HAL Id: hal-00327955
https://hal.archives-ouvertes.fr/hal-00327955
Submitted on 17 Aug 2005HAL is a multi-disciplinary open access
archive for the deposit and dissemination of sci-entific research documents, whether they are pub-lished or not. The documents may come from teaching and research institutions in France or abroad, or from public or private research centers.
L’archive ouverte pluridisciplinaire HAL, est destinée au dépôt et à la diffusion de documents scientifiques de niveau recherche, publiés ou non, émanant des établissements d’enseignement et de recherche français ou étrangers, des laboratoires publics ou privés.
Case studies of ozone transport between North America
and Europe in summer 2000
G. Guerova, I. Bey, J.-L. Attié, R. V. Martin
To cite this version:
G. Guerova, I. Bey, J.-L. Attié, R. V. Martin. Case studies of ozone transport between North America and Europe in summer 2000. Atmospheric Chemistry and Physics Discussions, European Geosciences Union, 2005, 5 (4), pp.6127-6184. �hal-00327955�
ACPD
5, 6127–6184, 2005 Case studies of ozone transport in summer 2000 G. Guerova et al. Title Page Abstract Introduction Conclusions References Tables Figures J I J I Back CloseFull Screen / Esc
Print Version Interactive Discussion
EGU Atmos. Chem. Phys. Discuss., 5, 6127–6184, 2005
www.atmos-chem-phys.org/acpd/5/6127/ SRef-ID: 1680-7375/acpd/2005-5-6127 European Geosciences Union
Atmospheric Chemistry and Physics Discussions
Case studies of ozone transport between
North America and Europe in summer
2000
G. Guerova1, I. Bey1, J.-L. Atti ´e2, and R. V. Martin3,4
1
Laboratoire de Mod ´elisation de la Chimie Atmosph ´erique, ´Ecole Polytechnique F ´ed ´erale de Lausanne (EPFL), Lausanne, Switzerland
2
Laboratoire d’A ´erologie, Observatoire Midi Pyr ´en ´ees, Toulouse, France
3
Department of Physics and Atmospheric Science, Dalhousie University, Halifax, NS, B3H 3J5, Canada
4
Harvard-Smithsonian Center for Astrophysics, Cambridge, Massachusetts, USA Received: 30 June 2005 – Accepted: 22 July 2005 – Published: 17 August 2005 Correspondence to: G. Guerova (guergana.guerova@epfl.ch)
ACPD
5, 6127–6184, 2005 Case studies of ozone transport in summer 2000 G. Guerova et al. Title Page Abstract Introduction Conclusions References Tables Figures J I J I Back CloseFull Screen / Esc
Print Version Interactive Discussion
EGU
Abstract
This paper reports on Long Range Transport (LRT) of ozone and related species over the North Atlantic ocean and its impact on Europe. Measurements of NO2 and O3 columns from the GOME and MOPITT satellite instruments are first used in conjunc-tion with the GEOS-CHEM global model of transport and tropospheric chemistry to
5
identify the major events of LRT that reach Europe over the course of the summer 2000. Model simulations are then used to examine surface O3 observations at a Eu-ropean mountain site and O3 vertical profiles over several European cities to quantify the impact of the LRT events on the European ozone distributions. Over the course of summer 2000, we identified nine major episodes of pollution transport between North
10
America and Europe, which are in majority associated with WCB/post-frontal outflow (7 events) and zonal transport (2 events). We find that on average three episodes occur per month with the strongest ones being in June. The number and frequency of LRT events that reach Europe after leaving North America is strongly driven by the posi-tion and strength of the Azores anticyclone. After leaving North America, the plumes
15
can either i) travel in the North American cyclones, mostly in the Warm Conveyor Belt (WCB), tracking poleward and thus reach Europe at high latitudes; ii) be transported zonally between 40◦ and 55◦N directly to Europe; iii) be incorporated into the Azores anticyclone and reach Europe at mid-latitudes. Based on model sensitivity simulation it can be concluded that on average the North American sources of ozone contribute
20
between 2–8 ppb in PBL and 10–13 ppb in FT. During particular episodes the North American sources resulted in O3 enhancement up to 25–28 ppb in the layer between 800–600 hPa and 10–12 ppb in PBL. For some episodes a substantial North American contribution (30% or higher) does not translate into a well marked enhancement of the total O3.
ACPD
5, 6127–6184, 2005 Case studies of ozone transport in summer 2000 G. Guerova et al. Title Page Abstract Introduction Conclusions References Tables Figures J I J I Back CloseFull Screen / Esc
Print Version Interactive Discussion
EGU
1. Introduction
The long range transport (LRT) of pollution in the Northern Hemisphere is of major importance as the main anthropogenic sources are the populated regions of North America, Europe and in the last decade, Asia. The LRT between North America, Europe and Asia occurs at all altitudes of the troposphere and is a subject of intense
5
observation and modeling efforts. In particular, tropospheric ozone (O3) has a lifetime of several days, which makes it very suitable to be transported over long distances. The LRT between North America and Europe is currently rising a lot of interest as it has been suggested that North America has a substantial impact on the atmosphere above Europe (e.g., Stohl and Trickl,1999;Stohl et al.,2002;Li et al., 2002; Auvray
10
and Bey, 2005). For example, 11% of the tropospheric ozone burden over Europe in summer is found to be due to precursors emitted over North America, while the European sources are responsible for only 10% (Auvray and Bey,2005). In this paper, we use a three-dimensional global model of chemistry and transport simultaneously with several observational datasets to quantify the impact of individual LRT events on
15
O3distributions over Europe.
The LRT of O3 between North America and Europe has significant seasonal varia-tions. The O3 flux due to precursors emitted over North America, has a maximum in spring and summer due to increased photochemical activity and favorable weather pat-terns (Auvray and Bey,2005). Li et al.(2005a) recently investigated the predominant
20
pathways of North American pollution export to the North Atlantic Ocean in summer. They found that export from North America is controlled by the fast-moving mid-latitude cyclones tracking eastward across North America. Cyclogenesis over continental US occurs predominantly at two locations, i) at the lee side of the Rocky Mountains (4 events per month in summer 2000), and ii) over the east coast of US (3 events during
25
summer 2000).Li et al.(2005a) also reported one event of pollution export associated with a east-west stationary front that induces a strong zonal outflow. The pollution is predominantly exported in the latitude range between 30 and 55◦N through these
cy-ACPD
5, 6127–6184, 2005 Case studies of ozone transport in summer 2000 G. Guerova et al. Title Page Abstract Introduction Conclusions References Tables Figures J I J I Back CloseFull Screen / Esc
Print Version Interactive Discussion
EGU clones, but a few events of high-latitude outflow associated with high-latitude cyclones
are also found (5 in the course of summer 2000) (Li et al.,2005a). In general, pollu-tants are lifted outside of the boundary layer at pressure levels 700 to 500 hPa ahead of the cold fronts associated with the cyclones in the Warm Conveyor Belt (WCB) (Stohl, 2001). Strong outflow is also found behind the cold fronts at low altitudes. In average,
5
the carbon monoxide (CO ) flux exported out off North America is reported to be 50% larger at altitudes below 3 km. Finally, deep convection, especially over southeastern and central US also contributes to the ventilation of the boundary layer (Li et al.,2005a; Auvray and Bey,2005).
We build on the work of Li et al. (2005a) to examine further the North American
10
outflow and to quantify its impact on Europe. We first use satellite retrievals of CO and nitrogen dioxide (NO2) in combination with the GEOS-CHEM model to identify the major events of LRT that enter Europe during the summer 2000. The MOPITT CO observations offer a good signature of continental outflow, while the GOME NO2 observations provide an additional indication of chemical environment in the plumes (Li
15
et al.,2005a;Choi et al.,2005). We then use the model to examine O3concentrations at the mountain site Jungfraujoch (3580 m a.s.l., Switzerland) as well as ozone vertical profiles provided by the Measurement of Ozone and Water Vapor by Airbus In-Service Aircraft (MOZAIC) program, to quantify the impact of LRT events on O3 distributions over Europe. The Jungfraujoch station presents the advantage to be located in the
20
center of Europe and in the Free Troposphere (FT) and is, thus, susceptible to be a receptor point for most of LRT events. The MOZAIC profiles allow examination of LRT events throughout the troposphere with good temporal and spatial resolution.
This paper is organized as follows. Section 2 presents the different datasets used, i.e. satellite retrievals of CO and NO2 from the MOPITT and GOME instruments,
re-25
spectively, the ground based observations at the Jungfraujoch and the MOZAIC verti-cal profiles. The GEOS-CHEM model used in this work is described in Sect. 3 of the manuscript. The atmospheric circulation and detailed description of the LRT episodes entering Europe are presented in Sect. 4. The impact of North American plumes on
ACPD
5, 6127–6184, 2005 Case studies of ozone transport in summer 2000 G. Guerova et al. Title Page Abstract Introduction Conclusions References Tables Figures J I J I Back CloseFull Screen / Esc
Print Version Interactive Discussion
EGU O3distributions in Europe is examined in Sect. 5. Conclusions are given in Sect. 6.
2. Observation datasets
2.1. Carbon monoxide retrievals from MOPITT instrument
The MOPITT instrument flies on the NASA EOS Terra satellite which has a near-polar, sun-synchronous orbit with an inclination of approximately 98.2 degrees with respect
5
to the equator, an altitude of 705 km, a descending node crossing time 10:30 LT and a global coverage in approximately three days. MOPITT is a nadir sounding instru-ment with field-of-view 22×22 km2 (http://www.atmosp.physics.utoronto.ca/MOPITT/ mdd 93/index.html). The field of view is continuously scanned through a swath of about 600 km wide thus increasing the spatial coverage. A detailed description of
10
the MOPITT-CO retrieval algorithm can be found in Deeter et al. (2003). The mea-sured radiances are inverted to CO profiles using an optimal estimation algorithm and a radiative transfer model described inEdwards et al. (1999). Retrievals of CO may involve up to twelve measured signals in the two measurement bands. Only clear-sky radiances, i.e., uncontaminated by clouds, are fed to the retrieval algorithm.
15
The MOPITT Version 3 data are available for the period March 2000–May 2001. The daytime and nighttime CO profiles are retrieved on seven pressure levels: sur-face, 850, 700, 500, 350, 250, 150 hPa and correspond to the global measurements between 65◦S and 65◦N. The maximum likelihood retrieval algorithm used in the MO-PITT data processing incorporates a priori information into the retrieval. This is a must
20
in the radiances processing due to the non-uniqueness of the solution. For a detailed description of computation of the averaging kernel matrix we refer to: ‘Calculation and Application of MOPITT Averaging Kernels’ (PDF, by M. Deeter, updated 24 July 2002, available at:http://www.eos.ucar.edu/mopitt/data/index.html). For the comparison with GEOS-CHEM the MOPITT observations have been averaged over the 2×2.5◦model
25
av-ACPD
5, 6127–6184, 2005 Case studies of ozone transport in summer 2000 G. Guerova et al. Title Page Abstract Introduction Conclusions References Tables Figures J I J I Back CloseFull Screen / Esc
Print Version Interactive Discussion
EGU eraging kernel matrix. Similarly toHeald et al.(2003) the averaging kernels are applied
to the GEOS-CHEM CO column.
2.2. Nitrogen dioxide retrievals from GOME
The GOME instrument was launched on board of the European Space Agency ERS-2 satellite in April 1995. The satellite has a sun-synchronous polar orbit with an
inclina-5
tion of 98◦ with respect to the equator, a mean altitude of 780 km, equator crossing at 10:30 LT and a global coverage in approximately 3 days. GOME has a nadir-scanning ultraviolet and visible spectrometer for global monitoring of total atmospheric ozone and nitrogen dioxide (Burrows et al., 1999). The instrument has a field-of-view of 320×40 km2(2.8◦×0.14◦). Satellite observations of tropospheric constituents are much
10
more difficult than for the stratosphere due to interferences with clouds and aerosols, inhomogeneities in the ground albedo and the stratospheric contributions. In the re-trieval of NO2from GOME those contributions have been taken into account.
Our version 2 retrieval of tropospheric NO2 columns from GOME is based on the version 1 algorithm described in(Martin et al.,2002) with the following differences. The
15
slant NO2columns are obtained by nonlinear least-squares fitting of in the 426–452 nm spectral region. All interfering species are fitted in this spectral window. The H2O-ring effect is no longer included as an interfering species. A 241◦K NO2spectrum (Burrows et al.,1998) is used in the retrieval. FollowingRichter and Burrows(2002), a single so-lar reference spectrum, specifically 11 June 2000, is used to eliminate the daily varying
20
bias caused by the diffuser plate on the GOME instrument (Richter and Wagner, per-sonal communication, 2001; Martin et al., 2002). The most pronounced difference between the version 1 and version 2 tropospheric NO2 columns occurs over deserts where the version 2 data are lower by about 5×10¹⁴molec cm−2. The details of the subsequent processing are described inMartin et al.(2002) and Martin et al.(2003).
25
Briefly, the stratospheric component is computed over the remote Pacific Ocean and subtracted to obtain the tropospheric slant columns. The tropospheric slant columns are converted to vertical columns using an Air Mass Factor (AMF). The AMF is
calcu-ACPD
5, 6127–6184, 2005 Case studies of ozone transport in summer 2000 G. Guerova et al. Title Page Abstract Introduction Conclusions References Tables Figures J I J I Back CloseFull Screen / Esc
Print Version Interactive Discussion
EGU lated from the integral of the relative vertical NO2 distribution from the GEOS-CHEM
weighted by altitude-dependent scattering weights (Palmer et al.,2001), computed with the LIDORT (Spurr,2002) radiative transfer model. The temperature dependence of the NO2cross-section is accounted for in the AMF calculation. Clouds scattering is ac-counted for using local cloud information determined from GOME (Kurosu et al.,1999).
5
It should be mentioned that GOME is almost twice as sensitive to tropospheric NO2 columns over ocean than over land. Clouds enhance the sensitivity of GOME to NO2 columns over ocean, increasing the AMF by up to 40% with respect to clear-sky. Over continental regions with high surface emissions, the AMF is typically 20–30% lower than clear-sky AMFs due to the obscuration of boundary layer NO2by clouds. We
ex-10
clude scenes in which the cloud radiance fraction exceeds 50% to reduce the retrieval uncertainty. The typical uncertainty estimate for each observation is ± (1×10¹⁵molec cm−2 + 40%). After accounting for random errors, the monthly-mean uncertainty re-duces to ± (5×10¹⁴ molec cm−2+ 30%).
2.3. Surface observations of O3at the Jungfraujoch
15
O3measurements at the Jungfraujoch (JFJ) are performed with a UV absorption instru-ment. Estimated standard uncertainty for hourly averages is 1.2 ppb for values below 60 ppb and 2% for values greater than 60 ppb. The JFJ site is at an altitude of 3580 m a.s.l. (650 hPa) and is surrounded by industrialized regions. The JFJ is predominantly situated in the free troposphere (57% of the time according to Li et al., 2005b1), but
20
convection or frontal intrusions frequently bring planetary boundary layer air to the site (Baltensperger et al., 1997;Zellweger et al., 2003) especially during the warmer months. The wind direction at the site is influenced by the NE-SW orientation of the local alpine watershed in the immediate vicinity, resulting in an average annual wind
1
Li, Y., Staehelin, J., Auvray, M., Bey, I., and Schultz, M.: Comparison between numerical simulations of two 3-D global models (GEOS-CHEM and MOZART) with ozone observations at Jungfraujoch (Switzerland) and ozone sondes from Payerne, Atmos. Environ., submitted, 2005b.
ACPD
5, 6127–6184, 2005 Case studies of ozone transport in summer 2000 G. Guerova et al. Title Page Abstract Introduction Conclusions References Tables Figures J I J I Back CloseFull Screen / Esc
Print Version Interactive Discussion
EGU frequency of 60% from north-west and 30% from south-east according to MeteoSwiss
(Baltensperger et al.,1997).
2.4. O3vertical profiles from MOZAIC
MOZAIC O3 concentrations are measured on board of commercial aircraft by a dual beam UV absorption instrument. The overall precision of the data is ± (2 ppb+ 2%). O3
5
measurements have been validated using ozonesonde data. In the free troposphere (800–300 hPa) the agreement found (3 to 13%) was well within the uncertainty of the two techniques (Thouret et al.,1998). In this manuscript we used MOZAIC profiles over Brussels, Paris and Frankfurt airports. On average two profiles per day are available at each airport. For the comparison with GEOS-CHEM, the observations are interpolated
10
to the model pressure levels.
3. Global Chemistry Transport Model: GEOS-CHEM
3.1. Model description and simulation
In this manuscript, we used the GEOS-CHEM model, version 5-07-08 with an horizon-tal resolution of 2◦of latitude by 2.5◦of longitude and 30 vertical levels from the surface
15
to 0.01 hPa with 18 levels in the troposphere (http://www.as.harvard.edu/chemistry/ trop/geos). A brief description of the model is given below. Further details can be found inBey et al.(2001),Martin et al.(2003) andPark et al.(2004).
The model is driven by meteorological fields provided by the Global Circulation Model GEOS-3 of the Global Modeling and Assimilation Office (GMAO) at NASA with a
tem-20
poral resolution of 3 and 6 h. 31 tracers are transported to provide a comprehensive de-scription of the NOx-Ox-VOC chemistry and nitrate-ammonium-sulphate aerosol chem-istry. A total of 300 chemical reactions are taken into account in the chemical mecha-nism for about 80 different species, as described inFiore et al.(2003). The photolysis
ACPD
5, 6127–6184, 2005 Case studies of ozone transport in summer 2000 G. Guerova et al. Title Page Abstract Introduction Conclusions References Tables Figures J I J I Back CloseFull Screen / Esc
Print Version Interactive Discussion
EGU rates are calculated with the Fast-J algorithm (Wild et al., 2000), which accounts for
clouds and aerosols. When not provided by the model itself, aerosols are taken from the GOCART model (Chin et al.,2002) and coupled to the GEOS-MODEL model as described in Martin et al. (2003). The dry deposition velocities are computed using a resistance-in-series model described inWesely(1989) and modified byWang et al.
5
(1998a). Wet deposition is applied to aerosols, HNO3 and H2O2 as described inLiu et al. (2001).
Anthropogenic emissions of NOx, CO and NMCs are prescribed as monthly mean fluxes. They are derived from extensive compilations of energy use and combustion efficiency data (Wang et al.,1998b) and further scaled to the year 2000 as described
10
inBey et al.(2001). Natural emissions from plants and NOx sources from lightning are calculated on-line with different parameterizations in order to capture their large vari-ability. Biomass burning emissions are included on monthly bases and are specified for 2000 using Aerosol Index (AI) data from TOMS as well as ATSR (Along Track Scanning Radiometer) observations as described inDuncan et al.(2003).
15
In the transport algorithm the three-dimensional continuity equation is solved using a flux-form semi-Lagrangian method (Lin and Rood,1996). The basic constraint is a mass conservation as well as consistency of the flow and stability. Moist convection is parameterized as formulated in Allen et al. (1996a) and Allen et al. (1996b). As-sumed is a full mixing within the boundary layer extent, which is specified based on
20
meteorological fields.
In this study, results are shown from a standard simulation for 2000 obtained after a one-year spin up. A sensitivity simulation was also conducted in which anthropogenic emissions from North America are turned off. The subtraction of these results from that of the standard simulation allows quantification of the fraction of O3 only due to North
25
American sources (further referred to as North American O3). Tagged O3 simulation is performed to separate the stratospheric contribution. In that simulation, the produc-tion and loss rates archived from the standard simulaproduc-tion are used to drive an off-line simulation, in which different O3tracers are transported and tagged according to their
ACPD
5, 6127–6184, 2005 Case studies of ozone transport in summer 2000 G. Guerova et al. Title Page Abstract Introduction Conclusions References Tables Figures J I J I Back CloseFull Screen / Esc
Print Version Interactive Discussion
EGU region of production.
3.2. Model evaluation
The model has been previously the subject of several global evaluations (e.g., Bey et al.,2001;Martin et al.,2003). Regional validations were presented byFiore et al. (2002) and Li et al. (2005a) for the United States, Li et al. (2002) for the Western
5
North Atlantic Ocean, and Duncan and Bey (2004) and Auvray and Bey (2005) for Europe. Evaluation of O3 and CO on a global scale does not show obvious biases. However, monthly means O3show a too low seasonal variations especially in the mid-troposphere, i.e., at the 500 hPa level (Bey et al.,2001;Fusco and Logan,2003). Over Europe, monthly means surface CO was found to be too low in winter and spring by
10
22 ppb and too high in summer and fall by 20 ppb (Auvray and Bey,2005).
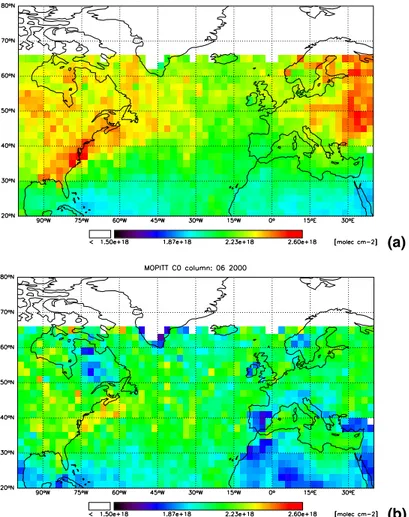
Figure 1 compares monthly averaged tropospheric CO column from GEOS-CHEM and from MOPITT for June 2000. This month is shown as an example since in 2000, it is the summer month for which LRT episodes are more frequent, and CO concen-trations over the North Atlantic are the strongest compared to July and August (not
15
shown). The model overestimates CO columns over Canada, Eastern Europe, and over the North Atlantic, resulting in a positive bias of 7% (Table1) and correlation of 0.59. The model overestimate, well pronounced in July and August, is believed to be due to too low OH concentrations. We find a global methyl chloroform (CH3CCl3) life-time close to 7 years in this version of the model, while CH3CCl3 observations rather
20
suggest a lifetime against tropospheric OH of about 5.5 years (Spivakovsky et al.,2000; Lelieveld et al.,2004). The reason for these too low OH concentrations is unclear at this moment, but may reflect a problem in the model associated with cloud optical depths.
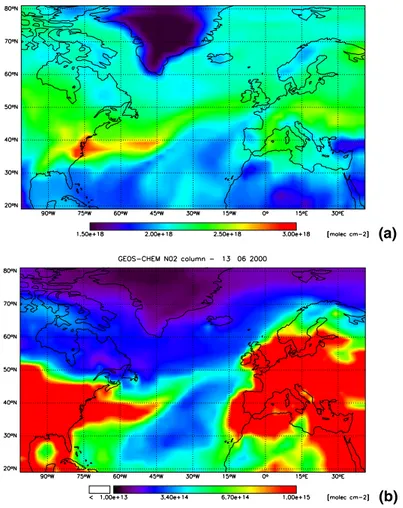
The comparison between monthly mean NO2 from GEOS-CHEM and from GOME for June 2000 is shown in Fig.2. In contrast to CO the model shows a well pronounced
25
underestimate of NO2columns ranging from −32 to −42% for the entire summer and over the region of interest. The correlation 0.81 (Table1) is however good, indicating a correct representation of the spatial variation of NO2. Note thatAuvray and Bey(2005)
ACPD
5, 6127–6184, 2005 Case studies of ozone transport in summer 2000 G. Guerova et al. Title Page Abstract Introduction Conclusions References Tables Figures J I J I Back CloseFull Screen / Esc
Print Version Interactive Discussion
EGU also pointed out that the model underestimates surface NO2 concentrations by about
17% over Europe especially in summer. Similar results were also reported in a recent global model intercomparison experiment by Dentener et al. (2005)2. They found that the averaged model maxima of 6–8 1015molec cm−2 is clearly underestimating the GOME observed values, which exceed 10 1015molec cm−2, indicating possible
prob-5
lems with NOxemissions or other factors such as model chemistry and resolutions. Figure 3 shows a comparison between monthly mean O3 profiles as provided by MOZAIC and simulated over Brussels, Paris, Frankfurt, while Table 2 summarizes a number of statistical quantities calculated using individual profiles. Figure3shows that the model reproduces in general the observed features of the monthly mean O3
pro-10
files. However, the model systematically underestimates O3 in the FT by about 7 ppb (12%) while it overestimates O3 by about 3 ppb (6%) in the PBL. Observed surface O3has to be considered with caution. High concentrations of NOxclose to the airports and in general in the PBL close to large cities induce a strong titration of O3, which may not be reflected in the model grid. In the FT, the reasons for the model underestimate
15
are unclear, but could reflect problems with the magnitude of the stratospheric flux, the role of European sources (e.g., mixing between PBL and FT) and/or the influence of North American sources.
4. Transport of CO and NO2over the North Atlantic
4.1. Airflow patterns over the North Atlantic in summer 2000
20
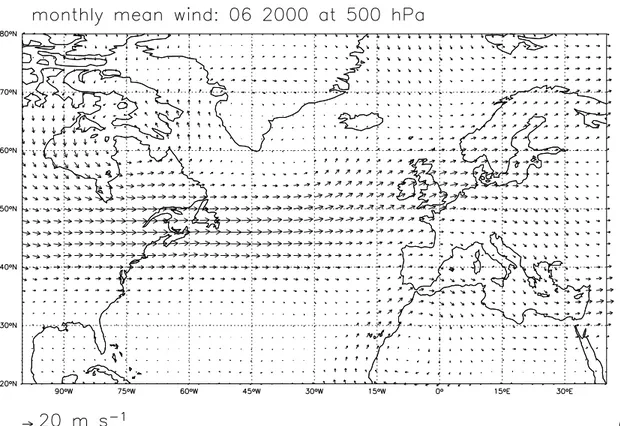
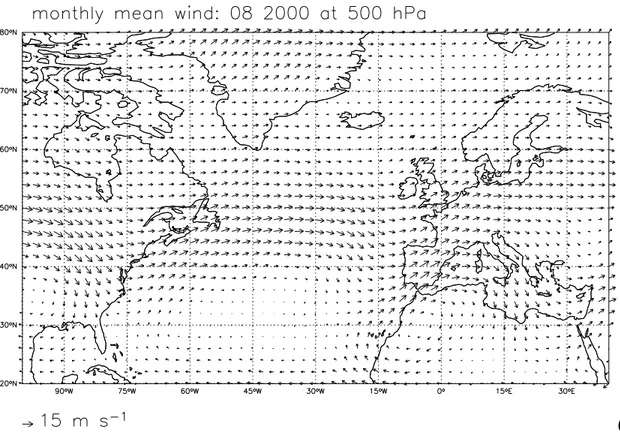
Figure 4 presents the model monthly mean winds at 500 hPa in summer 2000. In June 2000 (Fig.4a), there are two well marked large scale circulation patterns, namely the Azores extratropical anticyclone and the cyclone located between Greenland and Iceland. Between those two distinct systems a strong westerly flow (20 m/s) is well seen
2
Dentener, F., Stevenson, D., Ellingsen, K., Noije, T., Schultz, M., and Amann, M.: Global air quality for the next generation, J. Geophys. Res., submitted, 2005.
ACPD
5, 6127–6184, 2005 Case studies of ozone transport in summer 2000 G. Guerova et al. Title Page Abstract Introduction Conclusions References Tables Figures J I J I Back CloseFull Screen / Esc
Print Version Interactive Discussion
EGU at 500 hPa between 45◦–55◦N. The circulation in July (Fig.4b) is mostly driven by the
Azores anticyclone, which has expanded to the north and covers almost completely the North Atlantic. A strong southwesterly flow is seen along the east coast of the North America. The Azores anticyclone in August is present only to the south of the North Atlantic. Between 40◦–50◦N a westerly flow is predominant at the 500 hPa model level
5
(Fig.4c). The Azores anticyclone is a persistent pattern in summer 2000 over the North Atlantic, and its position and strength are the key parameters that drive the pollution transport from North America to Europe.
In contrast toLi et al.(2005a), the present work focuses on air masses with a North American origin which cross the North Atlantic Ocean and impact Europe. After leaving
10
North America, those air masses can either i) travel in the North American cyclones tracking poleward and thus reach Europe at high latitudes; ii) be transported zonally between 40◦and 55◦N directly to Europe; iii) be incorporated into the Azores anticy-clone and reach Europe or they may travel back towards North America and never reach Europe.
15
WCB of Atlantic cyclones are efficiently ventilating the east cost of North America, but in the summer time not all WCB reach Europe. When they reach Greenland they can be either dispersed due to occlusion or intercepted in a new WCB during cyclogenesis of an Iceland low. Such an example was reported byCooper et al. (2004) during the ITCT 2K2 campaign in the North Pacific. In the following, we describe the pathways
20
of a number of long range transported air masses as they leave North America, travel over the North Atlantic and enter Europe. We identify a total of nine LRT events in summer 2000 in both the model and the observations.
4.2. June 2000
According toLi et al. (2005a) the first WCB uplift over North America occurred in the
25
period 4 to 6 June (not shown). On 4 June elevated model CO concentrations are seen along the east coast of North America and Labrador sea. They are associated with a cyclone located over the Gulf of Saint Lawrence moving northeastward toward
ACPD
5, 6127–6184, 2005 Case studies of ozone transport in summer 2000 G. Guerova et al. Title Page Abstract Introduction Conclusions References Tables Figures J I J I Back CloseFull Screen / Esc
Print Version Interactive Discussion
EGU Greenland, a typical summertime trajectory (Li et al., 2005a). On the next day the
cyclone is stationed south of Greenland and a CO plume can be located in the model at 700 hPa. During the following days the cyclone occludes and the CO is dispersed. This example illustrates one case of North American outflow that does not reach Europe.
The first episode of LRT, with a clear impact on Europe further denoted as LRT1,
5
is presented in Fig. 5. In the period 9–13 June the circulation over the Atlantic can be summarized as follows: i) 8–9 June: development of extratropical anticyclone over the Azores and cyclogenesis in the Hudson Bay, ii) 10–13 June: anticyclone extends toward southern Europe, while the low pressure system moves northeastward toward Greenland. Between those distinct structures westerly-south-westerly winds are
pre-10
vailing with a wind speed of 20 m/s at 850 hPa and 40 m/s at 500 hPa. In this open channel (Fig.5e) the anthropogenic emissions from the central Atlantic states of US are directed towards Europe, i.e. the British Isles and Scandinavia. Li et al. (2005a) attribute pollution uplift within the WCB region of a semi-stationary east-west cold front and the subsequent post-frontal transport. This strong episode is clearly seen in the
15
MOPITT CO column (Fig.5c) despite the observation gaps. NO2observations (Fig.5d) also show an enhancement close to the US coast, where the maximum NO2 is pre-sented in the shape of a ‘tongue’. However, based on the model predictions, it does not clearly reach Europe likely due to the shorter lifetime of NO2 compared to that of CO.
20
The LRT2 episode occurred in the period 19–21 June (Fig. 6). A CO plume from the Gulf of Saint Lawrence transported by an Atlantic cyclone moving northeastward is clearly seen in the model at latitude greater than 50◦N. While reaching Iceland, the cyclone deepens and moves toward Europe reaching the British Isles on 22 June (Fig.6e) and continuing toward Norway where it occludes. The CO enhancement could
25
not be confirmed in the MOPITT retrieval (Fig.6c) because there is an observation gap exactly at the plume location. Updrafts in the WCB sector of cold fronts are associ-ated with cloud formation, but only cloud free pixels are used in MOPITT retrieval. No clear enhancement of NO2 associated with this LRT2 is seen neither in the GOME
ACPD
5, 6127–6184, 2005 Case studies of ozone transport in summer 2000 G. Guerova et al. Title Page Abstract Introduction Conclusions References Tables Figures J I J I Back CloseFull Screen / Esc
Print Version Interactive Discussion
EGU observations nor in the model. It is to be noted that NO2enhancement is seen in both
the observations and the model more to the south at about 42◦N. Sensitivity model simulation indicates that this enhancement is restricted to the lower troposphere and is likely to be associated with post-frontal outflow. The transport is taking place at the periphery of the Azores anticyclone and the plume is then turning anticyclonicly, i.e. to
5
the south, shortly before reaching Europe.
In the period 24 to 26 June, an accumulation of anthropogenic CO of Canadian origin occurs in the Gulf of Saint Lawrence (not shown), facilitated by a stationary cyclone. The cyclone continues toward Europe in the period 27 to 29 June inducing a third major LRT episode (LRT3). The trajectory is however different from the one described
10
in the previous two cases. Because of a blocking anticyclone located over Norway, the cyclone moves southeast and reaches the European coast close to Portugal. The cyclone stay stationary west of France, where it occludes around 3 July.
4.3. July 2000
The fourth episode (LRT4) is observed in the period 7–9 July (Fig.7). According toLi
15
et al. (2005a) North American pollution is uplifted within the WCB of an Atlantic cyclone located over the Gulf of Saint Lawrence (Fig.7c). The CO plume is well seen in GEOS-CHEM close to Greenland at 700 hPa on 8 July (Fig.7a). It travels towards Europe and on 9 July reaches the British Isles. Further the plume is transported by a new cyclone located over the North Sea. NO2 enhancement is also observed south of Greenland
20
on 8 July (Fig. 7b). At the same time the Azores anticyclone is occupying the entire North Atlantic and thus the transport is taking place at the northern part of the Ocean. During this period the MOPITT and GOME data are not available for intercomparison.
At the time of the LRT4 arrival in Europe, a new cyclogenesis occurs on 7–8 July over the mid-Atlantic east coast of North America (Li et al.,2005a). The cyclone tracks
25
northeastward towards Newfoundland and on 15 July centers over Scandinavia where the occlusion occurs. On 11 July a distinct CO plume associated with the WCB sector of the cyclone is seen in the model at 500 hPa over the Labrador sea (LRT5). The
ACPD
5, 6127–6184, 2005 Case studies of ozone transport in summer 2000 G. Guerova et al. Title Page Abstract Introduction Conclusions References Tables Figures J I J I Back CloseFull Screen / Esc
Print Version Interactive Discussion
EGU LRT5 plume has a similar trajectory as LRT4. Due to lack of GOME and MOPITT data
the plume can be seen only in the model simulations.
The LRT6 event was associated with aged pollution plume, intercepted by a cyclone and entering Europe through the southwest border, i.e., Portugal and Spain. The cy-clone occludes in the period 26–27 July. Both MOPITT and GOME detect enhanced
5
concentrations at the latitude 30–15◦W and longitude 40◦N on 25–26 July. This en-hancement is possibly associated with post-frontal outflow associated with the cold front of the anticyclone.
The seventh major LRT event is associated with WCB outflow of a North American cyclone formed on 24–25 July, which slowly moves towards the Azores and enters
10
Europe from the southwestern border around 30 July similarly to LRT6. The cyclone moves to the northeast and reaches central Europe on 1 August.
4.4. August 2000
The eight event (LRT8) occurs in the period 2–6 August (not shown). North Ameri-can CO accumulated over Iceland where cyclogenesis occurs on 4 August. Within the
15
newly formed cyclone the North American CO emissions are trapped and further trans-ported towards Europe. The cyclone and the plume reach Scandinavian peninsula on 5 August. The LRT8 occurs to the very northern border of the North Atlantic as the Azores anticyclone spreads to the north covering almost completely the ocean. There is no MOPITT and GOME data available for the region of interest.
20
A zonal LRT event (LRT9) is observed in the period 10 to 14 August (Fig. 8). Both NO2and CO are transported by the strong westerly winds between the cyclone to the north and the Azores anticyclone to the south of the North Atlantic (Fig.8e). Similarly to the LRT1 episode the transport is observed in the lower troposphere. The outflow and transport are distinct in the GEOS-CHEM at 700 hPa as well as in the MOPITT CO
25
total column. Elevated NO2concentrations are also observed in GOME over the North Atlantic at 45◦N, but only limited data are available for this period and region.
pol-ACPD
5, 6127–6184, 2005 Case studies of ozone transport in summer 2000 G. Guerova et al. Title Page Abstract Introduction Conclusions References Tables Figures J I J I Back CloseFull Screen / Esc
Print Version Interactive Discussion
EGU lution transport between North America and Europe, which are in majority associated
with WCB/post-frontal outflow (7 events) and zonal transport (2 events). We find that on average three episodes occur per month with the strongest one being in June 2000.
5. Impact of LRT events on O3distributions over Europe
5.1. O3at Jungfraujoch
5
Figure 9 shows O3 concentrations observed at JFJ and simulated by GEOS-CHEM in the period June–August 2000, along with the model North American and strato-spheric contributions. The model underestimates the observed O3concentrations, and captures only some of the temporal variability (r=0.3 over the summer 2000). As men-tioned previously, the JFJ site is a mountain site which is frequently impacted by fronts,
10
foehn events and thermal lifting that bring planetary boundary layer air with poten-tially high O3concentrations especially in summer. Even though Li et al. (2005b)1find that these events do not contribute much to the monthly mean ozone concentrations, they could have some impact on hourly values. Because of coarse resolutions, these events are difficult to represent in global models (for additional discussion, see Li et al.,
15
2005b1). Despite these limitations, we examine the North American O3contribution at JFJ. The nine major LRT episodes identified with the model and the MOPITT observa-tions are marked by arrows in Fig.9. The averaged North American O3contribution is 9 ppb in summer 2000. Increases in the North American contribution above this mean value can be attributed to each of the previously discussed LRT event. During those
20
events, the North American ozone at JFJ increases up to 20 ppb, and in some cases the enhancement is seen over several days. Note that the strongest LRT events are not associated with the highest levels in O3concentrations, which makes their identification in the O3observations difficult.
ACPD
5, 6127–6184, 2005 Case studies of ozone transport in summer 2000 G. Guerova et al. Title Page Abstract Introduction Conclusions References Tables Figures J I J I Back CloseFull Screen / Esc
Print Version Interactive Discussion
EGU 5.2. O3profiles over Brussels, Paris and Frankfurt
In this section, we further examine the impact of North American pollution by compar-ing individual profiles measured on board of MOZAIC airplanes and simulated by the model over several cities in Europe. In particular, we attempt to analyze O3profiles ob-served during four representative LRT events using the model sensitivity simulations
5
that provide North American and stratospheric O3 contributions. Although imperfect, numerical models provide the only mechanism to attribute ozone enhancements to LRT from a specific source region. Here we apply the GEOS-CHEM model to interpret the observed MOZAIC profiles of O3and quantify the impact of North American plumes on European O3distributions.
10
Impact of the first event LRT1, is illustrated in Fig.10as the plume enters the Euro-pean region on 13 June (Fig.10a) and expands on 14 June (Fig.10b). The observed and model O3profiles averaged over the three-day episode (Fig.10c) show very good agreement above 900 hPa. Note, however, that as expected, the variability (expressed by the standard deviation around the mean value) is much greater in the MOZAIC
pro-15
file compared to GEOS-CHEM. At Brussels, the observed O3 profiles at 12:00 and 20:00 UTC on 14 June (Fig. 10e) differ from those observed on 13 June and show an increase of about 25 ppb between 500 and 600 hPa and around 750 hPa, respec-tively. According to the model (Fig.10d), the increase on 14 June can be attributed to North American O3 with a maximum of 20 ppb between 850 and 650 hPa. This is in
20
agreement with the observed increase, even though the model does not capture the variability over the course of 14 June. On 15 June, an O3 enhancement in the range 20–30 ppb is observed at lower altitude (within the boundary layer), but the model at-tributes only 8 ppb to be due to long range transport from North America. The model stratospheric contribution (Fig.10d) is low (<10 ppb) during that episode. The LRT1
25
plume is also intercepted in MOZAIC profiles in Frankfurt and Paris with the North American enhancement at the same altitude as in Brussels (see Fig.14). We find that the North American O3contributes for more than 20 ppb during this episode, which is
ACPD
5, 6127–6184, 2005 Case studies of ozone transport in summer 2000 G. Guerova et al. Title Page Abstract Introduction Conclusions References Tables Figures J I J I Back CloseFull Screen / Esc
Print Version Interactive Discussion
EGU the strongest one for summer 2000 according to the model.
The LRT2 plume is approaching the British Isles on 21 June as seen in Fig.11a. It enters Europe on 22 June and is intercepted over Paris (white dot in Fig.11b). The comparison between the observed profiles on 21 June and those on 22 and 23 June shows an enhancement of about 15 ppb between 700 and 600 hPa, which is likely
5
associated with North American sources, as diagnosed with the sensitivity model sim-ulations (Fig.11d). Above 550 hPa an enhancement of about 25 ppb is also observed on 23 June, which is likely associated with stratospheric input (Fig. 11d). However, it should be noted that the model does not correctly reproduce the magnitude of the stratospheric O3flux in the layer between 500–300 hPa as indicated by the significantly
10
low model variability compared to the observed one (Fig.11c). During that episode, the model indicates that the North American O3 contributes at the most to about 15 ppb. In the lower troposphere the simulated enhancement of North American contribution at 02:00 UTC on 22 June might be overestimated as the model tends to overestimates the observed O3concentrations throughout the episode.
15
The LTR4 plume reaches Europe at high altitude on 8 July and spreads towards central Europe on 9 July as seen in Fig. 12a and b. In general the model profile, averaged over the episode, compares well with the observed one (Fig. 12c). Note however, that below 700 hPa the model exhibits an overestimate of the observed O3 in the range of 10 ppb, which is within the observed standard deviation. On 8 July
20
(Fig.12e), the observed and model O3 concentrations remain constant with height to about 40 ppb, except for a strong increase (greater than 100 ppb) above 550 hPa, which is likely associated with stratospheric input and, to some extent to North American contribution. On 9 June at 14:00 UTC, an O3layer of North American origin is observed between 750 and 500 hPa while the O3 concentrations in the upper troposphere is
25
substantially reduced (less than 40 ppb). By the next day, this layer disappeared, but an increase of stratospheric origin is again seen in the upper troposphere. Over these 3 days, a strong variability is also seen in the boundary layer, where O3 varies from 2 to 30 ppb. The simulated North American enhancement (Fig.12d) reaches 20 ppb and
ACPD
5, 6127–6184, 2005 Case studies of ozone transport in summer 2000 G. Guerova et al. Title Page Abstract Introduction Conclusions References Tables Figures J I J I Back CloseFull Screen / Esc
Print Version Interactive Discussion
EGU is seen over a large region of the troposphere (from 800 to 500 hPa) on 9 and 10 July.
The arrival of LRT9 plume is illustrated in Fig. 13. As seen in Fig.13c the model clearly underestimates O3concentrations in the mid troposphere. At 10:00 UTC on 13 August, the observed O3 in the lower troposphere increases compared to 04:00 UTC. However, this is not associated with any LRT as indicated by the model sensitivity
5
simulations (Fig. 13a). This enhancement probably reflects the O3 diurnal variation associated with local photochemical activity during stagnation period. The observed O3 concentration below 500 hPa decrease on 14 August in comparison with that ob-served on 13 August, which is likely reflecting a change in local photochemical activity. Nevertheless the model predicts a substantial contribution of North American O3 of
10
about 12 to 18 ppb at 700 hPa (Fig.13d). It should be noted that for this episode, the enhancement is not clearly seen in the MOZAIC profiles (Fig.13e), except maybe at 800 hPa on 15 August.
A generalization of the approach used to quantify the impact of LRT events on O3 dis-tribution over Europe is provided in Fig.14, which shows the simulated North American
15
O3 contributions at 00:00 UTC and 12:00 UTC for each day of June, July and August 2000 over Brussels, Paris and Frankfurt. The color dots correspond to the episodes discussed in the text and it is clear from Fig. 14 that the strongest episodes have been identified. Based on individual cases, the North American contribution presents a broad maximum between 700 and 400 hPa, and reaches up to 28 ppb in one case.
20
In the boundary layer (i.e. below 800 hPa), the North American contribution rarely ex-ceeds 12 ppb. The monthly mean profiles of North American O3over the three selected cities are similar, and increase from about 5 ppb in the boundary layer to about 12 ppb in the middle and upper troposphere. The monthly averaged contribution is larger in June and July than in August. However, it is unclear at the moment whether this is
25
ACPD
5, 6127–6184, 2005 Case studies of ozone transport in summer 2000 G. Guerova et al. Title Page Abstract Introduction Conclusions References Tables Figures J I J I Back CloseFull Screen / Esc
Print Version Interactive Discussion
EGU
6. Summary and conclusions
This paper aims to identify LRT events from North America to Europe using a global model of transport and tropospheric chemistry in conjunction with CO and NO2 satel-lite observations provided by the MOPITT and GOME instruments, respectively. The number and frequency of LRT events that reach Europe after leaving North America
5
appear to be strongly driven by the position and strength of the Azores anticyclone. Af-ter leaving North America, the plumes can either i) travel in the North American (WCB) cyclones tracking poleward and thus reach Europe at high latitudes; ii) be transported zonally between 40◦and 55◦N directly to Europe; iii) be incorporated into the Azores anticyclone and reach Europe at mid-latitudes. It should be noted however that not
10
all the plumes that leave North America reach Europe. In some cases, for example if the plumes are transported at the periphery of the Azores high, they may travel back towards North America and never reach Europe. The LRT episodes clearly identified in the model are better seen in the observations in cases of zonal transport (e.g., LRT1) as the satellite retrievals are not possible in the cloud covered regions associated with
15
WCB outflow.
During summer 2000, we identify a total of 9 major LRT events, which are in majority associated with WCB/post-frontal outflow (7 events) and zonal transport (2 events). On average three episodes occur per month with the strongest ones being in June 2000. Their impact on the O3 distributions over Europe are quantified using O3observations
20
at the mountain site of Jungfraujoch and O3 individual vertical profiles provided by the MOZAIC program over three major European cities. Although the model clearly shows substantial limitations in the representation of individual observed profiles, it is possible to analyze the observed O3vertical profiles in light of several model sensitivity simulations that provide the North American O3and stratospheric O3contributions. As
25
expected, the O3 profiles reflect a complex mixture of individual processes, including local photochemical activity, stratospheric intrusion and transport from North America. The LRT impact is seen at a very large altitude range and with varying strength over the
ACPD
5, 6127–6184, 2005 Case studies of ozone transport in summer 2000 G. Guerova et al. Title Page Abstract Introduction Conclusions References Tables Figures J I J I Back CloseFull Screen / Esc
Print Version Interactive Discussion
EGU course of the summer. Based on model sensitivity simulation it can be concluded that
on average the North American sources of ozone contribute between 2–8 ppb in the boundary layer and 10–13 ppb in the middle and upper troposphere. During particular episodes the North American sources can result in O3enhancement up to 25–28 ppb in the layer between 800–600 hPa and 10–12 ppb in the boundary layer. We find that a
5
substantial North American contribution (e.g., 30% or higher) does not always translate into a well marked enhancement of the total O3 (e.g., LRT4 and LRT9). The June and July months appear to be more strongly impacted than August. Further work is needed to investigate to what extent our results are specific to the year 2000.
Our analysis reveals the difficulty of assessing the impact of LRT events on European
10
O3 distributions based on the sole use of O3 observations. This study also indicates that a clear assessment of the impact on LRT on a given region can only be achieved through a dense networks of measurement sites that provide vertical profiles with a high temporal resolution.
Acknowledgements. We would like to acknowledge the MOPITT, GOME and MOZAIC teams.
15
The GEOS-CHEM model is managed by the Atmospheric Chemistry Modeling Group at Har-vard University with support from the NASA Atmospheric Chemistry Modeling and Analysis Program. We also acknowledge the use of high quality observations at Jungfraujoch provided by the network NABEL and the Swiss Agency of Environment, Forest and Landscape (SAEFL), Bern. We thank S. Reimann (EMPA) for helpful discussion about NABEL data.
20
References
Allen, D. J., Kasibhatla, P., Thompson, A. M., Rood, R. B., Doddridge, B. G., Pickering, K. E., Hudson, R. D., and Lin, S.-J.: Transport-induced interannual variability of carbon monoxide determined using a chemistry and transport model, J. Geophys. Res., 101(D22), 28 655– 28 670, 1996a. 6135
25
Allen, D. J., Rood, R. B., Thompson, A. M., and Hudson, R. D.: Three-dimensional radon 222 calculations using assimilated meteorological data and a convective mixing algorithm, J. Geophys. Res., 101(D3), 6871–6882, 1996b. 6135
ACPD
5, 6127–6184, 2005 Case studies of ozone transport in summer 2000 G. Guerova et al. Title Page Abstract Introduction Conclusions References Tables Figures J I J I Back CloseFull Screen / Esc
Print Version Interactive Discussion
EGU Auvray, M. and Bey, I.: A modeling study of the background ozone over Europe: Origin and
interannual variability, J. Geophys. Res., 110, D11303, doi:10.1029/2004JD005503, 2005.
6129,6130,6136
Baltensperger, U., Gaeggeler, H. W., Jost, D. T., Lugauer, M., Schikowski, M., Weingartenr, E., and Seibert, P.: Aerosol climatology at the high-alpine site Jungfraujoch, Switzerland, J.
5
Geophys. Res., 102, 19 707–19 715, 1997. 6133,6134
Bey, I., Jacob, D. J., Logan, J. A., and Yantosca, R. M.: Global modeling of tropospheric chem-istry with assimilated meteorology: Model description and evaluation, J. Geophys. Res., 106, 23 073–23 095, 2001. 6134,6135,6136
Burrows, J., Dehn, A., Deters, B., Himmelmann, S., Richter, A., Voigt, S., and Orphal, J.:
Atmo-10
spheric remote-sensing reference data from GOME: Part 1. Temperature-dependent absorp-tion cross-secabsorp-tions of NO2 in the 231–794 nm range, J. Quant. Spectrosc. Rad. Transfer, 60, 1025–1031, 1998. 6132
Burrows, J. P., Weber, M., Buchwitz, M., Rozanov, V., Ladst ¨atter-Weibenmayer, A., Richter, A., Debeek, R., Hoogen, R., Bramstedt, K., Eichmann, K.-U., Eisinger, M., and Perner, D.: The
15
Global Ozone Monitoring Experiment (GOME): Mission concept and first results, J. Atmos. Sciences, 56, 151–175, 1999. 6132
Chin, M., Ginoux, P., Kinne, S., Torres, O., Holben, B., Duncan, B., Martin, R., Logan, J., Higurashi, A., and Nakajima, T.: Tropospheric aerosol optical thickness from GOCART model and comparisons with satellite and sunphotometer measurements, J. Atmos. Sci., 59, 461–
20
483, 2002. 6135
Choi, Y., Wang, Y., Zeng, T., Martin, R. V., Kurosu, T. P., and Chance, K.: Evidence of light-ning NOxand convective transport of pollutants in satellite observations over North America, Geophys. Res. Lett., 32, doi:10.1029/2004GL021436, 2005. 6130
Cooper, O. R., Forster, C., Parrish, D., Trainer, M., Dunlea, E., Ryerson, T., H ¨ubler, G.,
25
Nicks, D., Fehsenfeld, F., Holloway, J., de Gouw, J., Warneke, C., Roberts, J. M., Flocke, F., and Moody, J.: A case study of transpacific warm conveyor belt transport: Influence of merging airstreams on trace gas import to North America, J. Geophys. Res., 109, doi:10.1029/2003JD003624, 2004. 6138
Deeter, M. N., Emmons, L. K., Francis, G. L., Edwards, D. P., Gille, J. C., Warner, J. X.,
30
Khattatov, B., Ziskin, D., Lamarque, J.-F., Ho, S.-P., Yudin, V., Atti ´e, J.-L., Packman, D., Chen, J., Mao, D., and Drummond, J. R.: Operational carbon monoxide retrieval algo-rithm and selected results for the MOPITT instrument, J. Geophys. Res., 108(D14), 4399,
ACPD
5, 6127–6184, 2005 Case studies of ozone transport in summer 2000 G. Guerova et al. Title Page Abstract Introduction Conclusions References Tables Figures J I J I Back CloseFull Screen / Esc
Print Version Interactive Discussion
EGU doi:10.1029/2003JD003186, 2003. 6131
Duncan, B. and Bey, I.: A modeling study of export pathways of pollution from Europe: Seasonal and interannual variations., J. Geophys. Res., 109, D08301, doi:10.1029/2003JD004079, 2004. 6136
Duncan, B., Martin, R. V., Staudt, A. C., Yevich, R., and Logan, J. A.: Interannual and seasonnal
5
variability of biomass burning emissions constrained by satellite observations, J. Geophys. Res., 108(D2), 4040, doi:10.1029/2002JD002378, 2003. 6135
Edwards, D. P., Halvorson, C., and Gille, J.: Radiative transfer modeling for the EOS Terra satellite Measurement of Pollution in the Troposphere (MOPITT) instrument, J. Geophys. Res., 104, 16 755–16 776, doi:10.1029/1999JD900167, 1999. 6131
10
Fiore, A., Jacob, D., Liu, H., Yantosca, R., Fairlie, T., and Li, Q.: Variability in surface ozone background over the United States: Implications for air quality policy, J. Geophys. Res., 108, 4787, doi:10.1029/2003JD003855, 2003. 6134
Fiore, A. M., Jacob, D., Bey, I., Yantosca, R., Field, B., Fusco, A., and Wilkinson, J.: Background ozone over the United States in summer: origin,trend, and contribution to pollution episodes,
15
J. Geophys. Res., 107(D15), 4275, doi:10.1029/2001JD000982, 2002. 6136
Fusco, A. C. and Logan, J. A.: Analysis of 1970-1995 trends in tropospheric ozone at Northern Hemisphere midlatitudes with the GEOS-CHEM model, J. Geophys. Res., D108, doi:10.1029/2002JD002742, 2003. 6136
Heald, C., Jacob, D., Fiore, A., Emmons, L., Gille, J., Deeter, M., Warner, J., Edwards, D.,
20
Crawford, J., Hamlin, A., Sachse, G., Browell, E., Avery, M., Vay, S., Westberg, D., Blake, D., Singh, H., Sandholm, S., Talbot, R., and Fuelberg, H.: Asian outflow and trans-Pacific transport of carbon monoxide and ozone pollution: An integrated satellite, aircraft, and model perspective, J. Geophys. Res., 108(D24), 4808, doi:10.1029/2003JD003507, 2003. 6132
Kurosu, T. P., Chance, K., and Spurr, R. J. D.: CRAG-cloud retrieval algorithm for ESA’s global
25
ozone monitoring experiment, ESA WPP-161, pp. 513–521, eur. Space Res. and Tech Cent., Noordwijk, Netherlands, 1999. 6133
Lelieveld, J., Dentener, F. J., Peters, W., and Krol, M. C.: On the role of hydroxyl radicals in the self-cleansing capacity of the troposphere, Atmos. Chem. Phys., 4, 2337–2344, 2004,
SRef-ID: 1680-7324/acp/2004-4-2337. 6136 30
Li, Q., Jacob, D., Bey, I., Palmer, P., Duncan, B., Field, B., Martin, R., Fiore, A., Yantosca, R., Parrish, D., Simmonds, P., and Oltmans, S.: Transatlantic transport of pollution and its effects on surface ozone in Europe and North America, J. Geophys. Res., 107(D14), 4166,
ACPD
5, 6127–6184, 2005 Case studies of ozone transport in summer 2000 G. Guerova et al. Title Page Abstract Introduction Conclusions References Tables Figures J I J I Back CloseFull Screen / Esc
Print Version Interactive Discussion
EGU doi:10.1029/2001JD001422, 2002. 6129,6136
Li, Q., Jacob, D., Park, R., Wang, Y., Heald, C., Hudman, R., Yantosca, R., Martin, R., and Evans, M.: North American pollution outflow and the trapping of convectively lifted pollu-tion by upper-level anticyclone, J. Geophys. Res., 110, doi:10.1029/2004JD005039, 2005a.
6129,6130,6136,6138,6139,6140 5
Lin, H. and Rood, R.: Multidimensional flux form semi-Lagrangian transport schemes, Mon. Weather Rev., 124, 2046–2070, 1996. 6135
Liu, H., Jacob, D., Bey, I., and Yantosca, R.: Constraints from 210Pb and 7Be on wet deposition and transport in a global three-dimensional chemical tracer model driven by assimilated meteorological fields, J. Geophys. Res., 106, 12 109–12 128, 2001. 6135
10
Martin, R. V., Chance, K., Jacob, D. J., Kurosu, T. P., Spurr, R. J. D., Bucsela, E., Gleason, J. F., Palmer, P. I., Bey, I., Fiore, A. M., Li, Q., Yantosca, R. M., and Koelemeijer, R. B. A.: An improved retrieval of tropospheric nitrogen dioxide from GOME, J. Geophys. Res., 107(D20), 4437, doi:10.1029/2001JD001027, 2002. 6132
Martin, R. V., Jacob, D., Yantosca, R., Chin, M., and Ginoux, P.: Global and Regional
De-15
creases in Tropospheric Oxidants from Photochemical Effects of Aerosols, J. Geophys. Res., 108(D3), 4097, doi:10.1029/2002JD002622, 2003. 6132,6134,6135,6136
Palmer, P. I., Jacob, D., Chance, K., Martin, R., Spurr, R., Kurosu, T., Bey, I., Yantosca, R., Fiore, A., and Li, Q.: Air mass factor formulation for spectroscopic measurements from satel-lites: Application to formaldehyde retrievals from the Global Ozone Monitoring Experiment,
20
J. Geophys. Res., 106, 14 539–14 550, 2001. 6133
Park, R., Jacob, D. J., Field, B. D., Yantosca, R. M., and Chin, M.: Natural and transboundary pollution influences on sulfate-nitrate-ammonium aerosols in the United States: Implications for policy, J. Geophys. Res., 109, doi:10.1029/2003JD004473, 2004. 6134
Richter, A. and Burrows, J.: Tropospheric NO2 from GOME measurements, Adv. Space Res.,
25
29, 1673–1683, 2002. 6132
Spivakovsky, C., Logan, J. A., Montzka, S. A., Balkanski, Y. J., Foreman-Fowler, M., Jones, D. B. A., Horowitz, L. W., Fusco, A. C., Brenninkmeijer, C. A. M., Prather, M. J., Wofsy, S. C., and McElroy, M. B.: Three-dimensional climatological distribution of tropospheric OH: Update and evaluation, J. Geophys. Res., 105, 8931–8980, 2000. 6136
30
Spurr, R. J. D.: Simultaneous derivation of intensities and weighting functions in a general pseudo-spherical discrete ordinate radiative transfer treatment, J. Quant. Spectrosc. Radiat. Transfer, 75, 129–175, 2002. 6133
ACPD
5, 6127–6184, 2005 Case studies of ozone transport in summer 2000 G. Guerova et al. Title Page Abstract Introduction Conclusions References Tables Figures J I J I Back CloseFull Screen / Esc
Print Version Interactive Discussion
EGU Stohl, A.: A 1-year Lagrangian climatology of airstreams in the Northern Hemisphere
tropo-sphere and lowermost stratotropo-sphere, J. Geophys. Res., 106(D7), 7263–7280, 2001. 6130
Stohl, A. and Trickl, T.: A textbook example of long-range transport: Simultaneous observation of ozone maxima of stratospheric and North American origin in the free troposphere over Europe, J. Geophys. Res., 104, 30 445–30 462, 1999. 6129
5
Stohl, A., Eckhardt, S., Forster, C., James, P., and Spichtinger, N.: On the pathways and timescales of intercontinental air pollution transport, J. Geophys. Res., 107(D23), 4684, doi:10.1029/2001JD001396, 2002. 6129
Thouret, V., Marenco, A., Logan, J., N ´ed ´elec, P., and Grouhel, C.: Comparisons of ozone measurements from the MOZAIC airborne program and the ozone sounding network at eight
10
locations, J. Geophys. Res., 103(D19), 25 695–25 720, 1998. 6134
Wang, Y., Jacob, D., and Logan, J.: Global simulation of tropospheric ozone-NOx-Hydrocarbon chemistry, J. Geophys. Res., 103, 10 713–10 768, 1998a. 6135
Wang, Y., Jacob, D., and Logan, J.: Global simulation of tropospheric O3-NOx-hydrocarbon chemistry 1. Model formulation, J. Geophys. Res., 103(D9), 10 713–10 726, 1998b. 6135 15
Wesely, M.: Parameterization of surfaceresistance to gaseous dry deposition in regional-scale numerical models, Atmos. Environ., 23, 1293–1304, 1989. 6135
Wild, O., Zhu, Q., and Prather, M.: Fast-J: Accurate simulation of in- and below-cloud photolysis in global chemical models, J. Atmos. Chem., 37, 245–282, 2000. 6135
Zellweger, C., Forrer, J., Hofer, P., Nyeki, S., Schwarzenbach, B., Weingarter, E., Ammann, M.,
20
and Baltensperger, U.: Partitioning of reactive nitrogen (NOy) and dependence on meteoro-logical conditions in the free troposphere, Atmos. Chem. Phys., 3, 779–796, 2003,
ACPD
5, 6127–6184, 2005 Case studies of ozone transport in summer 2000 G. Guerova et al. Title Page Abstract Introduction Conclusions References Tables Figures J I J I Back CloseFull Screen / Esc
Print Version Interactive Discussion
EGU Table 1. Statistical quantities for CO and NO2 calculated between monthly mean columns
from GEOS-CHEM, MOPITT and GOME in summer 2000. The GEOS-CHEM CO column is transformed as described in Sect. 2.1.
June 2000 July 2000 August 2000 MOPITT mean [molec cm−2] 1.6 1018 1.4 1018 1.4 1018 CO column bias [molec cm−2] 1.1 1017(7%) 3.0 1017(21%) 3.0 1017 (21%) CO column std [molec cm−2] 1.2 1017 2.3 1017 3.1 1017
CO column corr. coeff. (r) 0.59 0.62 0.72
GOME mean [molec cm−2] 7.6 1014 7.3 1014 9.2 1014 NO2column bias [molec cm
−2
] −2.4 1014(−32%) −3.0 1014(−42%) −3.5 1014 (−38%) NO2column std [molec cm
−2
] 4.9 1014 5.8 1014 5.8 1014
ACPD
5, 6127–6184, 2005 Case studies of ozone transport in summer 2000 G. Guerova et al. Title Page Abstract Introduction Conclusions References Tables Figures J I J I Back CloseFull Screen / Esc
Print Version Interactive Discussion
EGU Table 2. Statistical quantities calculated between O3 from GEOS-CHEM and MOZAIC for
i) tropospheric column (surface to 300 hPa), ii) PBL (surface to 800 hPa) and iii) FT (800 to 300 hPa). The values were calculated using all the individual profiles at Paris, Brussels and Frankfurt in summer 2000.
June 2000 July 2000 August 2000 summer 2000 i) all levels: from surface to 300 hPa
MOZAIC mean [ppb] 52.1 48.1 48.5 49.6
bias [ppb] −2.1 (−4%) −2.9 (−5%) −2.0 (−4%) −2.3 (−4%)
corr. coeff. (r) 0.66 0.71 0.71 0.69
ii) all levels in PBL: from surface to 800 hPa
MOZAIC PBL mean [ppb] 44.6 35.5 40.6 40.2
PBL bias [ppb] 0.9 (2%) 4.2 (12%) 2.0 (5%) 3.4 (6%)
PBL corr. coeff. (r) 0.64 0.54 0.69 0.62
iii) all levels in FT: from 800 to 300 hPa
MOZAIC FT mean [ppb] 60.6 61.9 57.2 59.9
FT bias [ppb] −5.3 (−9%) −9.70 (−16%) −6.5 (−11%) −7.2 (−12%)
ACPD
5, 6127–6184, 2005 Case studies of ozone transport in summer 2000 G. Guerova et al. Title Page Abstract Introduction Conclusions References Tables Figures J I J I Back CloseFull Screen / Esc
Print Version Interactive Discussion
EGU (a)
(b)
Fig. 1. Monthly mean CO column in June 2000 from: (a) GEOS-CHEM (transformed) and (b) MOPITT.(c) scatter plot GEOS-CHEM vs. MOPITT.
ACPD
5, 6127–6184, 2005 Case studies of ozone transport in summer 2000 G. Guerova et al. Title Page Abstract Introduction Conclusions References Tables Figures J I J I Back CloseFull Screen / Esc
Print Version Interactive Discussion EGU a.) b.) c.)
Fig. 1. Monthly meanCOcolumn in June 2000 from: a.) GEOS-CHEM (transformed) and b.)
MOPITT. c.) scatter plot GEOS-CHEM vs MOPITT.
27
(c) Fig. 1. Continued.
ACPD
5, 6127–6184, 2005 Case studies of ozone transport in summer 2000 G. Guerova et al. Title Page Abstract Introduction Conclusions References Tables Figures J I J I Back CloseFull Screen / Esc
Print Version Interactive Discussion EGU a.) b.) c.)
Fig. 2. Mean cloud-filtered troposphericNO2columns in June 2000 from: a.) GEOS-CHEM 28
(a)
a.)
b.)
c.)
Fig. 2. Mean cloud-filtered troposphericNO2columns in June 2000 from: a.) GEOS-CHEM
and b.) GOME. c.) scatter plot GEOS-CHEM vs GOME.
28
(b)
Fig. 2. Mean cloud-filtered tropospheric NO2 columns in June 2000 from: (a) GEOS-CHEM and(b) GOME. (c) scatter plot GEOS-CHEM vs. GOME.
ACPD
5, 6127–6184, 2005 Case studies of ozone transport in summer 2000 G. Guerova et al. Title Page Abstract Introduction Conclusions References Tables Figures J I J I Back CloseFull Screen / Esc
Print Version Interactive Discussion EGU a.) b.) c.)
Fig. 2. Mean cloud-filtered troposphericNO2 columns in June 2000 from: a.) GEOS-CHEM
and b.) GOME. c.) scatter plot GEOS-CHEM vs GOME.
28
(c) Fig. 2. Continued.
ACPD
5, 6127–6184, 2005 Case studies of ozone transport in summer 2000 G. Guerova et al. Title Page Abstract Introduction Conclusions References Tables Figures J I J I Back CloseFull Screen / Esc
Print Version Interactive Discussion
EGU (a)
(b)
Fig. 3. Ozone monthly averaged and standard deviation from MOZAIC (dashed line) and GEOS-CHEM (solid line) at Brussels, Paris and Frankfurt in(a) June 2000, (b) July 2000 and (c) August 2000.
ACPD
5, 6127–6184, 2005 Case studies of ozone transport in summer 2000 G. Guerova et al. Title Page Abstract Introduction Conclusions References Tables Figures J I J I Back CloseFull Screen / Esc
Print Version Interactive Discussion
EGU (c)
ACPD
5, 6127–6184, 2005 Case studies of ozone transport in summer 2000 G. Guerova et al. Title Page Abstract Introduction Conclusions References Tables Figures J I J I Back CloseFull Screen / Esc
Print Version Interactive Discussion
EGU (a)
Fig. 4. GEOS-CHEM monthly mean winds at 500 hPa for: (a) June 2000, (b) July 2000, and (c) August 2000.
ACPD
5, 6127–6184, 2005 Case studies of ozone transport in summer 2000 G. Guerova et al. Title Page Abstract Introduction Conclusions References Tables Figures J I J I Back CloseFull Screen / Esc
Print Version Interactive Discussion
EGU (b)
ACPD
5, 6127–6184, 2005 Case studies of ozone transport in summer 2000 G. Guerova et al. Title Page Abstract Introduction Conclusions References Tables Figures J I J I Back CloseFull Screen / Esc
Print Version Interactive Discussion
EGU (c)
ACPD
5, 6127–6184, 2005 Case studies of ozone transport in summer 2000 G. Guerova et al. Title Page Abstract Introduction Conclusions References Tables Figures J I J I Back CloseFull Screen / Esc
Print Version Interactive Discussion
EGU (a)
(b)
Fig. 5. Illustration of LRT1 event: (a) GEOS-CHEM CO column on 13 June, (b) GEOS-CHEM NO2 column on 13 June,(c) MOPITT CO column for 9–13 June, (d) GOME NO2 column on 11–13 June and(e) GEOS-CHEM mean sea level pressure and 500 hPa winds on 13 June.
ACPD
5, 6127–6184, 2005 Case studies of ozone transport in summer 2000 G. Guerova et al. Title Page Abstract Introduction Conclusions References Tables Figures J I J I Back CloseFull Screen / Esc
Print Version Interactive Discussion EGU a.) b.) c.) d.) e.)
Fig. 5. Illustration of LRT1 event: a.) GEOS-CHEMCOcolumn on June 13, b.) GEOS-CHEM
NO2 column on June 13, c.) MOPITTCOcolumn for June 9-13, d.) GOMENO2 column on
June 11-13 and e.) GEOS-CHEM mean sea level pressure and 500 hPa winds on June 13.
31
(c)
a.) b.)
c.) d.)
e.)
Fig. 5. Illustration of LRT1 event: a.) GEOS-CHEMCOcolumn on June 13, b.) GEOS-CHEM
NO2 column on June 13, c.) MOPITTCOcolumn for June 9-13, d.) GOME NO2 column on 31
(d) Fig. 5. Continued.
ACPD
5, 6127–6184, 2005 Case studies of ozone transport in summer 2000 G. Guerova et al. Title Page Abstract Introduction Conclusions References Tables Figures J I J I Back CloseFull Screen / Esc
Print Version Interactive Discussion EGU a.) b.) c.) d.) e.)
Fig. 5. Illustration of LRT1 event: a.) GEOS-CHEMCOcolumn on June 13, b.) GEOS-CHEM NO2 column on June 13, c.) MOPITTCOcolumn for June 9-13, d.) GOMENO2 column on June 11-13 and e.) GEOS-CHEM mean sea level pressure and 500 hPa winds on June 13.
(e) Fig. 5. Continued.