UNIVERSITÉ DE MONTRÉAL
PHOSPHORUS TREATMENT BY STEEL SLAG FILTERS MODELLING OF REMOVAL MECHANISMS AND APPLICATION FOR
PHOSPHORUS REMOVAL FROM SEPTIC TANK EFFLUENTS
DOMINIQUE CLAVEAU-MALLET
DÉPARTEMENT DES GÉNIES CIVIL, GÉOLOGIQUE ET DES MINES ÉCOLE POLYTECHNIQUE DE MONTRÉAL
THÈSE PRÉSENTÉE EN VUE DE L’OBTENTION DU DIPLÔME DE PHILOSOPIAE DOCTOR
(GÉNIE CIVIL) JUIN 2017
UNIVERSITÉ DE MONTRÉAL
ÉCOLE POLYTECHNIQUE DE MONTRÉAL
Cette thèse intitulée :
PHOSPHORUS TREATMENT BY STEEL SLAG FILTERS MODELLING OF REMOVAL MECHANISMS AND APPLICATION FOR
PHOSPHORUS REMOVAL FROM SEPTIC TANK EFFLUENTS
présentée par : CLAVEAU-MALLET Dominique
en vue de l’obtention du diplôme de : Philosophiae Doctor a été dûment acceptée par le jury d’examen constitué de :
M. BAUDRON Paul, Ph. D., président
M. COMEAU Yves, Ph. D., membre et directeur de recherche
M. COURCELLES Benoît, Doctorat, membre et codirecteur de recherche M. CLÉMENT Bernard, Ph. D., membre et codirecteur de recherche M. SMITH Scott, Ph. D., membre
REMERCIEMENTS
Merci à mon directeur Yves Comeau pour m’avoir accueilli dans son équipe en 2009 et pour m’avoir permis de réaliser ce projet de doctorat. Merci plus particulièrement pour trois choses qui ont été importantes pour moi, d’abord la confiance qui m’a été portée et les opportunités de travailler sur des projets variés, ensuite la flexibilité parce que j’ai eu deux enfants durant mes études supérieures, et finalement l’opportunité d’aller au congrès WWTmod 2016. Ce congrès a eu une grande importance pour mon projet de doctorat et pour le développement de mon expertise. Merci à mon codirecteur Benoît Courcelles d’avoir participé dans ce projet, plus particulièrement pour le développement des équations de précipitation dans le modèle. Mes réunions avec Benoît formaient des étapes de validation importantes, en plus de fournir de nouvelles stratégies de modélisation. Merci à mon codirecteur Bernard Clément qui a participé au projet pour la validation statistique des fonctions d’épuisement.
Merci à Philippe Pasquier, professeur en génie géologique, pour sa participation dans ce projet. En tant que membre de mon examen prédoctoral, Philippe a posé une question de modélisation géochimique pour une application de géothermie qui a grandement influencé le développement de mon modèle. De plus, sa participation dans l’élaboration de la méthode d’inversion pour la calibration des essais cinétiques s’est avérée essentielle. Merci à Fanny Eppner, étudiante au doctorat sous la supervision de Philippe Pasquier, avec qui j’ai eu plusieurs discussions sur la modélisation. Fanny a travaillé sur le développement d’un modèle thermo-hydro-géochimique pour la géothermie; son projet impliquait des défis qui étaient complémentaires au mien et c’était toujours intéressant et utile d’en discuter.
Merci à Étienne Boutet, Félix Lida et Serge Baillargeon, de la compagnie Bionest, pour leur participation dans ce projet. J’ai travaillé étroitement avec Bionest durant trois ans et le développement de mon modèle en a beaucoup profité. J’ai beaucoup apprécié l’ouverture d’esprit chez Bionest et la bonne collaboration entretenue, et c’était motivant de voir que mon travail pouvait mener au développement d’une technologie de traitement concrète.
Merci à Patricia Bove, étudiante à la maîtrise, avec qui j’ai travaillé étroitement de 2015 à 2017. J’ai partagé avec Patricia l’entretien et l’opération des essais de filtres à scories au laboratoire, puisqu’elle les utilisait pour son projet de neutralisation. J’ai également travaillé avec elle sur les
aspects de modélisation de son projet de maîtrise. Patricia est une collègue de travail agréable, intelligente et efficace. J’ai beaucoup apprécié travailler avec elle.
Merci aux techniciens de laboratoire qui ont contribué à ce projet. Merci à Denis Bouchard pour les analyses de phosphore et carbone, et pour son soutien technique dans toutes sortes de situations. Merci à Mélanie Bolduc et Jérôme Leroy pour leur soutien apporté au laboratoire. Merci à Manon Leduc pour les analyses de calcium et métaux. Merci aux étudiants et techniciens qui m’ont aidé à l’installation et au démantèlement de mes colonnes de scories : Sanaz Alizadeh, Xavier Lachapelle-Trouillard, Patricia Bove, Denis Bouchard, Sophie Levesque, Charles Élysée et Pierre-Antoine Maloin.
Merci aux collègues avec qui j’ai eu la chance de travailler de près ou de loin sur des projets de filtres à scories. Un merci spécial à Claire Dacquin, Simon Allaire, Simon Amiot, stagiaires de premier cycle, qui ont réalisé bon nombre d’essais cinétiques pour mon projet de doctorat. Merci également aux stagiaires qui ont réalisé des projets complémentaires à mon projet de doctorat; Brice Siroux (précipitation dans les champs d’infiltration), Aurore Bordier (précipitation dans les filtres à scories) et Alexandra Païs (précipitation dans les filtres à scories). Merci à Anna Staingart et Zakariae Anjab, étudiants à la maîtrise, qui ont réalisé des projets sur les filtres à scories qui m’ont aidé à développer mon modèle. Merci à Félix Lida et Patricia Bove, étudiants à la maîtrise, qui ont réalisé les travaux expérimentaux présentés dans l’article #1 et dans la section sur la neutralisation, respectivement. Merci à Margit-Kõiv-Vainik, chercheure invitée, pour m’avoir invitée à participer aux projets des Bobines (article #4), et pour les nombreuses discussions sur les filtres à scories et matériaux réactifs. Merci à Marie Ferland pour les discussions et le développement de l’expertise sur les essais de traceur. Merci à Dominic Vallerand avec qui j’ai travaillé sur la rédaction d’un article de transfert sur les filtres à scories dans la revue Vecteur Environnement. Merci à Marc-André Labelle pour les discussions dans les réunions de laboratoire. Merci à Cristian Neagoe, Zhanna Grebenshchykova et Xavier Lachapelle-Trouillard pour les discussions sur le projet PhytoValP.
Merci à mes collègues étudiants qui ont rendu la vie à Polytechnique très agréable : Marie Ferland, Marie-Laure De Boutray, Catherine Brosseau, Sanaz Alizadeh et Sophie Lévesque. Merci plus particulièrement à Sophie, qui partageait mon bureau avec ses sujets de discussion variés, et Sanaz, avec les coffee break qui brisaient le rythme rapide du quotidien.
Merci aux professeurs et étudiants gradués du programme de génie géologique pour les discussions du midi : Félix Gervais, Denis Marcotte, Michel Chouteau, Philippe Pasquier, Pierre Bédard, Paul Baudron, Manon Leduc, Jérôme Leroy, Fanny Eppner, Éric Chou, Pascale Brunet et Bernard Dusseault. J’ai toujours passé mes heures de dîner en génie géologique, j’aimais discuter de projets de ce domaine, je trouvais que ça maintenait mon esprit élargi tout en changeant de la routine du traitement des eaux, avec des gens sympathiques.
Merci à Manon Latour, agente aux dossiers étudiants, pour son aide dans toutes les étapes administratives de ce doctorat.
Merci à Jalal Hawari qui m’a aidé à pratiquer ma soutenance de thèse.
Merci au CRSNG pour avoir financé ma bourse d’étude, et aussi pour avoir financé le projet. Finalement, merci à mon conjoint Mathieu Bélisle, qui m’a donné un soutien inconditionnel durant toute la durée de mes études supérieures, et à mes enfants Rosanne et Antoine, qui sont deux petits soleils.
RÉSUMÉ
Le premier objectif de cette thèse était de proposer un système de traitement du P incluant un filtre à scories intégré à une chaîne de traitement de fosse septique et élément épurateur. L’utilisation d’un filtre à scories en recirculation dans la fosse septique a été étudiée (article #1). Deux modes de recirculation ont été testés. Le meilleur système a été la recirculation du 2e compartiment vers le 1er compartiment à 50% de recirculation, avec 4.2 et 1.9 mg P/L à l’effluent en P total et ortho-phosphates, respectivement. La cible de 1 mg /L à l’effluent n’a pas été atteinte, mais l’ajout du filtre à scories a permis la rétention de 79% du phosphore, comparativement à 29% sans filtre. Le deuxième objectif de cette thèse était de proposer un modèle d’enlèvement du P dans les filtres à scories qui permette la prédiction de la longévité et de l’efficacité d’enlèvement par simulations numériques. Un programme de recherche incluant quatre projets a été entrepris. Dans le premier projet (article #2), des filtres à scories ont été opérés au laboratoire afin de caractériser leur utilisation potentielle pour le traitement d’un lixiviat minier. Une méthode préliminaire de caractérisation expérimentale des scories a été développée. Les résultats ont montré que la précipitation en hydroxyapatite et la croissance de cristaux étaient les mécanismes responsables de l’enlèvement du P. Dans le deuxième projet, un modèle numérique préliminaire incluant des équations pour l’épuisement des scories et la précipitation de l’hydroxyapatite a été développé (article #3). Les fonctions d’épuisement des scories ont été mesurées à partir d’essais cinétiques en flacon et des simulations numériques avec le logiciel PHREEQC ont été réalisées. Les résultats de simulation ont montré un comportement typique d’un filtre à scories, avec l’arrivée d’une percée (sans calibration expérimentale). Dans le troisième projet (article #4), le modèle numérique préliminaire a été validé en reproduisant des données expérimentales réelles. Pour ce faire, des simulations PHREEQC ont été réalisées et comparées avec les données d’un essai pilote de traitement d’effluent piscicole. L’épuisement des scories et le changement d’affluent ont été reproduits. Dans le quatrième projet (article #5), le modèle numérique préliminaire a été raffiné avec une équation pour la diffusion dans une barrière de précipités et des équations pour séparer la précipitation homogène et hétérogène. Des essais cinétiques ont été réalisés afin de raffiner la méthode de mesure des fonctions d’épuisement. Un essai de filtre à scories en colonne a été réalisé au laboratoire pour calibrer le modèle. Les simulations numériques réalisées avec le logiciel PHREEQC ont reproduit avec précision les résultats expérimentaux de phosphore et pH. Le modèle proposé P-Hydroslag pourrait être utilisé pour la conception de filtre à scories.
ABSTRACT
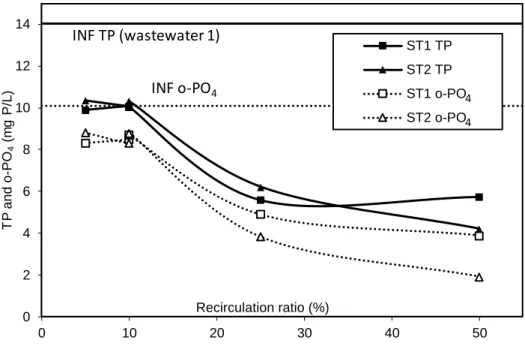
The first objective of this thesis was to propose a phosphorus treatment system based on a steel slag filter integrated to a septic tank-infiltration bed system. The use of a recirculating steel slag filter was studied in an experimental program (paper #1). Two recirculation modes with various recirculation ratios were tested. The best system was the one with a recirculation from the end to the inlet of the second compartment of a septic tank with a 50% recirculation ratio in the slag filter, achieving 4.2 and 1.9 mg P/L at the effluent for TP and o-PO4, respectively. The 1 mg P/L level
goal was not reached, but 79% of phosphorus was kept in the system, compared to 29% without the slag filter.
The second objective of this thesis was to propose a phosphorus removal mechanism model for steel slag filters usable to predict its efficiency and longevity by numerical simulations. A research program including four projects was realized. In the first project (paper #2), steel slag filters were operated in the laboratory to characterize their potential utilization to a mine leachate. A preliminary experimental slag characterization method was developed. Results showed that precipitation into hydroxyapatite and crystal growth following pH rise and oversaturation were mechanisms responsible for phosphorus removal.
In the second project, a preliminary numerical model including equations for slag exhaustion and hydroxyapatite precipitation was developed (paper #3). Slag exhaustion functions were measured by batch kinetic tests and numerical simulations were performed with the PHREEQC software. Simulation results showed a typical steel slag filter behavior, with a breakthrough curve (without experimental calibration). In the third project, (paper #4), the preliminary numerical model was validated by reproducing real experimental data. Simulations were realized with PHREEQC and they were compared with data from a pilot test of fish farm effluent treatment with steel slag filters. Slag exhaustion and influent changes were correctly reproduced by simulations.
In the fourth project (paper #5), the preliminary numerical model was refined with an equation for diffusion through a crystal barrier and equations for separating homogeneous and heterogeneous precipitation. Batch kinetic tests were performed to refine the measurement method of exhaustion functions. A steel slag filter experiment was realized in laboratory for model calibration. Numerical simulations conducted with PHREEQC reproduced with precision pH and ortho-phosphate experimental results. The proposed P-Hydroslag model could be used for design of steel slag filters.
TABLE OF CONTENTS
REMERCIEMENTS ... III RÉSUMÉ ... VI ABSTRACT ...VII TABLE OF CONTENTS ... VIII LIST OF TABLES ... XV LIST OF FIGURES ... XVII LIST OF SYMBOLS AND ABBREVIATIONS... XXII
CHAPTER 1 INTRODUCTION ... 1
Objectives of the thesis ... 1
Content of this thesis ... 3
CHAPTER 2 CONTEXT AND LITERATURE REVIEW ... 7
2.1 Applications of steel slag filters for phosphorus removal in autonomous decentralized treatment ... 7
2.1.1 Established scientific knowledge in steel slag filtration ... 7
2.1.2 Regulatory context of autonomous and decentralized treatment in Quebec ... 8
2.1.3 Two approaches for upgrading phosphorus retention with slag filters in isolated dwellings systems ... 10
2.1.4 Phosphorus retention in steel slag filter ... 12
2.1.5 Phosphorus retention in septic tank ... 12
2.1.6 Phosphorus retention in an infiltration bed ... 13
2.2 Modeling concepts relevant for steel slag modeling ... 13
2.2.1 Hydraulic models for porous media ... 14
2.2.2 Physicochemical models in wastewater treatment ... 18
CHAPTER 3 ARTICLE 1: IMPROVING PHOSPHORUS REMOVAL OF
CONVENTIONAL SEPTIC TANKS BY A RECIRCULATING STEEL SLAG FILTER ... 27
3.1 Introduction ... 27
3.2 Materials and Methods ... 29
3.2.1 Experimental Unit ... 29
3.2.2 Slag Media and Wastewater Characteristics ... 30
3.2.3 Analytical Determinations ... 31
3.2.4 Calculations for Full-Scale Application ... 31
3.3 Results ... 31
3.3.1 Wastewater composition monitoring ... 31
3.3.2 Phosphorus mass balance ... 34
3.4 Discussion ... 36
3.4.1 P Removal Performance and Selection of the Best System ... 36
3.4.2 Application to a Full-Scale System ... 37
3.5 Conclusion ... 40
3.6 Acknowledgements ... 40
3.7 References ... 40
CHAPTER 4 GENERAL DISCUSSION AND RECOMMENDATIONS RELATED TO STEEL SLAG FILTERS APPLICATIONS IN AUTONOMOUS AND DECENTRALIZED TREATMENT ... 42
4.1 Critical discussion regarding the thesis objective ... 42
4.2 Phosphorus fractionation in the system ... 43
4.3 Comparison of all-inflow (tertiary treatment unit) and recirculating (filters added to existing tanks) approaches ... 46
CHAPTER 5 ARTICLE 2: REMOVAL OF PHOSPHORUS, FLUORIDE AND METALS
FROM A GYPSUM MINING LEACHATE USING STEEL SLAG FILTERS... 50
5.1 Introduction ... 51
5.2 Materials and Methods ... 52
5.2.1 Reconstituted leachates and tested media ... 52
5.2.2 Column tests ... 53
5.2.3 Analytical determinations ... 54
5.2.4 Toxicity tests ... 55
5.3 Results ... 56
5.4 Discussion ... 58
5.4.1 Efficiency and longevity of filters ... 58
5.4.2 Fluoride and metals removal ... 61
5.4.3 Crystal growth ... 63 5.5 Conclusion ... 65 5.6 Acknowledgements ... 65 5.7 Appendix A ... 66 5.8 Appendix B ... 66 5.9 References ... 67
CHAPTER 6 ARTICLE 3: PHOSPHORUS REMOVAL BY STEEL SLAG FILTERS: MODELING DISSOLUTION AND PRECIPITATION KINETICS TO PREDICT LONGEVITY ... 70
6.1 Introduction ... 70
6.2 Material and methods ... 71
6.2.1 Slag media ... 71
6.2.3 PHREEQC modeling ... 73
6.3 Results and discussion ... 76
6.3.1 Batch test results: model application ... 76
6.3.2 Analysis of precipitation hypothesis ... 78
6.3.3 Using the model to predict filter longevity ... 80
6.3.4 Research needs ... 84
6.3.5 Practical design strategy for the prediction of slag filter longevity ... 86
6.4 Associated content ... 87 6.4.1 Supporting Information ... 87 6.5 Author information ... 87 6.6 Acknowledgements ... 87 6.7 Abbreviations ... 87 6.8 References ... 88
CHAPTER 7 TREATMENT OF FISH FARM SLUDGE SUPERNATANT BY AERATED FILTER BEDS AND STEEL SLAG FILTERS - EFFECT OF ORGANIC LOADING RATE . 91 7.1 Introduction ... 91
7.2 Material and Methods ... 93
7.2.1 Site description ... 93
7.2.2 Experimental design ... 95
7.2.3 Filter materials ... 97
7.2.4 Sampling and analytical methods ... 97
7.2.5 Numerical simulations ... 97
7.3 Results and discussion ... 98
7.3.1 Removal of organic matter, solids and nitrogen ... 98
7.3.3 Preliminary design of the hybrid treatment system ... 106
7.4 Conclusions ... 109
7.5 Acknowledgements ... 111
7.6 Appendix A. Supplementary data ... 111
7.7 References ... 114
CHAPTER 8 ARTICLE 4: NUMERICAL SIMULATIONS WITH THE P-HYDROSLAG MODEL TO PREDICT PHOSPHORUS REMOVAL BY STEEL SLAG FILTERS ... 117
8.1 Introduction ... 117
8.2 Material and Methods ... 119
8.2.1 Slag media ... 119
8.2.2 Column test ... 119
8.2.3 Batch kinetic tests ... 121
8.2.4 Model description ... 121
8.2.5 Numerical simulations ... 125
8.3 Results and discussion ... 127
8.3.1 Determination of exhaustion equations and precipitation constants ... 127
8.3.2 Column test calibration ... 129
8.3.3 Validation of model hypothesis ... 131
8.3.4 Model limits and recommendations ... 132
8.4 Appendix ... 133
8.5 Acknowledgment ... 136
8.6 Abbreviations ... 137
8.7 References ... 140
CHAPTER 9 GENERAL DISCUSSION AND RECOMMENDATIONS REGARDING THE P-HYDROSLAG MODEL ... 144
9.1 Main steps of model development ... 144
9.1.1 What are the involved phenomena in steel slag filters? ... 144
9.1.2 How could phosphorus removal mechanisms in slag filters be transposed into a mathematical model? ... 148
9.1.3 Now there is a numerical model. Will it work? ... 149
9.1.4 How much more complex should the model be? ... 149
9.1.5 How model hypotheses could be validated? ... 151
9.1.6 How should the model be integrated to the existing wastewater modeling community? ... 152
9.2 Development of a modeling strategy ... 152
9.2.1 Step 1: chemical model ... 153
9.2.2 Step 2: hydraulic model ... 153
9.2.3 Step 3: calibration of influent ... 153
9.2.4 Step 4: Simulate ... 155
9.3 Modeling steel slag filters for industrial needs ... 155
9.3.1 Longevity prediction and effect of alkalinity ... 155
9.3.2 Effect of atmospheric CO2 ... 156
9.3.3 Effect of short-circuiting ... 159
9.4 Model development applied to neutralization processes ... 161
9.4.1 Description of the neutralization unit experimental setup ... 162
9.4.2 Chemical model for the neutralization process ... 162
9.4.3 Hydraulic calibration of neutralization reactors ... 163
9.4.4 Calibration of the neutralization model ... 164
9.4.5 Impact of the neutralization process modeling study ... 166
9.5 Research needs for the P-Hydroslag model ... 168 CHAPTER 10 CONCLUSION ... 170 REFERENCES ... 172
LIST OF TABLES
Table 1.1 : Content of chapters 5 to 9 ... 5
Table 1.2 : Relative contribution of the Ph.D. candidate in each paper ... 6
Table 2.1 : Discharge criteria for five treatment categories applicable in Quebec regulation (MDDEP, 2009a) ... 9
Table 2.2 : Hydraulic parameters for the TIS and PHREEQC ADR models ... 17
Table 2.3 : Example of Gujer matrix construction for calcite precipitation ... 19
Table 2.4 : Equilibrium reactions in the closed carbonate system ... 20
Table 3.1 : Experimental program ... 30
Table 3.2 : Reconstituted water composition ... 30
Table 3.3 : Parameters for equations 3.1 and 3.2 ... 31
Table 3.4 : Application of the proposed system to an isolated two-bedromm dwelling ... 38
Table 3.5 : P retention capacity obtained in previous studies conducted with the same slag ... 39
Table 4.1 : Development and operational issues related to new tertiary treatment slag filter units VS improved existing tanks with recirculating slag filters ... 46
Table 4.2 : o-PO4 mass balance comparison between options 1 and 2 ... 47
Table 5.1 : Composition of reconstituted leachates ... 53
Table 5.2 : Chemical composition of tested slags ... 54
Table 5.3 : Mineralogical composition of tested slags ... 55
Table 5.4 : Toxicity tests results using acetic acid (TCLP) and distilled water as extraction fluid ... 58
Table 5.5 : Contaminants retention for column tests ... 59
Table 7.1 : Summary of design parameters of the experimental filter units in Phase 1 (P1) and Phase 2 (P2). Abbreviations: AFB1 and AFB2 – two parallel aerated filter beds; SF – sacrificial slag
filter; SC1, SC2, SC3 – three parallel dual-stage steel slag columns ... 95
Table 7.2 : Composition of simulated influent solutions of the slag columns (AFBs effluent feeding the SF and SF effluent feeding the SCs) ... 98
Table 7.3 : Preliminary full-scale design parameters for the treatment of low (P1) and high strength (P2) supernatant of a freshwater fish farm sludge settling tank, consisting of a) an aerated filter bed (AFB) and b) a reactive slag filter ... 107
Table 7.4 : Chemical composition of EAF steel slag and quartzite gravel used in our experiment ... 111
Table 7.5 : Average composition of the fish farm sludge supernatant and the effluent concentrations of all filter units during Phases 1 and 2 (P1 and P2; units in mg L-1, except for pH; SD marked with “±”). Abbreviations: SILO – fish farm sludge supernatant; AFBcb – combined effluent of aerated filter beds; SF – effluents of sacrificial slag filter during different periods; SC1B, SC2B, SC3B – effluents of steel slag columns with different HRTV ... 112
Table 8.1 : Apparent HAP solubility from reported alkaline filter effluent with pH≥10, based on reported pH, Ca and o-PO4 concentrations ... 123
Table 8.2 : Batch test inversion parameters for conjugate gradient method ... 126
Table 8.3 : P-Hydroslag model matrix ... 134
Table 9.1 : MATLAB output for the influent calibration step of the column test ... 154
Table 9.2 : CO2 transfer equations added to the model ... 157
Table 9.3 : Influence of HRTV and CO2 contact on longevity prediction of a slag filter ... 159
Table 9.4 : Neutralization model equations ... 163
LIST OF FIGURES
Figure 2.1: Common treatment systems in autonomous and decentralized treatment. A and B: effluent management by infiltration, C and D: effluent management by discharge ... 9 Figure 2.2: Slag filter configuration with 100% septic tank effluent is sent to a slag filter prior to
the infiltration bed ... 11 Figure 2.3 : Possible recirculating configurations. A : recirculation withing second compartment,
B : recirculation from second to first compartment ... 12 Figure 2.4: Relationship between ortho-phosphates and pH at a steel slag filter effluent (Claveau-Mallet et al., 2012) ... 13 Figure 2.5 : Schematic representation of the PHREEQC double porosity module for ID transport
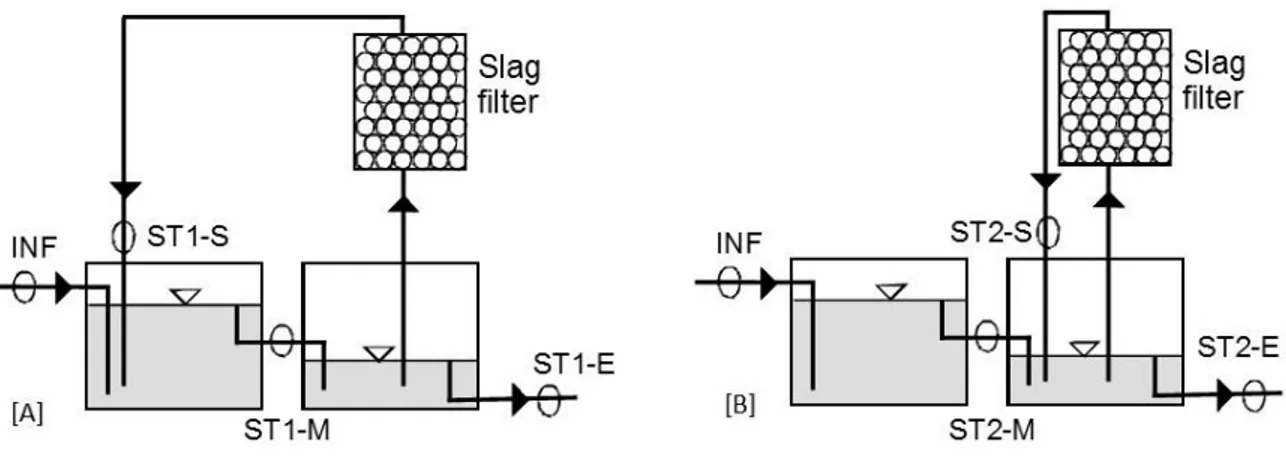
in a 6-cell column ... 16 Figure 2.6 : Calibration of a tracer test using the TIS and the PHREEQC ADR models ... 17 Figure 3.1 : Schematic of the experimental unit showing recirculation from compartment 2 to 1 (a)
and from compartment 2 to 2 (b). Sampling points and their label are identified on the schematic by circles ... 29 Figure 3.2 : COD (a), TSS (b) and VSS (c) monitoring of the pilot unit ... 33 Figure 3.3 : TP (a), o-PO4 (b) and pH (c) monitoring of the pilot unit ... 33
Figure 3.4 : Alkalinity (a), calcium (b) and conductivity (c) monitoring of the pilot unit. Recirculation phases (5, 10, 25, 50 and 10%) are indicated with vertical lines. The transition from wastewater 1 to wastewater 2 is indicated by the grey dotted line ... 34 Figure 3.5 : TP fluxes (units in g) for the whole duration of the experiment in system 1(a) and 2
(b). Fluxes are indicated next to arrows. Accumulated P measured at the end of the experiment is indicated in each compartment ... 35 Figure 3.6 : Relationship between mean P concentration at the effluent of the pilot unit and
recirculation ratio ... 36 Figure 3.7 : Recommended system (system 2 with 50% recirculation in the slag filter) and selected
Figure 4.1 : o-PO4-pH relationship in the septic tank compared to previous steel slag filter data 44
Figure 4.2 : theoretical o-PO4 concentration in a groundwater in equilibrium with hydroxyapatite
(A) and theoretical needed pH for achieving 1 mg P/L o-PO4 in a groundwater in equilibrium
with hydroxyapatite (B) ... 45
Figure 5.1 : Schematic of the column tests experimental setup and operational conditions ... 56
Figure 5.2 : Selected column tests results : pH (A), Al(B), o-PO4 (C and D) and F (E and F). The letter A or B besides the column refers to upstream (A) or downstream (B) position of the series of columns. The average influent concentration is shown on the vertical axis for the L1 (empty star) and L2 (full star) leachates ... 57
Figure 5.3 : Effluent concentrations of an efficient slag filter (two successive FS slag filters operated at a total HRTV of 24) compared with the influent and actual effluent concentrations of the lime treatment plant ... 60
Figure 5.4 : Schematic of the proposed slag filter design for the Joplin mining leachate phosphorus removal ... 60
Figure 5.5 : Relationship between effluent o-PO4 and pH ... 61
Figure 5.6 : Relationship between fluoride and pH in column effluent ... 62
Figure 5.7 : Apatite growth in upstream filters ... 64
Figure 5.8 : Relationship between manganese and pH in column effluent ... 66
Figure 5.9 :Relationship between zinc and pH in column effluent ... 66
Figure 6.1 : Comparison of batch test experimental and simulated results for pH (A), phosphorus (B) and calcium (C). Simulated results are represented with lines and experimental results with circles, plus or X symbols ... 77
Figure 6.2 : Effect of different precipitation hypotheses on simulated batch test results at an initial P concentration of 50 mg P/L (A) and evolution of phosphorus precipitates concentration in simulated batch tests (B) ... 78
Figure 6.3 : Effect of water/slag ratio on slag dissolution kinetic parameters. Dotted lines represent typical ratio values in slag filters (0.3 mL1gl left line) and standard batch tests (20 mL/g; right line) ... 80 Figure 6.4 : Slag dissolution exhaustion relationships ... 81 Figure 6.5 : pH (A) and orthophosphates concentration (B) at the outlet of simulated column tests
at HRTV = 16 h and influent NaHCO3 = 0, under various influent P concentrations. The
influent P concentration (mg P/L) of each simulation is indicated next to its curve ... 82 Figure 6.6 : Design graph for prediction of longevity (A) and P retention at longevity (B) based on
simulation results. Simulations with and without initial NaHCO3 are presented in gray and
black, respectively. The HRTV is indicated in the legend. Experimental results from past
studies are presented by squares or elongated squares to indicate that the longevity was greater than the value at the point. HRTV and reference are indicated next to each point. ... 83
Figure 7.1 : Schematic diagram of the fish farm treatment system and experimental system during Phase 1 (P1) and Phase 2 (P2) when the sludge supernatant contained a low (P1) or a high pollutant (P2) concentration. Abbreviations: AFB1 and AFB2 – two parallel aerated filter beds; SF – sacrificial slag filter; SC1A+SC1B, SC2A+SC2B, SC3A+SC3B – three parallel dual-stage steel slag columns with different void hydraulic retention times ... 94 Figure 7.2 : Organic matter removal by the various treatment units (presented as changes in BOD5
and COD values) during Phases 1 and 2 (P1 and P2) of the experiment. Note: The two AFBs and the three sets of two columns in series of SCs were operated in parallel ... 99 Figure 7.3 : Evolution of total suspended solids (TSS) and volatile suspended solids (VSS)
concentration in the combined effluents of the aerated filter beds (AFBcb) effluent during P1
and P2 ... 100 Figure 7.4 : Nitrogen removal and transformation (presented as changes in TKN, NH4-N and NOx
-N concentrations) in the combined effluent of the aerated filter beds (AFBcb) during Phase 1
and 2 (P1; P2) ... 100 Figure 7.5 : Evolution of orthophosphate (o-PO4) during P1 and P2 in the filter units ... 101
Figure 7.6 : Ratio between cumulative total phosphorus (TP) added and removed in steel slag filters (SF and SCs) during Phase 1 and 2 (P1 and P2). All SCs used during P1 continued to be used
during P2, which explains why the first data points at the beginning of P2 (graph B) are not located at the origin of the graph ... 103 Figure 7.7 : Effect of void hydraulic retention time (HRTV) on average orthophosphate (o-PO4)
removal efficiency during P1 (red; low o-PO4 load) and P2 (black; high o-PO4 load) in
sacrificial slag filters (SFs) and dual-stage slag columns (SCs). Error bars denote standard deviations ... 104 Figure 7.8 : Simulation results of the P-Hydroslag model and comparison with experimental data
for A) pH and B) o-PO4. Simulated curves with sacrificial slag filter (SF; solid lines) and
without SF (dotted lines) are shown ... 106 Figure 8.1 : Apparent HAP solubility distribution for all reported studies (pH≥10; 389
observations) ... 124 Figure 8.2 : Example of a batch test calibration. Simulated data is shown with lines. Batch test error
functions: 0.09 for pH and 0.15 for o-PO4 ... 128
Figure 8.3 : Exhaustion functions for kdiss (A) and pHsat (B). Regression coefficients are provided
in text ... 128 Figure 8.4 : Water composition in a column test for cells 1 to 9 (A) and cells 2 to effluent (B).
Experimental data is shown with dots or x and simulated data with lines ... 130 Figure 8.5 : pH distribution within column at the end of operation (623 days of feeding followed
by 6 days of rest) ... 131 Figure 8.6 : SEM picture of slag grain surface from cell 2 at dismantling ... 132 Figure 8.7 : XRD pattern of precipitates sampled in cell #2. Main peaks of HAP and CAL
diffractograms are indicated in the figure ... 133 Figure 8.8 : Tracer test experimental data (circles) and numerical calibration (line) (started at Time
= 187 d of filter operation) ... 135 Figure 9.1 : Representative SEM photography and schematic representation of different
organization levels in filters (unpublished work) ... 147 Figure 9.2 : Comparison of simulation results from different model versions for the Bobines
using preliminary model (complementary paper). Mod data 2017: using complete model from paper #5. Mod data constant seeds: using complete model from paper #4 with 2e21 seed concentration for all cells ... 150 Figure 9.3 : Effect of alkalinity on longevity prediction of a slag filter operated at HRTV = 12 h,
using the preliminary model from paper #3 ... 156 Figure 9.4 : R&D slag filter test conducted at Bionest (schematic provided by Bionest) ... 157 Figure 9.5 : Bionest R&D slag filter effluent composition compared to simulations ... 158 Figure 9.6 : Tracer test calibration for the R&D Bionest slag filter. black: experimental data, red:
simulated data ... 160 Figure 9.7 : Effect of short-circuiting on o-PO4 effluent of the R&D Bionest slag filter ... 161
Figure 9.8 : Tracer test calibration of a neutralization unit (saturated with Bionest media) using the ARD equation. Line: simulated, o: experimental data ... 163 Figure 9.9 : Tracer test validation of a neutralization unit (saturated with no media) using a
completely mixed reactor. Line: simulated, o: experimental data ... 164 Figure 9.10 : Calibration of the neutralization model (configuration saturated, no media).
O: experimental data, x: simulated data ... 164 Figure 9.11 : Effect of media type and feeding mode on CO2 transfer coefficient ... 165
Figure 9.12 : Effect of media type and feeding mode on calcite precipitation coefficient. Dashed curves represent approximate tendendy ... 166 Figure 9.13 : Validation of the neutralization model on a neutralization test conducted by Bionest ... 167
LIST OF SYMBOLS AND ABBREVIATIONS
ADM1 Anaerobic digestion model number 1 ADR Advection-diffusion-reaction
AFB Aerated filter bed
ASM1 Activated sludge model 1 (ASM2, ASM2d and ASM3 are subsequent versions)
BF Blast furnace
BOD5 Biochemical oxygen demand after 5 days BOF Basic oxygen furnace
CAL Calcite
CFD Computational fluid dynamic
COD Chemical oxygen demand
CBOD5 Carbonaceous biochemical oxygen demand after 5 days CSTR Completely stirred tank reactor
EAF Electric arc furnace HAP Hydroxyapatite
HAP_HE Heterogeneous hydroxyapatite HAP_HO Homogeneous hydroxyapatite
HRT Hydraulic retention time
HRTV Hydraulic retention time of voids
HRTVe Efficient hydraulic retention time of voids
MDDEP Ministère du développement durable, de l’environnement et des parcs (Ministry of Environment, Sustainable Development and Parks)
MON Monetite
OLR Organic loading rate o-PO4 Ortho-phosphates
P Phosphorus
SC Slag column
SEM Scanning electronic microscopy SF Sacrificial slag filter
SI Saturation index
SS Suspended solids
TCLP Toxicity characteristic leaching procedure TEM Transmission electronic microscopy TIC Total inorganic carbon
TIS Tanks in series
TKN Total Kjeldahl nitrogen
TP Total phosphorus
TSS Total suspended solids
TW Treatment wetland
VSS Volatile suspended solids XRD X-ray diffraction
CHAPTER 1
INTRODUCTION
Objectives of the thesis
Phosphorus in wastewater is a major environmental concern. Very small phosphorus inputs in the environment is enough for perturbation of ecosystems and occurrence of eutrophication. One important consequence of phosphorus discharge is the formation of cyanobacteria in summer periods, as observed in Quebec’s lakes in the last years (Blais, 2008). Phosphorus discharge in the environment originates from various sources, including agriculture, industry and domestic wastewater. In this project, focus is given to phosphorus in domestic wastewater from isolated or a few houses (autonomous or decentralized treatment, as opposed to centralized treatment with sewers and treatment plants). In Quebec, this type of effluent is typically treated with a septic tank followed by an infiltration bed. The number of septic tanks in Quebec province was estimated at 700 000 in 2002 (Radio-Canada, 2002).
Phosphorus removal in a septic-tank-infiltration-bed system is not regulated and this type of system was not initially designed or intended to remove phosphorus. Septic tanks and infiltration beds are not efficient for long term phosphorus removal, as high concentration (up to 5 mg P/L) were observed in the water table below an infiltration bed (Robertson, Schiff & Ptacek, 1998). Improving the phosphorus retention of such systems is the challenge addressed in this thesis. The proposed solution is through the use of steel slag filters.
Slag is a by-product from iron and steel mills (National Slag Association, 2009) available in various types, size or composition. Electric arc furnace (EAF) steel slag, a particular type of granular alkaline slag, can be used as reactive media for phosphorus capture. This principle was successfully applied in many studies (Barca et al., 2013; Chazarenc et al., 2008; Claveau-Mallet, Wallace, & Comeau, 2013; Drizo et al., 2006; Kõiv et al., 2016; Vohla et al., 2011). For example, total phosphorus concentration as low as 0.1 mg P/L were reached for a fish farm effluent (Kõiv
et al., 2016). The main advantages of steel slag filters are their low capital and operating costs
and their simplicity. Therefore, it would be interesting to use steel slag filters for septic tank effluent treatment. This technological challenge brings us to the first objective of this thesis.
OBJECTIVE 1: Propose a phosphorus treatment system based on a steel slag filter integrated to a septic-tank-infiltration-bed system. The system must fulfill the following criteria:
Maximum total phosphorus effluent concentration of 1 mg P/L. This value was set from the Quebec discharge criteria for tertiary treatment systems (MDDEP, 2009b).
Effluent total suspended solids (TSS) and carbonaceous biochemical oxygen demand (CBOD5) must meet discharge criteria for a secondary treatment system (30 and 25 mg/L,
respectively).
Two-year longevity without any human intervention for septic tank and steel slag filter. This period corresponds to the required maintenance frequency for a septic tank receiving less than 3240 L/d of domestic wastewater in Quebec (MDDEP, 2009a).
Low capital and operating costs. 500 $ (2017 CAD) per two years is the target cost. As mentioned previously, steel slag filters were largely used in research studies for phosphorus treatment, but they are rarely used in full-scale projects. There are no regulations nor certifications regarding their utilization. One important issue preventing this is the wide efficiency variability reported by different teams who studied them (Vohla et al., 2011). There is no clear consistent estimated P removal capacity of steel slag filter within studies and it is not possible to predict longevity and removal efficiency of the filter. A better understanding of phosphorus removal mechanisms in steel slag filters would help to elucidate this problem. The second objective of this thesis is related to this issue.
OBJECTIVE 2: Propose a phosphorus removal mechanism model for steel slag filters, including the following properties:
The model must be compatible with a simulation software including features for transport in porous media, kinetic reactions and chemical equilibrium.
The model should be based on slag dissolution and precipitation of phosphorus minerals, and on the evolution of filter hydraulic properties following the accumulation of precipitates. A preliminary model proposed by the candidate (Claveau-Mallet, Wallace, & Comeau, 2012) will be the starting point.
Content of this thesis
This paper-based thesis includes one published paper related to objective 1 and four papers related to objective 2 (three published and one submitted). The first chapter presents a literature review including one section for each objective. Literature review for objective 1 is focused on potential applications of steel slag filters in autonomous and decentralized treatment while that for objective 2 presents relevant modeling concepts for hydraulics and physicochemical treatment. Two chapters are focused on objective 1. Paper #1, presented in chapter 2, presents a complete study of septic tank upgrade with recirculating steel slag filters, followed by a general discussion on objective 1 in chapter 3. The complete reference for paper #1 is:
Claveau-Mallet, D., Lida, F. & Comeau, Y. (2015). Improving phosphorus removal of conventional septic tanks by a recirculating steel slag filter. Water Quality Research Journal of
Canada, 50(3), 211-218.
Modeling of steel slag filters is the central point of this thesis from all points of view (experimental work, modeling work and original scientific contribution). Consequently, five chapters (5 to 9) are related to objective 2. Each chapter presents a significant step in the development of the P-Hydroslag model (summarized in Table 1.1). The modeling work of the thesis started from a previous modeling study including the description of involved phenomena. This work (not part of this thesis) was published previously:
Claveau-Mallet, D., Wallace, S. & Comeau, Yves. (2012). Model of phosphorus precipitation and crystal formation in electric arc furnace steel slag filters. Environmental Science &
Technology, 46(3), p. 1465-1470.
A study of a mining leachate treatment by steel slag filter is presented as paper #2. Essential experimental observations and conclusions related to crystal growth, an important feature in this thesis progression, are presented. A first short-term batch test experimental procedure was developed for characterization of slag reactivity. Crystal growth observations and batch test protocol from this paper lead directly to the development of a formal model in subsequent papers. Understanding phosphorus removal mechanisms in steel slag filters was widened by consideration of metals and fluoride removal. The complete reference for paper #2 is:
Claveau-Mallet, D., Wallace, S. & Comeau, Y. (2013). Removal of phosphorus, metals and fluoride from a gypsum mining leachate using steel slag filters. Water Research, 47(4), 1512-1520.
A prototype model was developed and is presented as paper #3. This model version represents a significant advance compared to previous modeling work (article 2012) as numerical simulations were made possible by the translation of observed phenomena into equations. A critical part of this paper was the development of an experimental method for the characterization of slag kinetic parameters. This simple prototype model included precipitation rates for calcium phosphate and did not consider calcite precipitation. The complete reference for paper #3 is:
Claveau-Mallet, D., Courcelles, B. & Comeau, Y. (2014). Phosphorus removal by steel slag filters : modeling dissolution and precipitation kinetics to predict longevity. Environmental
Science & Technology, 48(13), 7486-7493.
The prototype model presented in paper #3 was a promising step for steel slag filter modeling, but it did not present any calibration or validation with real data. Validation of the prototype model was realised by approximately reproducing experimental data from a pilot-scale steel slag filter, presented in a complementary paper (Chapter 7). Simulation results were not perfect but realistic enough to stimulate further model development work. The complete reference for the complementary paper is:
Kõiv, M., Mahadeo, K., Brient, S., Claveau-Mallet, D. & Comeau, Y. Treatment of fish farm sludge supernatant by aerated filter beds and steel slag filters – Effect of organic loading rate. Ecological Engineering, 94, p. 190-199.
Paper #4 presents the first version of the P-Hydroslag model in chapter 7. While paper #3 presented the development of a modeling tool, paper #4 presents the refinement of this modeling tool, its calibration and the demonstration of its prediction capacity. Paper #4 was submitted at the beginning of 2017:
Claveau-Mallet, D., Courcelles, B., Pasquier, P. & Comeau, Y. Numerical simulations with the P-Hydroslag model to predict phosphorus removal by steel slag filters. Submitted to Water Research on March 9th 2017 (manuscript number WR38848).
Table 1.1 : Content of chapters 5 to 9
Chapter Involved model Main outcomes
- Preliminary modeling work
Conceptual model.
Qualitative description of involved phenomena.
Work published prior to the Ph.D. program in Claveau-Mallet et al (2012).
5 Preliminary modeling work
Important observations related to crystal growth.
Development of a preliminary experimental procedure for slag behavior characterization.
Practical application for mining leachate treatment. Work presented as paper #2 in this thesis. 6 Presentation of
prototype model
Translation of conceptual model into mathematical equations. Development of a lab test for characterization of slag.
Running numerical simulations and longevity prediction (without experimental calibration or validation).
Work presented as paper #3 in this thesis. 7 Validation of
prototype model
Approximate reproduction of experimental data using the prototype model.
Work presented as complementary paper in this thesis. 8 Presentation and
calibration of P-Hydroslag model
Refinement of the model’s equations (diffusion barrier and precipitation into homogeneous and heterogeneous crystals). Translation of mathematical equations into a format compatible with general modeling frameworks in wastewater treatment. In-depth study of slag characterization method and
precipitation constant calibration.
Calibration of the model with experimental data of a filter. Work presented as paper #4 in this thesis.
9 General discussion
Critical view on objective 2 and accomplished work regarding model development steps, complementary studies.
The General discussion chapter is focused on a critical view of work conducted regarding the development of a new model; and presents complementary studies related to industrial R&D process optimization and steel slag filter effluent neutralization. Several recommendations for further development steps are provided. The contribution of the Ph.D. candidate in each step leading to the five presented papers is shown in Table 1.2. All papers were written by the candidate, except the complementary paper in which the contribution was for the writing of sections related to modeling, reviewing, synthetizing work (important reduction of word count), and re-melting of Table 7.3, which presents preliminary full-scale design parameters for the treatment of supernatant of a freshwater fish farm sludge settling tank.
Table 1.2 : Relative contribution of the Ph.D. candidate in each paper
Paper 1 2 3 Complementary 4
Project and objectives definition 60% 40% 80% 10% 80%
Experimental work 10% 85% 75% 5% 75%
Simulation and modeling work 80% 75% 90% 95% 80% Interpretation and literature review 60% 80% 90% 30% 90%
CHAPTER 2
CONTEXT AND LITERATURE REVIEW
2.1 Applications of steel slag filters for phosphorus removal in
autonomous decentralized treatment
2.1.1 Established scientific knowledge in steel slag filtration
Steel slag filters are passive systems formed of slag, a waste product from the iron and steel industry. Several types of slag are available and scientists started to use their reactive properties for water treatment applications in the 1980 (Yamada et al., 1986). Slag size ranges from powder to big pebbles, but coarse sand and small gravel size offers a compromise between higher surface area and reduced clogging (Abderraja Anjab, 2009). Alkaline slag is a particular type of slag that allows high phosphorus removal. Electric arc furnace (EAF), blast furnace (BF) and basic oxygen furnace (BOF) slag are types of alkaline slag commonly used in steel slag filters. In this thesis, focus will be given to alkaline steel slag filters (phosphorus removal mainly by precipitation), in opposition with neutral slag filters (phosphorus removal mainly by adsorption).
Three types of alkaline slag study were conducted: short-term batch tests, column filter-tests and full-scale tests. Batch tests remain the more frequent and numerous type of reported studies (Chazarenc et al., 2008). Column or full-scale tests, however, are more reliable and representative of the real behavior of a filter, mainly because of incorrect extrapolation of traditional batch-test interpretation methods to full-scale design. A selected list of recent column, pilot or full-scale studies is summarized in the next lines.
Column tests were conducted during four years by Baker et al. (1998), resulting in 90% phosphorus removal from a reconstituted wastewater with 3.3 mg P/L o-PO4. The hydraulic retention time of
voids of their columns was 0.9 day. Slag were also used directly in the ground for capture of contaminants from a septic tank (Smyth et al., 2002). Buried filters were monitored for two years with achieved phosphorus concentration of 0.05 mg P/L. These authors also conducted column tests during eight years with still a 0.3 mg P/L effluent concentration at the end of operation. Steel slag filters were used for treatment of constructed wetlands effluent with a 75% phosphorus removal in one year (Chazarenc, Brisson, & Comeau, 2007). Slag columns were used in a pilot test for the treatment of a fish farm sludge supernatant with a 97% removal (Kõiv et al., 2016). In
Estonia, hydrated oil shale ash (an alkaline material similar to slag) had not reached any sign of saturation in one year of operation and achieved 99% phosphorus removal over that period (Kõiv
et al., 2010). In France, EAF and BOF slag were used in horizontal flow filters with HRTV of 1 to
2 days for the treatment of a constructed wetland effluent with concentrations of total phosphorus of 8.5 mg P/L, o-PO4 of 7.8 mg P/L and pH of 7.2 (Barca et al., 2013).
Studies cited in the previous paragraph showed high phosphorus removal efficiency of steel slag filters, with effluent concentration generally below 1 mg P/L. For alkaline slag filters, phosphorus concentration is low when pH is above 10 (Vohla et al., 2011). The main problems associated to steel slag filters are efficiency decrease after an unknown period of time (this period may be less than one year) and clogging (Chazarenc et al., 2008). For our specific application (autonomous and decentralized domestic wastewater treatment with low influent flow rate), issues that must be addressed are a poor understanding and control of filter longevity, large required volumes for processes (also including safety factors that could be lowered if the system was better understood), clogging (and short-circuiting), high pH of the filter effluent and replacement/handling logistics.
2.1.2 Regulatory context of autonomous and decentralized treatment in
Quebec
Wastewater treatment units are commonly classified in categories following general treatment steps: preliminary treatment (mainly trash and grit removal), primary treatment (septic tanks or primary settling), secondary treatment (various biological processes for organic matter removal), advanced secondary treatment (various biological processes for improved organic matter and suspended solids removal), tertiary treatment (various chemical and physical processes for nitrogen, phosphorus and fecal coliforms) (MDDEP, 2009a). For autonomous and decentralized treatment in Quebec, a septic tank is always installed as a primary treatment unit. Following units can be secondary, advanced secondary or tertiary treatment units, according to applicable regulations. Target concentrations at effluent related to their respective treatment level in Quebec is presented in Table 2.1.
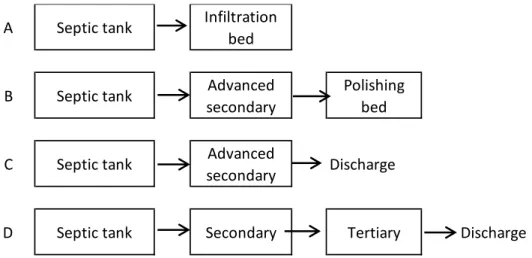
Combinations of treatment units following a septic tank are numerous. The most frequent treatment lines met in Quebec are shown in Figure 2.1. Two options are considered for effluent management: infiltration or discharge in the environment. Regulation asks for prioritization of infiltration in cases
where it is possible to do so. An infiltration bed following the septic tank is the most common and simple option, widely encountered in Quebec (Figure 2.1A). In the case where in situ soil is not suitable for installation of an infiltration bed, an advanced secondary treatment unit is added to the line before infiltration in a polishing bed, a thinner version of the infiltration bed (Figure 2.1B).
Figure 2.1: Common treatment systems in autonomous and decentralized treatment. A and B: effluent management by infiltration, C and D: effluent management by discharge
Table 2.1 : Discharge criteria for five treatment categories applicable in Quebec regulation (MDDEP, 2009a)
Discharge criteria
TSS BOD5-C Fecal coliforms TP
mg/L mg/L UFC/ 100 mL mg P/L Tr ea tm ent t ype Primary 100 - - - Secondary 30 25 - -
Advanced secondary 15 15 50 000 after reactivation - Tertiary (phosphorus removal) 15 15 50 000 after reactivation 1
Tertiary (desinfection) 15 15 200 after reactivation -
When infiltration is not possible, the effluent has to be discharged to the environment. The minimum treatment level required for discharge is advanced secondary (MDDEP, 2009a). This option is shown in Figure 2.1C. If discharge is made in a sensitive ecosystem, a tertiary unit has to be added to the treatment system (Figure 2.1D).
A Septic tank Infiltration
bed
B Septic tank Advanced
secondary
Polishing bed
C Septic tank Advanced
secondary Discharge
Conventional technologies used in autonomous and decentralized treatment include infiltration trenches and beds, and various filters considered as advanced secondary treatment units (hors sol sand filter, classical sand filter, recirculating sand filter). Several non-conventional technologies certified as secondary, advanced secondary or tertiary units are available. Non-conventional technologies are certified by the Bureau de normalisation du Québec (BNQ). Only two systems are currently available for tertiary treatment: the electrocoagulation DpEC unit from Premier Tech Aqua and the activated alumina filter from Norweco.
For influent flowrates smaller than 3240 L/d, discharge criteria are set by considering the receiving environment capacity, mainly from the dilution factor in low flow period and from the proximity of a sensitive lake. Phosphorus is the critical factor that limits discharge into lakes. However, discharge in a lake is allowed under specific conditions (Bernier, 2001). In Quebec, the environment ministry sets discharge criteria for influent flowrates over 3240 L/d. Phosphorus discharge criteria are based on the Position ministérielle de réduction du phosphore. For influent flowrates over 20 m3/d, the target range is 0.5 to 1 mg P/L if the discharge point is in a critical ecosystem.
One important aspect of autonomous and decentralized wastewater treatment regulation is the legal uncertainty related to infiltration. Infiltration beds and polishing beds are not associated to treatment levels (secondary, advanced secondary or tertiary), these units are simply accepted as is. For isolated dwellings, infiltration is always accepted even if the discharge point is located in a phosphorus-sensitive receiving environment. However, the infiltration bed capacity for phosphorus retention is not well known, and studies showed the presence of phosphorus plumes reaching water table under infiltration beds (Robertson, Schiff & Ptacek, 1998).
2.1.3 Two approaches for upgrading phosphorus retention with slag filters in
isolated dwellings systems
2.1.3.1 Tertiary treatment unit for new wastewater treatment systems
The first approach is to solve phosphorus problems by developing a tertiary treatment unit based on steel slag filters, as shown in Figure 2.1D. This option concerns new constructions that cannot use infiltration for technical reasons and when phosphorus discharge criteria are set. This option involves a criteria of 1 mg P/L at effluent and a point discharge. Neutralization of the slag filter
effluent is mandatory prior to discharge as the effluent pH must be between 6.5 and 9.5. This approach was chosen by Bionest, a Quebec company specialised in the development of autonomous and decentralized wastewater treatment units. A collaboration was formed between Bionest and Polytechnique Montreal for the development of this product. During her Ph.D., the candidate contributed to Bionest product development with slag filter modeling studies, ideas for slag filter design and neutralization modeling studies that led to a patent application (Boutet et al., 2017). A discussion comparing approaches 1 and 2 is provided in Chapter 4.
2.1.3.2 Upgrading phosphorus retention capacity of existing systems
The second approach is to develop a treatment unit based on steel slag filters that would be added to existing septic tank-infiltration bed systems. This option involves a diffuse discharge (infiltration in the water table) without regulation for phosphorus and thus, no specific target concentration. Effluent pH is not submitted to discharge regulations. To this day, the second approach concerns a voluntary market, or near-lake residents who want to improve the lake water quality by retaining more phosphorus in their wastewater treatment system.
One simple implementation of a slag filter is to add it between the septic tank and the infiltration bed (Figure 2.2). Preliminary studies of septic tank effluent treatment with slag filter following this configuration were conducted at Polytechnique (Staingart, 2012). Removals of 91% for total phosphorus and 99% for ortho-phosphates were observed for a period of 90 days using an HRTV
of 12 hours and 10-30 mm slag size. This scenario, however, is probably not directly applicable in the treatment system because of the excessive pH of 10 to 11 coming to the infiltration bed which could affect biological treatment and may favor chemical precipitation clogging in the bed.
Figure 2.2: Slag filter configuration with 100% septic tank effluent is sent to a slag filter prior to the infiltration bed
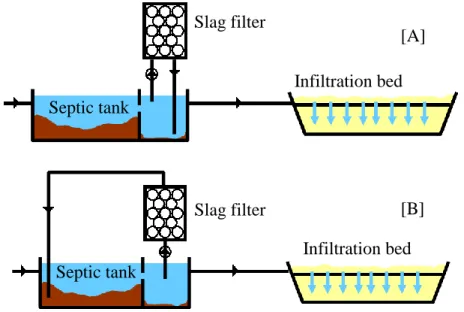
The high pH issue could be overcome by using a recirculating filter in which only a fraction of the flowrate would pass (Figure 2.3). pH in the septic tank would be slightly increased (8 to 9) and would likely not affect biological treatment in the infiltration bed. This strategy would also reduce
the slag filter volume. Phosphorus is expected to be captured in three compartments: septic tank, slag filter and infiltration bed.
2.1.4 Phosphorus retention in steel slag filter
A 95% or higher phosphorus removal is expected in the filter, with a pH at effluent above 11 (Claveau-Mallet et al., 2012).
Figure 2.3 : Possible recirculating configurations. A : recirculation withing second compartment, B : recirculation from second to first compartment
2.1.5 Phosphorus retention in septic tank
Ortho-phosphate concentration in a steel slag filter effluent is related to pH (Figure 2.4). Assuming that this relationship is applicable in a septic tank, if the pH in the septic tank is increased from 7 to 8 or 9, a fraction of ortho-phosphates will be precipitated and settled in the tank. This approach is similar to conventional phosphorus removal by lime (Metcalf & Eddy et al., 2014).
[A] [B] Septic tank Septic tank Slag filter Slag filter Infiltration bed Infiltration bed
Figure 2.4: Relationship between ortho-phosphates and pH at a steel slag filter effluent (Claveau-Mallet et al., 2012)
2.1.6 Phosphorus retention in an infiltration bed
Phosphorus retention mechanisms in a conventional infiltration bed are adsorption and precipitation (Chambers et al., 2001) which are affected by pH and pe. These mechanisms are insufficient for ensuring a consistent and long term phosphorus concentration below 1 mg P/L for the effluent leaching into the groundwater, as concentrations of up to 5 mg P/L were observed below infiltration beds (Robertson, Schiff & Ptacek, 1998). pH in infiltration beds is typically between 6 to 7. At those pH value, iron phosphate minerals such as vivianite, strengite and variscite may form (Robertson, Schiff & Ptacek, 1998) but such a pH is too low for hydroxyapatite precipitation. Slag filter leachates may favor hydroxyapatite precipitation via increased pH (9) and increased calcium. Struvite (MgNH4PO4 6H2O) precipitation would also be favored by a pH
increase, but it occurs only above a critical Mg/P ratio (Jaffer et al., 2002).
2.2 Modeling concepts relevant for steel slag modeling
This section presents modeling concepts that were used in Chapter 5 to 8. To avoid redundancy, only concepts that are not already presented in paper presented in these Chapters are presented. The literature review from papers 2 to 4 and section 2.1.1 presented briefly steel slag, past applications of steel slag for water treatment, technical aspects and issues associated with steel slag
0.0 0.1 0.2 0.3 0.4 0.5 0.6 0.7 0.8 0.9 1.0 6 7 8 9 10 11 12 [o -PO 4 ] /i n fl u e n t [o -PO 4 ] (m g P /m g P ) pH HRTV = 16.3 h HRTV = 3.8 h HRTV = 1.5 h
filters and modeling needs. The next section will emphasize fundamental modeling concepts that were used in this thesis modeling work.
2.2.1 Hydraulic models for porous media
In a porous media reactor, as well as in any kind of reactor, hydraulics should be known and correctly modelled before conducting simulation work. Two useful models for hydraulics modeling of porous media reactors such as constructed wetlands or reactive filters, will be presented in this section. Modeling of porous media rectors involves important aspects:
- As the reactor volume is partly filled with media, the empty bed hydraulic retention time (HRT) of the reactor is not fully available for water flow and treatment. The hydraulic retention time of voids (HRTV) should be used for analysis and design, following equation 2.1, with n being the reactor porosity. n is defined as the total volume fraction occupied by water, including both mobile and immobile water. n can be calculated from simple mass-volume relationship. Typically, porosity is 30% in sand (Domenico & Schwartz, 1998) and 50% in steel slag filters (Claveau-Mallet, Courcelles, & Comeau, 2014).
𝐻𝑅𝑇𝑉 = 𝑛𝐻𝑅𝑇 (2.1)
- The effective hydraulic retention time of void (HRTVe) is defined from effective porosity (ne) as the real retention time of the reactor, considering that only a fraction of porosity is available for water flow (equation 2.2). HRTVe cannot be calculated from mass-volume relationship, it has to be calibrated from tracer tests. HRTV is used for design, while HRTVe is used for modeling.
𝐻𝑅𝑇𝑉𝑒 = 𝑛𝑒𝐻𝑅𝑇 (2.2)
- The hydraulic model should be calibrated (or validated) with tracer tests. 2.2.1.1 The advection-diffusion-reaction model
The advection-diffusion-reaction (ADR) equation (equation 2.3) was developed for groundwater flow in hydrogeology applications (Fetter, 1999). In this equation, a solute (its concentration is represented by C) migrates by both convection (𝑣⃗𝐶 term) and mechanical dispersion (𝐷 ∙ ∇𝐶 term)
in a porous media, in which reactions occur ((𝜕𝐶𝜕𝑡)
𝑟𝑥 term). D is the dispersion coefficient (m 2/s) of
the porous media.
𝑑𝑖𝑣(𝐷 ∙ ∇𝐶 − 𝑣⃗𝐶) + (𝜕𝐶𝜕𝑡)
𝑟𝑥 = 𝜕𝐶
𝜕𝑡 (2.3)
For 1D simple flow of a conservative solute (without reactions), analytical solutions are available. For example, a 1D continuous-flow pulse-injection tracer test response curve can be modeled with equation 2.4 (Fetter, 1999). In this equation, C0 is the initial concentration of the tracer (mol/m3), erfc is the complementary error function, x is the position from the injection point (m), vx is the water velocity (m/s), D is the dispersion coefficient (m2/s) and t is time (s).
𝐶(𝑥, 𝑡) =𝐶0 2 (𝑒𝑟𝑓𝑐 ( 𝑥−𝑣𝑥𝑡 2√𝐷𝑡) + 𝑒𝑥𝑝 ( 𝑥𝑣𝑥 𝐷 ) 𝑒𝑟𝑓𝑐 ( 𝑥+𝑣𝑥𝑡 2√𝐷𝑡)) (2.4)
Tailing typically found in tracer tests can be modeled in the ADR model as retardation. The ADR equation including an additional term for retardation is shown in equation 2.5. In this equation, Bd is the soil volumetric mass (g/m3) and C* is the solute concentration sorbed onto soil (g solute / g soil). 𝑑𝑖𝑣(𝐷 ∙ ∇𝐶 − 𝑣⃗𝐶) −𝐵𝑑 𝜃 𝜕𝐶∗ 𝜕𝑡 + ( 𝜕𝐶 𝜕𝑡)𝑟𝑥 = 𝜕𝐶 𝜕𝑡 (2.5)
It is possible to solve the ADR equation by finite elements, using hydraulic parameters that were calibrated in simple tracer tests. The ADR model was the one used in this thesis modeling work. The ADR model was implemented in the PHREEQC software for 1D flow.
ADR model in PHREEQC
In PHREEQC, the 1D flow ADR model is represented by a column divided into cells. Numerically, the ADR model is solved in three steps (Parkhurst & Appelo, 1999): first cells and their water content are shifted from one to the other, second dispersion is modeled by mixing between adjacent cells, and third kinetic or equilibrium reactions are performed. Retardation (and tailing of a tracer test) can be modeled by the double porosity module which consists of parallel cells along the column. Each column cell is connected to an immobile cell in which mixing with the mobile cell is possible via a mixing factor (Figure 2.5). Tracer test response curve can be directly calibrated with a numerical tracer test by trial and errors or numerical optimization.
Figure 2.5 : Schematic representation of the PHREEQC double porosity module for ID transport in a 6-cell column
2.2.1.2 The tanks-in-series (TIS) flow model
This model is used for constructed wetlands and is described in Kadlec and Wallace (2009). Migration of solute in the porous media is represented by a succession of completely stirred tank reactors (CSTR). This model can be represented by a gamma distribution (equation 2.6), in which
N is the number of tanks and t time. Note that N does not have to be an integer in this equation. As
the gamma distribution is a probability density function, the tracer response curve should be transformed into a f(t) function by normalization with the total tracer mass (equation 2.7). Calibration of the model can be done by minimizing the error between equations 2.6 and 2.7.
𝑓(𝑡) =𝑁𝑁𝐻𝑅𝑇𝑉𝑒𝑁−1 𝐻𝑅𝑇𝑉𝑒𝑁Γ(𝑁)𝑒𝑥𝑝 ( −𝑁𝑡 𝐻𝑅𝑇𝑉𝑒) (2.6) 𝑓(𝑡) = 𝐶(𝑡) ∫ 𝐶(𝑡)𝑑𝑡0∞ (2.7)
2.2.1.3 Comparison of hydraulic models
Calibration of a tracer test using both models is presented in Figure 2.6. This tracer test was performed on a steel slag column; this column test will be presented in Chapter 8. Two tanks-in-series (TIS) calibration are presented using partial data (t ≤ 11 h or t ≤ 25 h) in the optimization step. The PHREEQC ADR model was calibrated visually by heuristic optimization. Calibrated parameters were N = 28.2 and TRHVe = 8.5 h for TIS-11 h; N = 12.9 and TRHVe = 9.8 h for TIS-25 h; D*=5 cm, Dn = 5e-6 s-1 and HRTVe = 9.4 h for the PHREEQC ADR model. Note that the
TIS-11 h calibration is very close to a plug flow, with high N and symmetrical curve, and TRHVe close to the peak.
Figure 2.6 : Calibration of a tracer test using the TIS and the PHREEQC ADR models Table 2.2 : Hydraulic parameters for the TIS and PHREEQC ADR models
Parameter Description TIS model
N Number of tanks in series
HRTVe (h) HRTVe/N is the theoretical HRT of a CSTR PHREEQC ADR model
D* (cm) Dispersivity
Dn (s-1) Exchange factor between mobile and immobile cells
HRTVe (h) HRTVe/(number of cells) is the duration of a shift
The PHREEQC ADR model resulted in a better calibration than the TIS model. The TIS model can either calibrate the peak or part of the tail, depending on the number of data considered in optimization. Adding data to the optimization step improved slightly the tail, but the peak was shifted. The better accuracy of the PHREEQC ADR model can be explained by its higher complexity, which involves three calibrated parameters for effective volume, dispersion and retardation, compared to the TIS model which involves only two parameters for effective volume and dispersion (Table 2.2). For simple 1D cases with no or small tails, both models may be equivalent. Note that both models do not consider media at all. CSTR are assumed to be empty and
0 5 10 15 20 25 0 10 20 30 40 50 60 70 80 Con c. (u g/L) Time (h) Exp data
TIS model with t<11h TIS model with t<25h PHREEQC ADR model