HAL Id: hal-00329312
https://hal.archives-ouvertes.fr/hal-00329312
Submitted on 8 Apr 2004
HAL is a multi-disciplinary open access
archive for the deposit and dissemination of
sci-entific research documents, whether they are
pub-lished or not. The documents may come from
teaching and research institutions in France or
abroad, or from public or private research centers.
L’archive ouverte pluridisciplinaire HAL, est
destinée au dépôt et à la diffusion de documents
scientifiques de niveau recherche, publiés ou non,
émanant des établissements d’enseignement et de
recherche français ou étrangers, des laboratoires
publics ou privés.
Evidence for storm-time ionospheric ion precipitation in
the cusp with magnetosheath energy
H. Stenuit, J.-A. Sauvaud
To cite this version:
H. Stenuit, J.-A. Sauvaud. Evidence for storm-time ionospheric ion precipitation in the cusp with
magnetosheath energy. Annales Geophysicae, European Geosciences Union, 2004, 22 (5),
pp.1765-1771. �hal-00329312�
Geophysicae
Evidence for storm-time ionospheric ion precipitation in the cusp
with magnetosheath energy
H. Stenuit and J.-A. Sauvaud
CESR/CNRS, 9 av. du colonel Roche, 31028 Toulouse, France
Received: 3 October 2003 – Revised: 21 January 2004 – Accepted: 26 January 2004 – Published: 8 April 2004
Abstract. We present evidence for a sporadic precipitation
into the north polar cusp of ionospheric O+and He+ions
ac-celerated up to the magnetosheath flow speed during a mag-netic storm. This is deduced from data obtained on board the Interball-Auroral satellite showing that the energy/charge
ra-tios of the H+, He++, He+and O+populations are similar
to those of ion masses. These measurements pertain to a very disturbed magnetic period. A storm was in progress with a
Dst reaching −149 nT during the cusp measurements, while
the AE index reached values higher than 1000 nT. This result is discussed in terms of ion circulation from the magneto-sphere to the magnetosheath and back to the magnetomagneto-sphere.
We suggest that the acceleration of O+and He+ions up to a
magnetosheath-like velocity is directly linked to the large By
component of the IMF.
Key words. Magnetospheric physics (magnetopause, cusp and boundary layers; magnetosheath; storms and substorms)
1 Introduction
During periods of strong magnetic activity, cold terrestrial ions with energies ranging from a few eV to several keV, expelled from the high-latitude ionosphere and/or from the plasmasphere, are detected inside the main plasma regions of the closed field lines of the Earth’s magnetosphere and on the lobe open field lines convected over the polar cap from the dayside to the tail region; e.g. Freeman et al. (1977); El-phic et al. (1997). In situ observations performed inside the magnetotail lobe indeed clearly shows the presence of
iono-spheric O+ions originating from the cusp and convected
to-wards the neutral sheet by the large-scale convection electric field; Delcourt et al. (1996). Ionospheric ions are as well detected inside the plasma sheet, directly originating from the nightside auroral regions during storms and large sub-storm periods; e.g. Sauvaud et al. (2004). A careful study
Correspondence to: H. Stenuit
of the rate of ion outflows over the auroral zone and over the polar cap led Chappell et al. (1987) to propose that the ionosphere could be the dominant source of plasma of the magnetosphere. A part of this population could have very low energies and not be measurable by a spacecraft charged to tens of volts. Along this line, recent Cluster measure-ments have shown the unexpected presence of a very cold
(a few eV) ionospheric population of H+, He+and O+in a
region adjacent to the magnetopause which become measur-able only when the magnetopause motions give these ions a large drift velocity, allowing them to temporarily reach ki-netic energies higher than the satellite potential. The density of such a population, mainly detected during quiet times, is 3 to 5 times that of the keV particle of solar origin forming the dayside plasma sheet; Sauvaud et al. (2001a). These low energy ionospheric ions can possibly be accelerated during reconnection events. Such a population has indeed been de-tected during the reconnection process at the magnetopause; Gosling et al. (1990b); Fuselier et al. (1991); Su et al. (2000, 2001). Outside the magnetosphere, ionospheric ions have been detected in the magnetosheath; Frank, (1971); Elphic et al. (1996); Borovsky et al. (1997a, 1998). It is quite natural to expect that the ionospheric ions escaping into the magne-tosheath are accelerated here by the local electric field up to energies corresponding to the magnetosheath flow and could possibly penetrate again into the magnetosphere along recon-nected field lines. Note that the acceleration is the highest when the magnetosheath plasma flow is perpendicular to the magnetosheath magnetic field (E=–V×B). To our knowledge conclusive measurements supporting this scenario have not been reported in the literature, although some data obtained from Interball and Fast satellites have shown precipitation of
high energy O+ and He+ ions inside the cusp (Sauvaud et
al., 2001b; McFadden et al., 2003).
The cusp crossings presented in this paper were obtained during a very disturbed period on 8 November 1998. From solar wind data available from WIND and ACE, coronal mass ejection effects were evident during 7–8 November as the solar wind velocity increased from 420 to 660 km/s,
1766 H. Stenuit and J.-A. Sauvaud: Evidence for storm-time ionospheric ion precipitation in the cusp
A C E ( D t ~ 3 7 m i n )
W I N D ( D t ~ 1 3 m i n )
N o v e m b e r 8 , 1 9 9 8
De
ns
ity
(c
m
-3)
Ve
lo
cit
y
(k
m
/s)
Dy
na
m
ic
Pr
es
su
re
(n
Pa
)
B
z GS M (n T)0 2 : 0 0
0 3 : 0 0
0 4 : 0 0
0 5 : 0 0
0 6 : 0 0
0 7 : 0 0
0 9 : 0 0
T i m e ( U T )
0 8 : 0 0
B
y GS M (n T)B
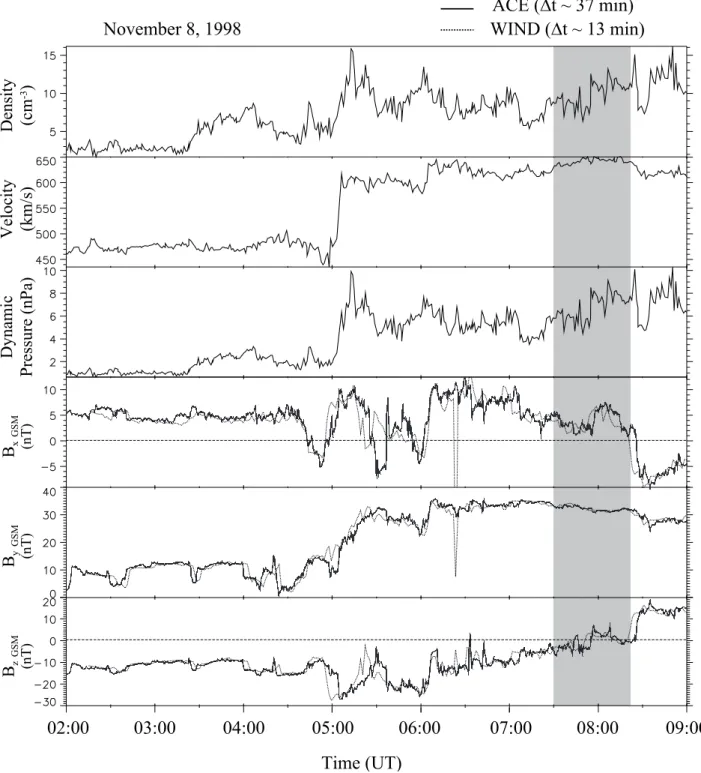
x GS M (n T)Fig. 1. Plasma (density, velocity and dynamic pressure) measurements obtained on board ACE and magnetic field components measured on board ACE (solid line) and WIND (dashed line) in the solar wind on 8 November 1998 between 02:00 and 09:00 UT. The time delay necessary for the plasma to reach the Earth’s magnetosphere has been taken into account. The gray area corresponds to the cusp measurements by Interball Auroral.
particle densities increased to 27 cm−3, and Bz became
strongly southward (maximum deflections to −25 nT in GSM frame). Active to minor storm levels occurred during 6–7 November. Activity increased to severe storm levels dur-ing 8 November.
On 8 November, the Interball Auroral satellite observes,
inside the cusp, high fluxes of H+ and He++ ions
com-ing from the magnetosheath and also the typical ionospheric
outflow of O+ and He+, which is a characteristic of this
0 8 N o v 1 9 9 8 I N T E R B A L L A U R O R A L L o g J 1 0 0 0 1 0 0 0 1 0 0 0 01 0 0 1 0 0 0 0 1 0 0 1 0 0 0 0 1 0 0 0 0 1 0 0 0 1 0 0 1 0 0 0 1 0 0 1 0 0 0 0 1 0 0 0 1 0 0 1 5 0 1 0 0 5 0 0 E (e V) e -E (e V) H + E (e V) O + E (e V) H e ++ E (e V) H e + P. A. (d eg ) 8 . 8 7 . 5 6 . 2 5 . 0 7 . 7 6 . 8 5 . 8 4 . 9 4 . 0 6 . 7 5 . 8 4 . 8 3 . 9 3 . 0 1 0 . 0 H I N V L A T M L T 0 7 : 3 0 0 7 : 3 5 0 7 : 4 0 0 7 : 4 5 0 7 : 5 0 0 7 : 5 5 0 8 : 0 0 0 8 : 0 5 0 8 : 1 0 0 8 : 1 5 0 8 : 2 0 2 . 6 3 7 3 . 7 1 1 1 . 2 3 2 . 7 3 7 3 . 0 6 1 1 . 6 8 2 . 8 2 7 2 . 3 1 1 2 . 0 6 2 . 8 9 7 1 . 4 9 1 2 . 3 9 2 . 9 4 7 0 . 5 9 1 2 . 6 7 2 . 9 6 6 9 . 6 5 1 2 . 9 2
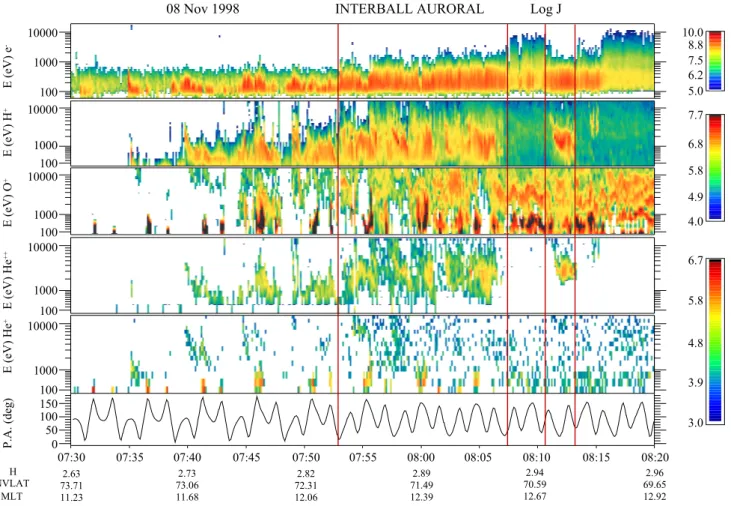
Fig. 2. Interball Auroral observations on 8 November 1998 between 07:30 to 08:20 UT. From top to bottom: the energy time spectrograms for electrons, H+, O+, He++, He+. The fluxes are color coded. The bottom panel indicates the pitch-angle variations as a function of time. The vertical line delimitates the different regions discussed in the text.
also detected inside the cusp. These ions have velocities comparable to that of magnetosheath ions: the energy ratios of the ions with mass ranging from 1 to 16 are close to their mass ratios. This observation is discussed in terms of the global circulation of plasma from the magnetosphere to the magnetosheath and then back to the magnetosphere through the cusp, without strong parallel acceleration.
2 Detailed interplanetary conditions
During the time of interest, from 07:30 to 08:30 UT on 8
November, a storm was in progress with a Dst reaching
−149 nT. The AE index reached values higher than 1000 nT.
The ACE satellite was probing the solar wind close to the L1
point, (GSM, 221, −28, −11) RE, while WIND was
mon-itoring the solar wind data closer to the Earth (GSM, 77,
16, 3) RE. ACE and WIND plasma and magnetic field data
used in this study are displayed in Fig. 1. The ACE data come from the Solar Wind Electron Proton Alpha Monitor (SWEPAM) experiment and Magnetic Field experiment, re-spectively described by McComas et al. (1998) and Smith et
al. (1998). WIND magnetic field data used in this study are from the MFI instruments described by Lepping et al. (1995). From top to bottom, Fig. 1 displays, during the time interval from 02:00 to 09:00 UT, the density, the velocity and the dy-namic pressure of the solar wind obtained by ACE and the three components of the interplanetary magnetic field (IMF) in GSM coordinates measured by ACE (solid line) and by WIND (dashed line). The gray area corresponds to the cusp measurement by Interball Auroral. The time delay necessary for the plasma to reach the Earth’s magnetosphere has been taken into account. Both the solar wind velocity and den-sity change strongly around 05:00 UT. The velocity increases from about 470 km/s up to values higher than 600 km/s and stays at this level up to the end of the interval. The density
reaches a maximum higher than 15 cm−3and then fluctuate
between 7 and 15 cm−3. Nearly simultaneously with the
ve-locity increase, the Bzcomponent of the IMF displays a large
southward excursion (−10 to −25 nT) and slowly recovers until 08:20 UT when it takes suddenly large positive values.
From ∼04:30 to ∼06:00 UT, the Bycomponent strongly
in-creases to a value reaching 30 nT, while the Bx component
1768 H. Stenuit and J.-A. Sauvaud: Evidence for storm-time ionospheric ion precipitation in the cusp
0 8 N o v 1 9 9 8
I N T E R B A L L A U R O R A L L o g J
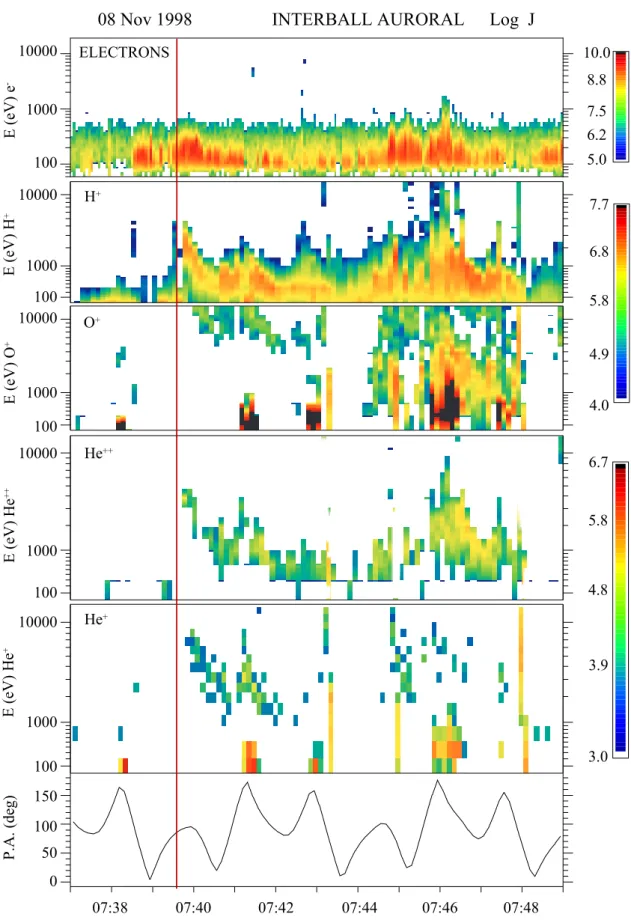
1 0 0 0 1 0 0 0 1 0 0 0 0 1 0 0 1 0 0 0 0 1 0 0 1 0 0 0 0 1 0 0 0 0 1 0 0 0 1 0 0 1 0 0 0 1 0 0 1 0 0 0 0 1 0 0 0 1 0 0 1 5 0 1 0 0 5 0 0 1 0 . 0 8 . 8 7 . 5 6 . 2 5 . 0 7 . 7 6 . 8 5 . 8 4 . 9 4 . 0 6 . 7 5 . 8 4 . 8 3 . 9 3 . 0 0 7 : 3 8 0 7 : 4 0 0 7 : 4 2 0 7 : 4 4 0 7 : 4 6 0 7 : 4 8 E (e V) e -E (e V) H + E (e V) O + E (e V) H e ++ E (e V) H e + P. A. (d eg ) E L E C T R O N S H + O + H e + + H e +Fig. 3. An enlarged view of Interball Auroral data on 8 November 1998 between 07:37 and 07:49 UT. The red vertical line shows the beginning of an ion dispersed structure.
y
directed and is very strong, around 30 nT. The Bzcomponent
turns from southward to northward. The solar wind density and pressure are largely fluctuating and the solar wind veloc-ity is quite stable around 640 km/s.
3 Interball auroral observations
On 8 November, 1998, the Interball Auroral satellite passes
over the dayside oval auroral from 11:00 MLT and 74◦–
in-variant latitude to 13:00 MLT and 69◦ – invariant latitude.
The altitude of the satellite is close to 18 000 km. Figure 2 shows the measurements performed on board by the ION ex-periment from 07:30 to 08:20 UT; see Sauvaud et al. (1998) for a detailed description of the experiment. The different panels display, from the top to the bottom, the energy time
spectrograms of electrons, H+, O+, He++, He+ ions. The
fluxes are color coded. The bottom panel gives the particle pitch-angle as a function of time. Normally, the spin axis of the satellite is directed towards the Sun, but here, at the end of its lifetime, the spin axis was pointing several degrees away from the Sun direction and the satellite had a large nu-tation motion. That’s why, the pitch-angle presents such non sinusoidal features. The satellite passes from the polar cap to the dayside plasma sheet and observes first the cusp be-tween 07:35 and 07:53 UT. The cusp is characterized by
spo-radic enhancements of fluxes of H+, He++ions and of low
energy electrons (E<800 eV). Around 07:53 UT, the satel-lite enters in a region where the energy of the ions and of electrons is higher. Proton fluxes with energies reaching the detector limit (15 keV) are clearly enhanced. However, the satellite still observed there sporadic injections. We iden-tify this region which is crossed until 08:07 UT as the pro-jection of the dayside boundary layer filled with accelerated magnetosheath plasma and with energetic oxygen. Around 08:07 UT, the satellite enters inside the dayside extension
of the plasma sheet where no He++ ions are detected and
where the electron fluxes for energies higher than 4 keV be-come detectable. However the satellite still made two very brief encounters with the cusp/boundary layer from 08:11 to 08:13 UT and finally around 08:15 for less than 1 min.
During the first cusp and boundary layer crossing and even
before, over the polar cap, large outflows of low energy O+
and He+ions are clearly seen each time the view direction
of the detector is close to the magnetic field. Conical pitch-angle distributions with flux maxima can be clearly recog-nized, for example, around 07:55 and 08:00 UT. These par-ticles are outward flowing from the ionosphere with energy
lower than 2–3 keV. Note that, as expected, the solar He++
ion fluxes do not show such a behavior. Between 08:07 UT and 08:10 UT, i.e. when the satellite enters inside the dayside plasma sheet either due to its own motion or due to magneto-spheric boundary motions, it detects an oxygen energy band, for energies higher than 1 keV, clearly modulated by the spin phase. The oxygen energy is maximal for large pitch-angles. This is an indication that these ions are injected from a
dis-ing the Tsyganenko-96 magnetic field model, takdis-ing into ac-count the ion energy-mass and pitch-angle. According to the computation, the ions have been injected close to the equato-rial plane at ∼08:00 UT. The computed source is located at
R ∼6 RE, ∼−30◦magnetic latitude and ∼12:30 MLT.
Ac-cording to the model, the ions were first injected towards the south hemisphere. Between the source and Interball, the ions
travel ∼17 REalong the field line.
Later, after the brief cusp crossing (∼08:12 UT), inside the plasma sheet again, Interball detected several other energy bands in the energy range extending from 1 keV to 10 keV (Fig. 2). To our knowledge, such ion structures have only been reported before by Boehm et al. (1999) from FAST data and been interpreted as due to the ejection of ions from the equatorial plane in a temporally localized, spatially extended, equatorial source, under the possible action of a compression pulse. This scenario is in good agreement with the observa-tions presented here, as we computed that oxygen ions are injected from a region located close to the equatorial plane, during a period of enhanced and variable solar wind pressure (Fig. 1).
Coming back to the cusp ion injections occurring just
be-fore 07:40 UT, the H+energy dispersed traces are related to
identical structures for the He++ ions but surprisingly also
with dispersions of He+ions. This can be easily appreciated
in Fig. 3 which presents an enlarged view of these cusp in-jections between 07:37 and 07:49 UT. Flux enhancements of high energy oxygen is also concurrently seen.
We focalized here on the double ion dispersion starting around 07:40 UT. This structure, which corresponds to an enhancement of the electron flux, exists in the energy time
spectrograms of H+, He+, He++, O+. The energy/charge
ra-tios of the ion populations seems to be quite similar to those of their masses. This can be appreciated in Fig. 4 which displays the four ion energy spectra at a chosen time dur-ing the ion dispersion (07:40:37 UT). The vertical gray areas indicate the energies which correspond to a energy/charge ratio equal to the mass ratio based on the energy of the flux maximum of the hydrogen energy spectra which corresponds to a velocity of 350 km/s. The agreement between expecta-tions and observaexpecta-tions is reasonably good. This observation strongly suggest that the ionospheric ions precipitating inside the cusp have first reached the magnetosheath with a weak kinetic energy and have been accelerated there up to a veloc-ity close to the magnetosheath velocveloc-ity and then re-enter the magnetosphere inside the high-latitude cusp.
4 Discussion and conclusion
Interball Auroral observations on 8 November 1998, pre-sented here, highlights several points concerning the mo-tion of ionospheric ions. The sporadic precipitamo-tion of iono-spheric plasma inside the cusp, together with solar wind ions, clearly show that ionospheric plasma is able to cross the mag-netopause before being precipitated inside the ionosphere.
1770 H. Stenuit and J.-A. Sauvaud: Evidence for storm-time ionospheric ion precipitation in the cusp
1
2
4
1 6
H
+O
+H e
+ +H e
+ 8 N o v e m b e r 1 9 9 8 0 7 : 4 0 : 3 7Fig. 4. Average energy spectra for the H+, He++, He+and O+
precipitated ions observed around 07:40:37 UT on board Interball Auroral. The vertical gray areas indicate the energy ranges which correspond to an energy/charge ratio equal to the mass ratio, based on the hydrogen energy spectra.
Several main mechanisms could explain the population of the magnetosheath with ionospheric plasma. The simplest one refers to the ion gyro radius. Ions can escape when their gyro-radii are comparable with the magnetopause thickness, and when the IMF has a southward component, as in the case presented here. This later mechanism has been shown to adequately explain the distribution functions of oxygen ions observed by Cluster inside the magnetosheath; Mar-cucci et al. (2003). However, in our case we don’t know ei-ther the magnetopause thickness or the magnetic field value just inside the magnetosphere. The only boundary
condi-tion is given by the fact that the kinetic energy (Ein) of
the O+ and He+ ions in the magnetosphere should be low
compared with the energy they gain in the magnetosheath
(Eout). Supposing Ein/Eout∼0.1 (∼300 eV for He+energy
in the magnetosphere), this lead to LB ∼5000 km.nT (with L the magnetopause thickness and B the magnetic field at the
magnetopause). The pressure balance (nmv2=B2/µ0)
pro-vides a rough estimation of the B value at the magnetopause;
∼120 nT (with density and velocity values taken from ACE
measurements). Thus, the magnetopause thickness should
be L ∼40 km. This number being unrealistic, we can elimi-nate this mechanism to explain the ions exit into the magne-tosheath. Other possibilities include the ion transport across the magnetopause under the effect of large amplitude ULF waves, as recently shown by Greco et al. (2003) and/or mag-netic reconnection.
Once into the magnetosheath the E×B drift can possibly give the ions a bulk velocity tangent to the magnetopause when the flow is mainly perpendicular to B. This is the case for the event we studied; the IMF configuration (very strong
By)and the expected meridian motion of the magnetosheath
flow near noon, are consistent with the existence of a mag-netosheath large-scale electric field (E=−V×B) able to ac-celerate the ionospheric ions close to a large fraction of the magnetosheath velocity and to bring them to the high-latitude cusp where, as indicated by the Interball results, they sporad-ically re-enter the magnetosphere through the cusp, where it is generally admitted that the injections of magnetosheath plasma result from magnetic reconnection. However, note that the single satellite data presented here do not allow one to go into much further details concerning the output/input mechanisms.
The observations presented in this article show that during a strong disturbed period corresponding to a southward IMF
with a large By component, the magnetopause is permeable
to ionospheric particles and that these ions precipitate into the cusp, with a magnetosheath-like velocity. The boundary layer, probably located on closed field lines, is also populated
with a mixture of solar wind (H+, He++)and ionospheric
ions (He+, O+)which are also sporadically injected towards
the ionosphere. The global circulation of ionospheric ions (escape from the magnetosphere, acceleration in the mag-netosheath, precipitation in the cusp, entry into the bound-ary layer) should now be studied in detail by future multi-point observations. We should also understand why the pre-cipitation of energetic ionospheric ions into the cusp occurs only during geomagnetic storms as deduced from the Inter-ball database.
Acknowledgements. We thank N. Ness of Bartol Research Institute for the ACE magnetic field data, D. J. McComas of Southwest Re-search Institute for the ACE solar wind plasma data and R. P. Lep-ping for the MFI WIND data. We thank E. Budnik for helpful dis-cussions.
Topical Editor T. Pulkkinen thanks a referee for his help in eval-uating this paper.
References
Boehm, M. H., Klumpar, D. M., M¨obius, E. Kistler, L. M., McFad-den, J. P. Carlson, C. W., and Ergun, R. E.: Fast auroral snapshot observations of bouncing ion distributions: Fieldline length mea-surements, J. Geophys. Res., 104, 2343–2355, 1999.
Borovsky, J. E., Thomsen, M. F., and McComas, D. J.: The su-perdense plasma sheet: Plasmaspheric origin, solar wind origin, or ionospheric origin?, J. Geophys. Res., 102, 22 089–22 097, 1997a.
tospheric dynamics and mass flow during the November 1993 storm, J. Geophys. Res., 103, 26 373–26 394, 1998.
Chappell, C. R., Moore, T. E., and Waite Jr., J. H. : The ionosphere as a fully adequate source of plasma for the Earth’s magneto-sphere, J. Geophys. Res., 92, 5896–5910, 1987.
Delcourt, D. C., Sauvaud, J.-A., Vaisberg, O. L., Avanov, L. A., Burch, J. L., and Waite Jr., J. H.: Signatures of impulsive con-vection in the magnetospheric lobes, Geophys. Res. Lett., 23, 129–132, 1996.
Elphic, R. C., Weiss, L. A., Thomsen, M. F., McComas, D. J., Mold-win, M. B.: Evolution of plasmaspheric ions at geosynchronous orbit during times of high geomagnetic activity, Geophys. Res. Lett., 23, 2189–2192, 1996.
Elphic, R. C., Thomsen, M. F., and Borovsky, J. E.: The fate of the outer plasmasphere, Geophys. Res. Lett., 24, 365–368, 1997. Frank, L. A.: Plasma in the Earth’s polar magnetosphere, J.
Geo-phys. Res., 76, 5202–5205, 1971.
Freeman, J. W.,. Hills, T. W., Hill, Reiff, P. H., and Hardy, D. A.: Heavy ion circulation in the Earth’ H. Ks magnetosphere, Geo-phys. Res. Lett., 4, 195–198, 1977.
Fuselier, S. A., Klumpar, D. M., and Shelley, E. G.: Ion reflex-ion and transmissreflex-ion during reconnectreflex-ion at the Earth’s subsolar magnetopause, Geophys. Res. Lett., 18, 139–142, 1991. Gosling, J. T., Thomsen, M. F., Bame, S. J., Elphic, R. C., and
Russel, C. T.: Cold ion beams in the low latitude boundary layer during accelerated flow events, Geophys. Res. Lett., 17, 2245– 2248, 1990b.
Greco, A., Taktakishvili, A. L., Zimbardo, G., . Veltri, P, Cimino, G., Zelenyi, L. M., and Lopez, R. E.: Ion transport and L´evy random walk across the magnetopause in the presence of magnetic turbulence, J. Geophys. Res., 108, A11, 1395, doi:10.1029/2003JA010087, 2003.
Lepping, R. P., Acu˜na, M. H., Burlaga, L. F., Farrell, W. M., et al.: The Wind magnetic field investigation, Space Science Review, 71, 207–229, 1995.
Marcucci, M. F., Bavassano Cattaneo, M. B., Pallocchia, G., Amata, E., Bruno, R., Di Lellis, A. M., Formisano, V., et al.: Magneto-spheric oxygen in the magnetosheath and its response to IMF ori-entation: Cluster observations, J. Geophys. Res., in press, 2004.
J. L., Riley, P., and Griffee, J. W.: Solar wind electron proton al-pha monitor (SWEPAM) for the advanced composition explorer, Space Sci. Rev., 86, 563–612, 1998.
McFadden, J. P., Carlson, C. W.,Strangeway, R., and Moebius, E.: Observations of downgoing velocity dispersed O+and He+in the cusp during magnetic storms, Geophys. Res. Lett., 30, vol. 18, doi:10.1029/2003GL017783, 2003.
Sauvaud, J. A., Barthe, H., Aoustin, C., Thocaven, J. J., Rouzaud, J., Penou, E. Popescu, D., Kovrazhkin, R. A., and Afanasiev, K. G.: The ION experiment on board the interball-auroral satellite; initial results on velocity-dispersed structures in the cleft and in-side the auroral oval, Ann. Geophys., 16, 1056–1069, 1998. Sauvaud, J.-A., Lundin, R., R´eme, H., McFadden, J. P., Carlson,
C., Parks, G. K., M¨obius, E., Kistler, L. M., et al.: Intermittent thermal plasma acceleration linked to sporadic motions of the magnetopause, first Cluster results, Ann. Geophys., 19, 1523– 1532, 2001a.
Sauvaud J.-A., Stenuit, H., and McComas, D.: Precipitation into the cusp of ionospheric ions accelerated to magnetosheath flow speed, EGS General Assembly, Nice (poster presentation), 2001b.
Sauvaud, J.-A., Louarn, P., Fruit, G., Stenuit, H., Vallat, C., Dandouras, J., R`eme, H., Andr´e, M., Balogh, A., Dunlop, M., et al.: Cases studies of the dynamics of ionospheric ions in the Earth’s magnetotail, J. Geophys. Res., 109, A01212, doi:10.1029/2003JA009996, 2004.
Smith, C. W., L’Heureux, J., Ness, N. F., Acu˜na, M. H., Burlaga, L. F., and Scheifele, J.: The ACE magnetic fields experiment, Space Sci. Rev., 86, 613–632, 1998.
Su, Y.-J., Borovsky, J. E., Thomsen, M. F., Elphic, R. C., and Mc-Comas, D. J.: Plasmaspheric material at the reconnecting mag-netopause, J. Geophys. Res., 105, 7591–7600, 2000.
Su, Y.-J., Borovsky, J. E., Thomsen, M. F., Dubouloz, N., Chandler, M. O., Moore, T. E., and Bouhram, M.: Plasmaspheric material on high-latitude open field lines, J. Geophys. Res., 106, 6085– 6096, 2001.