Reducing Inequality of Opportunities in the West African Urban
Labour Markets: What Kind of Policy Matters?
Laure Pasquier-Doumer, IRD-DIAL, pasquier@dial.prd.fr Preliminary version
September 2009
A number of studies have shown that the African labour markets are compartmentalised into segments with different structures and mechanisms in terms of wages, job prospects and job security (Brilleau, Roubaud and Torelli, 2005; Kuepie, Nordman and Roubaud, 2008). So to understand African labour market dynamics, it is vital to understand what determines access to the different segments and especially the role of social origin.
The more labour market positioning depends on social origin, the less the principle of fair equality of opportunity defined by Rawls (1971) is respected. This principle states that, “Assuming that there is a distribution of natural assets, those who are at the same level of talent and ability, and have the same willingness to use them, should have the same prospect of success regardless of their initial place in the social system,” (Rawls 1971, p.63). In addition to meeting a social justice goal, equality of opportunity on the labour market fulfils an economic efficiency criterion. This is pointed up by the 2006 World Bank World
Development Report, which makes the reduction of unequal opportunities a core development
policy issue. A reduction in inequalities of opportunity on the labour market improves the allocation of human capital, there where its returns are the highest.
The economic and sociological literature finds a number of mechanisms at work behind the intergenerational transmission of labour market position. The parents’ occupational status can directly impact on the children’s occupational status via the transmission of three types of capital: physical capital, human capital and social capital. The parents’ occupational status can help them build up physical capital that they can then pass on to their children. In a credit constrained environment, the inheritance of physical capital conditions access to the socioeconomic groups, which call for an initial investment (Banerjee and Newman, 1993). The parents then accumulate human capital through their occupation. This human capital can take different forms. One form is knowledge of a trade, know-how. Another form is information assets, which encompass knowledge of a professional environment and the optimal actions to take within it, and knowledge of personal ability to work in certain occupations. The transmission of this human capital can lead individuals to choose the same occupation as their parents (Hassler and Mora, 2000; Galor and Tsiddon, 1997; Sjörgen, 2000). Lastly, parents can build social capital in the course of their work, in particular a social network and professional values that they can pass on to their children to make it easier for them to enter the profession in question (Lin, Vaughn and Ensel, 1981).
However, the parents’occupational status can also indirectly influence their children’s position on the labour market by determining their level of education, which in turn conditions occupational status. Numerous authors have shown that social origin is decisive in the acquisition of education, particularly via capital market imperfections, the
intergenerational transmission of abilities, and by conditioning motivation to study.1 The parents’ occupational status can effectively condition the resources they have available to educate their children, but also the children’s motivation to study and the returns expected from that education.
The purpose of this paper is twofold. It sets out first to compare the extent of inequality of labour market opportunities in seven West African commercial capitals: Abidjan, Bamako, Dakar, Cotonou, Lomé, Niamey and Ouagadougou. The extent of inequality of opportunity is defined here as the net association between individuals’ labour market positions and their fathers’ positions, i.e. the link irrespective of structural labour market effects. This comparison identifies the characteristics of the countries with the highest levels of inequality of opportunity and provides elements for an appraisal of the different theories that explain the differences in inequality of opportunity among the countries.
The second purpose is to estimate, for each of the cities, the extent to which the father’s occupational status has a direct effect on labour market position or whether the effect is indirect via his education. The public policy implications are extremely different in the two cases. In the first case, opportunity levelling policies need to focus directly on the labour market. In the second case, they need to focus upstream on the education system.
Comparative studies of the inequality of opportunity and social mobility take a quantitative sociology approach, seeking to evaluate which factors explain the differences between countries. With data thin on the ground, there are hardly any comparative studies of the developing countries. Most of these studies look at the developed countries (Erikson and Goldthorpe, 1992). Only a few studies include a handful of developing countries in their databases (Grusky and Hauser, 1984; Ganzeboom, Luijkx and Treiman, 1989), applying the same social stratification to them as used for the developed countries. Yet as shown by numerous authors, this stratification does not consider the particularity of labour markets in developing countries with their predominant informal sector (Benavides, 2002; Pasquier-Doumer, 2005). Specific studies of the developing countries are therefore called for to take account of the labour market structure in these countries.
Although Africa has the highest income inequalities after Latin America (World Bank, 2005), there are, to our knowledge, only three comparative studies of the dynamics of these inequalities in Africa. These three studies are by Bossuroy and Cogneau (2008), Cogneau et
al. (2007) and Cogneau and Mesplé-Somps (2008). All three use the same data from
representative surveys of five African countries: Ghana, Uganda, Côte d’Ivoire, Guinea and Madagascar. The first two studies look at social mobility, while only the third focuses on the inequality of income opportunity. Yet they all come up against a comparability problem in terms of the different surveys’ occupational classifications, in particular the father’s job. This forces the authors to highly aggregate these classifications, ending up with just two groups: agricultural activities and non-agricultural activities.
The 1-2-3 Survey data offer both highly detailed information on the father’s occupational status and excellent comparability, this latter point being the drawback of most comparative studies of this kind (Björklund and Jäntti, 2000). They can therefore be used for a detailed analysis of the inequality of opportunity taking in a number of labour market aspects, namely institutional sector and socioeconomic group.
The first part of this paper presents the setting and the data. The second section looks at the inequality of opportunity in access to institutional sectors and the third at the inequality of opportunity in access to socioeconomic groups. The last part presents the conclusions.
1. Setting and data
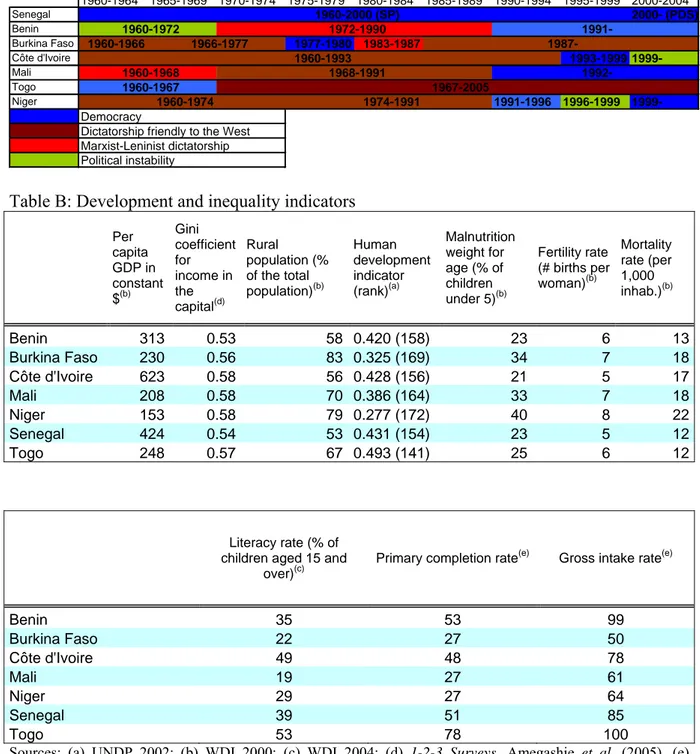
This study focuses on the commercial capitals of the seven French-speaking West African Economic and Monetary Union (WAEMU) countries: Benin, Burkina Faso, Côte d’Ivoire, Mali, Niger, Senegal and Togo.2
Benin, Côte d’Ivoire, Senegal and Togo are all coastal countries with a higher level of wealth on the whole than the landlocked countries of Burkina Faso, Mali and Niger. The human development index makes an even sharper distinction between these coastal and landlocked countries (see Appendix 1).
During the colonial period, the countries were all part of French West Africa, with the exception of Togo.3 Their administrative system has therefore been largely influenced by the French system. Yet as suggested by Cogneau et al. (2007), the coloniser’s identity could well have influenced the country’s long-run social structure and especially the inequality of opportunity. The authors compare five countries and show that, for these countries, the inequality of economic opportunities is much more prevalent in the former French colonies than in the former English colonies. These seven countries went their separate political ways as of 1960. These paths are presented in a simplified table in Appendix 1.
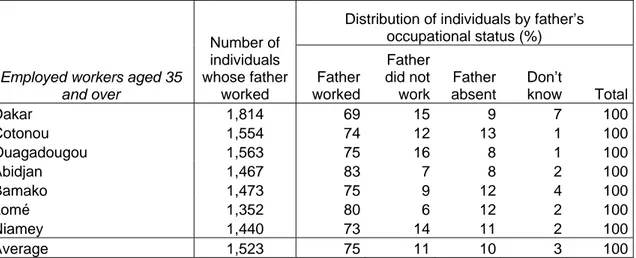
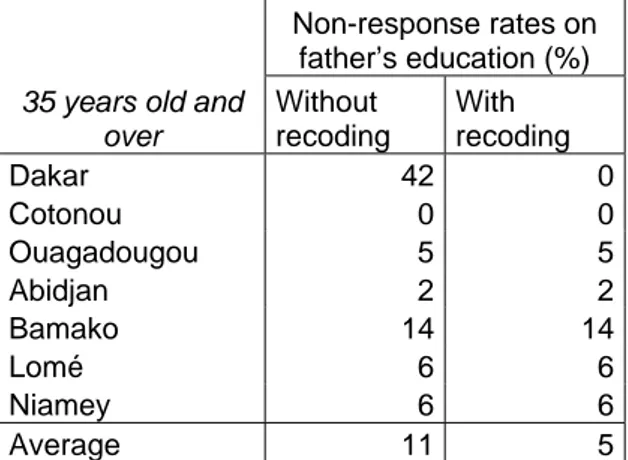
The data used for each country are drawn from Phase 1 of the 1-2-3 Surveys conducted in the commercial capitals of the WAEMU countries in 2001 and 2002. The surveys show, for each respondent, the father’s level of education along with the father’s socioeconomic group, business type and business sector when the respondent was 15 years old. It is rare to find such detail on the father’s occupational status in developing countries. In addition, the wording of the questions and the response options are identical from one city to the next. This makes for a robust and highly detailed comparison of the cities. Most studies on unequal opportunities often have to make a trade-off between these two aspects. The specification of the respondent’s age as 15 years old when the father worked in the job described ensures that all the fathers were more or less in the same part of their life cycle, particularly their working life cycle, and that this was the job worked just before their children entered the labour market. The comparability between the individuals’ work and their fathers’ work is guaranteed when the individuals are placed in the same part of their life cycle as their fathers. We have therefore withdrawn from the sample all the individuals under 35 years old on the assumption that, below this age, they have not yet reached the level of professional maturity their fathers were at when the individuals were 15 years old. Retaining only the employed workers whose father worked, we end up with some 1,500 observations per city. The non-response rates are presented in detail in Appendix 2.
However, these data do not paint a representative picture of the labour market structure for the entire generation of fathers. We only observe the occupational status of fathers whose children were working in one of the seven West African commercial capitals at the time of the
2 WAEMU includes an eighth member state, Guinea-Bissau.
3 Today’s Togo was a German colony from 1885 to 1914 and then a French colony under international mandate from 1919 to 1960.
survey. Nevertheless, they do allow for an analysis and cross-country comparison of the professional trends of families currently living in the main urban centres. In particular, we study the strength of the association between the labour market situation of these cities’ inhabitants and their fathers, which is the inequality of opportunity measurement used in this study.4
2. Inequality of opportunity in access to institutional sectors
This section looks at whether having a father working in a given institutional sector secures a comparative advantage in terms of access to this same sector. If this is the case, a number of questions are raised. In which sector is this advantage the greatest? Do all seven cities display the same extent of inequality of opportunity in access to an institutional sector? Does the intensity of this inequality vary from one sector to another in the same way across the seven cities? What differentiates the cities with the least inequality of opportunity from the other cities? What is the causal link between an individual’s institutional sector and the father’s institutional sector? Is the link direct or indirect via education?
2.1. Institutional sector trends
The definition of institutional sectors used here is designed to reflect the labour market segmentation phenomenon (Barlet and De Vreyer, 2009) in the WAEMU capitals, distinguishing between formal sector and informal sector. The individuals interviewed by the survey are therefore considered part of the informal sector if they work in an unregistered business. However, we do not know whether the business in which the father worked was registered or not. We therefore consider that the fathers were in the informal sector if they worked in a very small business, an associative business, for a household or in self-employment. We then separate out the formal sector’s public and semi-public workers from its private sector workers to test the assumption that access to the public sector is more conditioned by social origin than access to the formal private sector. The three sectors considered are therefore the public and semi-public sector, the formal private sector, and the informal sector.
The distribution of workers by institutional sector differs quite a bit from city to city. In Bamako, Ouagadougou and Niamey, the public sector employs a significantly larger proportion of the labour force than in Abidjan, Dakar, Lomé and Cotonou (some 20% as opposed to 14% on average in the other four cities). In Ouagadougou and Niamey, moreover, the public sector share rises sharply between the fathers and their children, whereas the opposite trend is found in Dakar, Lomé and Cotonou (Chart 1).5
The differences in the distribution of informal sector workers are less clear cut. There is no significant difference between the countries. However, Niamey, Ouagadougou, Bamako and Abidjan differ from the other cities in terms of informal sector trends between fathers and
4 It would have been useful to compare women’s occupations with their mothers’ occupations, since the mother is potentially the main reference for these women. However, as with all studies on social mobility, there is too great a loss of observations due to the mothers’ low labour force participation rate. The methodological choice to take the father as the benchmark consequently underestimates the mobility of women on the whole.
5 Looking solely at respondents born in the city to obtain a sample more representative of the distribution of city worker fathers’ institutional sectors, Ouagadougou and Niamey still stand out from the other cities because there is no significant decrease in the public sector share between the fathers and their children.
their children. The workers in these cities work less frequently in the informal sector than their fathers, whereas the opposite is true in the other cities (Chart 1).6
The trend in the formal public sector is the same across all the countries, as the share of this sector increases between the fathers and their children in all seven capitals. Nevertheless, Abidjan and Dakar stand out for the magnitude of their formal private sector: the share of employed workers working in the formal private sector when the survey was taken is twice as high as in the other cities (20% as opposed on 11% on average).
Chart 1: Distribution of respondent workers and their fathers by institutional sector
Source: 1-2-3 Surveys, Phase 1, author’s calculations. Coverage: individuals aged 35 years and over
2.2. More or less socially distant institutional sectors depending on the country
This section evaluates the extent to which access to an institutional sector is conditioned by the father’s institutional sector, and compares the cities on the basis of this criterion. Given that the three institutional sectors display different distributions and trends from one city to the next, we need to measure the link between the respondent’s institutional sector and the father’s institutional sector irrespective of the distributions of respondent and father workers. This link is the net social mobility also known as social fluidity in the literature. Social fluidity therefore measures the change in the relative chances of individuals from different social origins attaining a given social status. An odds ratios analysis compares cities by level of social fluidity.
Odds ratios reflect the outcome of competition between individuals whose fathers worked in different institutional sectors to enter one rather than another sector. More precisely, they represent the relative inequality between two individuals whose fathers worked respectively in sector i and sector i’ in their chances of attaining group j’ rather than j. The odds ratio is defined as follows:
6 Taking the sub-sample of respondents born in the city, Ouagadougou, Abidjan and Niamey stand out from the other cities with a proportion of informal sector workers that does not significantly increase between the fathers and their children.
' ' ' ' ' ' ' ' ' ' ij j i j i ij j i j i ij ij j j i i n n n n n n n n OR = = −
− where nijis the number of observations in cell (i, j) of the transition
matrix whose rows i represent the fathers’ three institutional sectors and columns j the respondents’ institutional sectors.
The odds on attaining sector j’ rather than j are ' ' j j i i OR −
− times higher for an individual whose father worked in sector i’ than for an individual whose father worked in sector i. An odds ratio of one indicates that having a father in sector i’ secures no comparative advantage over having a father in sector i when it comes to entering j’. The further the odds ratio is from one, the lower the social fluidity between two institutional sectors. The particularity of odds ratios is that they provide a measurement of the statistical association between two variables regardless of the marginal distributions. Chart 2 presents the odds ratios for the seven cities between the public sector and the formal private sector, between the public sector and the informal sector, and between the formal private sector and the informal sector.
Chart 2: Odds ratios for the three institutional sectors
A- Odds ratios between public sector and formal private
sector B-Odds ratios between public sector and informal sector
C- Odds ratios between formal private sector and
informal sector D- Overall odds ratios
Note: For each city, the median, represented by a diamond, corresponds to the odds ratio. The lower and upper limits, represented by a horizontal bar, correspond to the limits of a 90% confidence interval.
The comparison of charts 2A, 2B and 2C, represented by Chart 2D, reveals a first finding. In most of the cities, the public-informal sector transition is the least fluid socially speaking. In other words, the social distance between the informal sector and the public sector is generally much greater than the social distance between the public sector and the formal private sector or between the formal private sector and the informal sector. However, the social distance between the formal private sector and the public sector is more or less the same in most of the cities as the social distance between the formal private sector and the informal sector. In Bamako, for example, an individual whose father worked in the public sector has approximately six times more chance of entering the public sector than an individual whose father worked in the informal sector. His comparative advantage is three times lower, however, compared with an individual whose father worked in the formal private sector. The relative advantage in terms of formal private sector access for an individual with a formal private sector “origin” compared with an individual with an informal sector “origin” is more or less the same: he is twice as likely as the latter to work in the formal private sector. However, this observation does not hold for all the cities. In Lomé and Cotonou, the social distances between the sectors are virtually the same. Moreover, having a father working in the public sector in Cotonou secures no advantage in access to the public sector over having a father working in the formal private sector: two individuals whose fathers worked respectively in the formal private sector and in the public sector have 1.7 times more chance (=1/0.6) of swapping their positions than of working in the same sector as their fathers. So the mobility tables suggest that half of the individuals working in the formal private sector in Cotonou have a father who worked in the public sector. This proportion stands more at around 30% in the other cities. Bear in mind, also, that Cotonou is the city with the highest proportion of fathers working in the public sector. Furthermore, a look at cohort changes in the proportion of public sector workers shows that it is in Cotonou that the public sector has shrunk the most, between the generation born from 1930 to 1939 and the generation born from 1960 to 1969 (-20 points versus -9 points on average in the seven cities). This sharp reduction in the public sector could explain the relative disadvantage of those whose fathers worked in the public sector compared with those whose fathers worked in the private sector. Lastly, Niamey displays the particularity of a smaller social distance between the formal private sector and the informal sector than between the public sector and the formal private sector.
These charts are then used to compare the cities on the basis of the social fluidity they offer in the intergenerational transition from one institutional sector to another. On the whole, the cities post greater differences in fluidity between the public sector and the informal sector, and then between the public sector and the formal private sector. The social distances between formal private sector and informal sector are not significantly different from one city to the next, with the exception of Ouagadougou, which has a significantly greater social distance than those observed in Abidjan and Dakar.
When it comes to social fluidity between the public sector and the formal private sector, two contrasting groups of cities are found: Niamey and Ouagadougou post significantly higher social rigidity than Cotonou, Abidjan and Dakar since disjoint confidence intervals are found between these two groups. In Niamey, having a father in the public sector gives the individual four times more chance of working in the public sector than having a father in the formal private sector. This ratio is a mere 1.1 in Abidjan, indicating virtual equality of
opportunities to enter the formal private sector among individuals of public sector “origin” and individuals of private sector “origin”.
The same groups are found when looking at fluidity between the public sector and the informal sector, save Bamako which joins the group of least fluid cities. In Cotonou, Lomé and Dakar, the odds ratio is an average of 2.4 whereas it stands at an average of 5.3 in Niamey, Ouagadougou and Bamako.
Unidiff log-linear modelling7 is used to summarise these findings and propose an ordering of the cities covering all three dimensions. This provides a composite measure of how the association between two qualitative variables – the respondent’s sector and the father’s sector – differs depending on a third variable, the city, regardless of the categories of the two qualitative variables considered. This composite measure is called the β parameter or the intensity parameter. Appendix 3 presents this modelling in greater detail. The change in the intensity parameter therefore represents the intercity variation in social inequalities in access to an institutional sector. Let the value of the parameter be 1 for Dakar. A parameter above 1 (respectively below 1) represents a stronger (respectively weaker) intensity of unequal opportunities. To be more precise, this assumes that all the odds ratios increase with the same intensity β between Dakar and the other city k considered, and this for the three institutional k sectors. Chart 3 presents the parameters for each city. The significance of the differences between each of the parameters has been systematically tested (see Appendix 3) and used to define groups of cities, represented on the chart.
Chart 3: Parameters of intensity of the link between the institutional sector of individuals and their fathers (Unidiff model beta parameters)
Source: 1-2-3 Surveys, Phase 1, author’s calculations. Coverage: individuals aged 35 years and over
Interpretation: Abidjan’s intensity parameter is not significantly different to Lomé’s or Bamako’s, but is significantly different to Niamey’s intensity parameter. Bamako’s intensity parameter is not significantly different to Niamey’s or Abidjan’s, but is significantly different to Lomé’s intensity parameter.
This analysis shows that the seven West African capitals offer some very different opportunities in terms of institutional sector access. Two groups of cities emerge. The first group is made up of the coastal cities of Dakar, Cotonou, Lomé and Abidjan. These cities all have a low level of inequality of opportunity compared with the other cities. The second group comprises Bamako, Niamey and Ouagadougou, whose inequality-of-opportunity level is nearly two-thirds higher than the other group. Abidjan and Bamako form the grey area between the two groups.8
Note that in the study by Cogneau et al. (2007), Côte d’Ivoire, the only country featured in both studies, is found to have a much higher level of inequality than in the two English-speaking countries studied (Uganda and Ghana).
The cities in the group with the least social fluidity are the capitals of countries that share a certain number of characteristics (see Appendix 1). Mali, Burkina Faso and Niger are all landlocked countries. They have the lowest human development index rankings of the seven countries studied. They also have the lowest levels of education and literacy. Conversely, they have the highest rates of mortality and malnutrition. Urbanisation is lower in these countries as a much higher percentage of the population is rural than in Benin, Côte d’Ivoire, Senegal and Togo. Moreover, their fertility rates are at least one point higher than the other four countries.
These findings appear to concur with the liberal theory of social mobility (Parsons, 1960; Blau and Duncan, 1967; Treiman, 1970), which states that the more industrialised a society, the more meritocratic the labour market selection criteria due to the increase in the demand for skilled labour and urbanisation prompting geographic mobility and reducing the feeling of community. However, the sample of countries, with its seven observations, is too small to draw any real conclusions on this point.
Another observation is that the cities with the highest inequality of opportunity are not the most income inegalitarian when ranked by Gini coefficients calculated on the basis of these same surveys.9 This finding differs from the comparative analysis by Cogneau et al. (2007) of
Ghana, Uganda, Côte d’Ivoire, Madagascar and Guinea. This difference in findings can be explained by the fact that the countries we look at have income inequality levels that are too similar to be able to capture a link between inequality of opportunity and inequality of income, which is not the case with the Cogneau et al. study.
Lastly, contrary to certain sociological arguments (Parkin, 1971), there does not appear to be a link between the political regime and inequality of opportunity: the three countries with the highest inequality of opportunity do not have any more similarities among them than they do with the other countries (see Appendix 1).
8 This coastal/landlocked city division is robust to the change in the definition of the informal sector: if we define the respondent’s informal sector in the same way as it is defined for the fathers, i.e. working in a very small business, for a household or in self-employment, Ouagadougou, Niamey and Bamako still come out with a high level of unequal opportunities compared with Cotonou, Lomé, Dakar and Abidjan, although with Abidjan forming a grey area.
2.3. The role of education in the inequality of opportunity in institutional sector access The above analysis gives an overview of the inequality of opportunity in access to the different institutional sectors. However, it only takes into account one aspect of social origin in the form of the father’s institutional sector. It does not provide any information on the causal link between the father’s institutional sector and his children’s sector. Is the effect of the father’s institutional sector direct or does it determine another of the individuals’ characteristics such as their level of education, which in turn influences access to an institutional sector?
This section studies the previous findings in more detail, considering a broader definition of social origin that includes place of birth and ethnic group and takes into account the individual’s level of education. The purpose of this is to clarify the channel through which social origin affects access to an institutional sector.
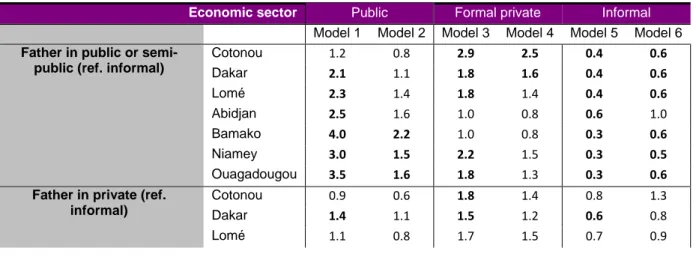
We start by estimating a logit model for each city to explain the probability of entering one institutional sector rather than the two others based on four aspects of social origin (the father’s institutional sector, whether or not the father went to school, place of birth and ethnic group), while controlling for respondent gender. This gives us Model 1 for access to the public sector, Model 3 for access to the formal private sector, and Model 5 for access to the informal sector. Note that ethnic group is measured here as membership of the city’s majority ethnic group, with the exception of Côte d’Ivoire where the reference is membership of the Akan, Krou and Southern Manding ethnic groups10 to test the hypothesis of a social division of labour based on “ivoirité”. We then estimate the same models including the respondents’ levels of education. This produces models 2, 4 and 6 for access to the public sector, formal private sector and informal sector respectively. If social origin is still found to have a significant effect in these models, then it has a direct effect on access to the institutional sectors. If the effect is no longer significant, then the effect of social origin is indirect since it influences the level of education attained, which in turn determines the institutional sector. Table 1 presents the odds ratios obtained from the estimation of these logit models (a total of 6×7 = 42 models).
Table 1: Logit estimation of the effects of social origin on access to the public, formal private and informal sectors
Economic sector Public Formal private Informal
Model 1 Model 2 Model 3 Model 4 Model 5 Model 6
Father in public or semi-public (ref. informal)
Cotonou 1.2 0.8 2.9 2.5 0.4 0.6 Dakar 2.1 1.1 1.8 1.6 0.4 0.6 Lomé 2.3 1.4 1.8 1.4 0.4 0.6 Abidjan 2.5 1.6 1.0 0.8 0.6 1.0 Bamako 4.0 2.2 1.0 0.8 0.3 0.6 Niamey 3.0 1.5 2.2 1.5 0.3 0.5 Ouagadougou 3.5 1.6 1.8 1.3 0.3 0.6 Father in private (ref.
informal)
Cotonou 0.9 0.6 1.8 1.4 0.8 1.3
Dakar 1.4 1.1 1.5 1.2 0.6 0.8
Lomé 1.1 0.8 1.7 1.5 0.7 0.9
10 The Akan are made up mainly of the Baoulé, Agni and Ebrié. The Krou count primarily the Bété, Krou and Bakoué groups. The Southern Manding cover the Guro, Dan and Gagu groups. These groups compare here with the Northern Manding groups (Dioula, Malinké, Koro, etc.) and the Voltaic ethnic group (Kulango, Lobi, Birifor, etc.).
Abidjan 2.0 1.8 0.8 0.7 0.8 1.0
Bamako 2.3 1.9 1.0 0.9 0.6 0.7
Niamey 0.8 0.4 2.8 2.5 0.6 1.0
Ouagadougou 1.5 0.6 2.0 1.5 0.5 1.2
Born in the city of ... Cotonou 0.5 0.5 1.0 1.2 1.6 1.4
Dakar 0.9 0.8 1.1 1.0 1.0 1.2 Lomé 0.6 0.7 0.9 0.8 1.5 1.5 Abidjan 0.9 0.9 1.3 1.2 0.9 0.9 Bamako 1.0 0.8 1.7 1.6 0.8 0.8 Niamey 0.9 0.7 1.4 1.3 1.0 1.1 Ouagadougou 0.8 0.8 1.1 1.1 1.2 1.1
Member of the majority ethnic group Cotonou 1.4 1.3 0.9 0.9 0.8 0.9 Dakar 0.9 0.9 0.7 0.7 1.4 1.4 Lomé 0.7 0.8 1.1 1.1 1.2 1.1 Abidjan 4.4 2.2 2.0 1.4 0.3 0.5 Bamako 1.0 1.2 0.7 0.7 1.3 1.1 Niamey 1.2 1.4 0.9 0.9 0.9 0.8 Ouagadougou 0.5 1.0 0.5 0.6 2.5 1.5
Gender (ref. female) Cotonou 3.1 1.6 4.8 3.0 0.2 0.3
Dakar 2.0 1.6 4.1 4.2 0.2 0.2 Lomé 3.4 1.8 5.8 4.0 0.2 0.3 Abidjan 2.3 1.2 4.6 3.6 0.2 0.3 Bamako 1.6 1.1 6.8 6.2 0.3 0.3 Niamey 1.8 1.3 4.6 3.8 0.3 0.4 Ouagadougou 2.1 1.6 2.9 2.6 0.3 0.4
Father went to school Cotonou 2.1 1.2 1.2 0.7 0.5 1.1
Dakar 1.6 1.4 1.8 1.5 0.5 0.6 Lomé 1.1 0.6 1.6 1.3 0.7 1.2 Abidjan 1.2 0.7 2.0 1.7 0.5 0.7 Bamako 1.5 0.9 1.3 1.2 0.6 0.9 Niamey 1.7 0.9 1.3 1.0 0.5 1.1 Ouagadougou 1.1 0.7 1.6 1.3 0.7 1.3
Primary school complete or lower secondary school incomplete (ref. < primary
complete) Cotonou 5.1 2.2 0.3 Dakar 5.2 2.0 0.3 Lomé 3.4 2.5 0.3 Abidjan 5.5 2.6 0.3 Bamako 3.4 1.4 0.5 Niamey 4.8 2.8 0.2 Ouagadougou 6.3 2.7 0.2
Lower secondary school complete and above (ref. <
primary complete) Cotonou 17.2 7.4 0.0 Dakar 13.2 2.9 0.1 Lomé 13.5 3.4 0.1 Abidjan 25.0 2.8 0.9 Bamako 19.9 2.3 0.1 Niamey 18.1 3.3 0.0 Ouagadougou 24.5 3.5 0.0
Source: 1-2-3 Surveys, Phase 1, author’s calculations. Coverage: individuals aged 35 years and over
Interpretation: Model 1 finds that having a father in the public sector in Dakar raises the odds11 of working in the public sector by 2.1 compared with a father in the informal sector. In other words, the probability of working in
11 The odds express the ratio of two converse probabilities. In this case, it is the probability of working in the public sector divided by the probability of not working in the public sector.
the public sector divided by the probability of not working in the public sector increases, other things being equal, by 110% when the father worked in the public sector rather than in the informal sector.
Note: the odds ratios in bold type correspond to significant coefficients at the 10% level.
Access to the public sector
Models 2 show that the least fluid cities of Bamako, Niamey and Ouagadougou have a particularity in that the father’s institutional sector has a distinct effect on entry into the public sector, irrespective of its impact on the level of education. In these cities, other things being equal, having a father who worked in the public sector significantly increases the chances of working in the public sector compared with having a father in the informal sector. These odds are multiplied by 2.2 in Bamako and by 1.6 and 1.5 in Ouagadougou and Niamey. So in the capitals of WAEMU’s three landlocked countries, the father’s occupational status has a direct effect on access to the public sector via the transmission of human capital other than education (knowledge of a professional environment, know-how, penchant for the public sector, etc.) and even social capital.
In Bamako and Niamey, having a father in the formal private sector also has a significant effect on reaching the public sector compared with the effect of having a father in the informal sector. This effect is positive in Bamako and negative in Niamey. These findings reflect the short social distance between the formal private and informal sectors in Niamey, and between the public sector and the formal private sector in Bamako. This distance is already present in Chart 2D and is found again when considering other aspects of social origin, level of education and also gender.
In Niamey, the inequality of opportunity is aggravated by the significant role played by ethnic group in access to the public sector. Being a member of the Djerma ethnic group raises the chances of entering the public sector irrespective of level of education, gender, place of birth or father’s occupation. Conversely, it significantly reduces the probability of entering the informal sector (Model 6). Although the Djerma are a minority in the country (22% of the population as opposed to 56% for the Haoussa12), they live in the western part of the country and are consequently the majority ethnic group in Niamey. The Djerma are also the first to have taken up senior positions in the colonial administration and army. Moreover, the three leaders of Niger from independence through to 1993 came from this ethnic group.13
However, Niamey and Bamako are the only cities, along with Abidjan, where, given identical levels of education and taking into account ethnic group, place of birth and the father’s institutional sector and schooling history, being a woman is not a disadvantage in terms of access to the public sector.
In the other cities, having a father working in the public sector has no effect on access to this sector. Once its effect on the level of education has been taken into account, the father’s institutional sector is no longer a determinant of entry into the public sector. This holds for all cities except Cotonou, where having a father in the private sector is a disadvantage, and Abidjan, where it is an advantage compared with having a father in the informal sector. These findings reflect more than an intergenerational transmission of labour market position. They are a sign of a short social distance between sectors, especially public and formal private sectors, in Cotonou and a wide social distance between public and informal sectors in Abidjan
12 Gazibo, 2009.
where the public and formal private sectors are very close (see Chart 2D). We can therefore conclude that, in Dakar, Cotonou, Lomé and Abidjan, the father’s institutional sector plays an indirect role in access to the public sector by determining the level of education. However, other aspects of social origin come into play in access to the public sector.
The public sector in Cotonou and Lomé is, other things being equal, more open to migrants. Migrants here are defined as individuals born outside the city. This finding is runs counter to the expectation that being born in the city would generate social capital fostering entry into the public sector. This finding could be interpreted as favouritism towards individuals from certain regions when it comes to recruitment into the public and semi-public sectors. We take the working individuals who have not always lived in the capital and compare their distribution of institutional sectors based on their area of residence before migration to the capital. This comparison shows that the public sector is overrepresented in Kozah in Togo, the home prefecture of presidents Gnassingbé Eyadéma, father and son,14 and Natitingou in Benin, the department where President Mathieu Kérékou15 was born. In Cotonou, the inequality of opportunity by region of birth is compounded by a significant ethnic group effect on access to the public sector: members of the Fon, the majority ethnic group in Cotonou, have 1.3 times more of a probability of working in the public sector, other things being equal.
In Abidjan, ethnic group also has a significant effect on access to the public sector. Membership of the Akan, Krou and Southern Manding ethnic groups significantly increases the chances of reaching the public sector, by 2.2 compared with the Northern Manding and Voltaic ethnic groups. The same finding is observed for access to the formal private sector and the opposite result is found for the informal sector (models 4 and 6). This finding ties in with the theory of a social division of labour based on “ivoirité”, which separates the “native” ethnic groups of the South from the “non-native” ethnic groups of the North: “Under Houphouët-Boigny, [...] the economic and social integration of foreigners in urban areas came about relatively easily in the form of a social division of labour, a legacy of the colonial buy-in policy, which could be summed up by the following formula: to the people of Ivoirian “extraction” (the term in use today to describe the populations of the South) go the salaried jobs in the administration and the large public and semi-public corporations; to foreigners and Northerners (especially Dioula) go small trade, transport and casual jobs in the informal sector.” (Banégas, 2009).
Access to the formal private sector
Among the least fluid cities, only Niamey displays a direct effect of the father’s labour market position on access to the formal private sector (Model 4). Social reproduction is found in the formal private sector of this city since having a father working in the private sector significantly increases the chances of working in it oneself. In Ouagadougou and Bamako, however, other aspects of social origin condition access to the formal private sector. In Ouagadougou, given equal characteristics, the Mossi have less chance of entering the formal private sector than the other ethnic groups. This is due to their greater presence in the informal sector (membership of the majority ethnic group has a significant effect in Model 6). In Bamako, place of birth secures a comparative advantage in terms of access to the formal private sector: being born in Bamako significantly furthers this access. One interpretation of
14 Presidents of Togo from 1969 to the present day.
this finding is that being born in Bamako – and implicitly having spent most of one’s life there – promotes the development of a social network required to enter the formal private sector.
The father’s institutional sector has no direct effect on access to the formal private sector in the least fluid cities, with the exception of Dakar and Cotonou, where being of public sector “origin” secures an advantage compared with being of informal sector “origin”. Given equal characteristics, the workers whose father worked in the public sector have 2.5 times more chance of working in the formal private sector in Cotonou and 1.6 times more chance in Dakar. So there is no social reproduction at work, but an intergenerational bridge from the public to the private sector. However, no significant effect is found for the other aspects of social origin except in Dakar where, like in Ouagadougou, membership of the majority ethnic group (the Wolof) reduces the probability of entering the formal private sector and increases the chances of working in the informal sector.
Lastly, note that women in all the cities are at a greater disadvantage compared with the men when it comes to entering the formal private sector rather than the public sector.
Access to the informal sector
There is not much to distinguish between the seven cities in terms of the role of the father’s occupational status in access to the informal sector (Model 6). With the exception of Abidjan, having a father who worked in the informal sector raises the probability of working in the informal sector across all the cities, compared with the individuals whose father worked in the public sector, irrespective of level of education. In Abidjan, the father’s status has no significant direct effect.
However, the effect of membership of the ethnic majority differs from one country to the next: it is zero in Cotonou, Lomé and Bamako; significantly positive in Dakar and Ouagadougou, and significantly negative in Abidjan and Niamey, as already mentioned.
The same holds true for the place of birth: being born in the city increases the probability of working in the informal sector in Cotonou and Lomé. This effect is the counterpart to the negative effect of birth in the city on access to the public sector.
Lastly, gender is a discriminating factor in access to the informal sector in all the cities, with women having a higher probability of working in this sector than men.
Inequality of educational opportunity
It is interesting to compare these findings with the inequality of educational opportunity observed in the seven cities. The inequality of educational opportunity corresponds to the association between the individual’s level of education and social origin, after taking into account the distributions of these two variables. In other words, when defining social origin by the father’s level of education, equality of opportunity holds when individuals whose fathers have a level of education i have the same probability of attaining a level of education j as the individuals whose parents have a level of education j, irrespective of the levels of
education i and j. We have considered here three levels of education16. To compare the seven cities from the point of view of the inequality of educational opportunity criterion, we again use the Unidiff log-linear modelling and its β intensity parameter, which represents the intercity variation in social inequalities in access to a given level of education. Let the value of the parameter again be 1 for Dakar. The parameters for each city are presented in Chart 4.
Chart 4: Parameters of the intensity of the link between the level of education of individuals and their fathers (Unidiff model beta parameters)
0 0,5 1 1,5 2 2,5 Cot ono u Dak ar Lom é Abidj an Bam ako Niam ey Ouagadoug ou
Source: 1-2-3 Surveys, Phase 1, author’s calculations. Coverage: individuals aged 35 years and over
The ordering of the cities by level of inequality of opportunity is the same for educational opportunity as for the probabilities of accessing one of the three institutional sectors: Cotonou, Dakar and Lomé display the lowest social rigidity, followed by Abidjan, Bamako, Niamey and Ouagadougou in ascending order. The ordering of inequality of educational opportunity is robust to the choice of social origin variable: the countries’ respective positions are the same if social origin is measured by the father’s institutional sector.
Significance tests on the differences between the seven cities’ parameters turn up three groups of cities, shown in Chart 4. Cotonou, Dakar and Lomé display a similar level of inequality of opportunity, which is lower than in the other four West African cities. The odds ratio analysis shows that, in these three cities, individuals whose fathers have at least completed lower secondary school are approximately seven times more likely to complete lower secondary school themselves than individuals whose fathers never completed primary school. The inequality of educational opportunity is one-third higher in Abidjan, Bamako and Niamey than in the first group of cities. The abovementioned odds ratio value is around 17 for this group. Ouagadougou stands out from all the other cities for its particularly high inequality of educational opportunity. In this city, the abovementioned odds ratio is 25.
16 Primary school incomplete, between primary school complete and lower secondary school incomplete, and lower secondary school complete and above.
These results clarify the previous findings and can be used to define a typology of cities by the causal link that connects the individuals’ institutional sectors to their fathers’ institutional sectors:
- Cotonou, Dakar and Lomé display moderate inequalities of opportunity in institutional sector access compared with the other cities, and the father’s institutional sector mainly has an indirect effect on access to an institutional sector by conditioning the level of education attained by the individuals.
- In Abidjan, the link between the individuals and their fathers’ institutional sectors is also essentially indirect. However, Abidjan has a higher inequality of educational opportunity than the above three cities and consequently borders the previous group in terms of inequality of opportunity in institutional sector access. - Bamako, Niamey and Ouagadougou combine the direct effect of the father’s
institutional sector on their children’s sector with an indirect effect via the relatively high level of education. These two cumulative effects place these cities in the group with the highest inequality of opportunity in access to an institutional sector.
Therefore, a policy to reduce the inequality of educational opportunity in Cotonou, Dakar, Lomé and Abidjan would greatly reduce the inequality of opportunity in access to the different institutional sectors (Box 1). In Bamako, Niamey and Ouagadougou, however, such a policy would fall short of the mark if the observed direct effect of the father’s position were due to the existence of inheritable social or information capital that the parents have built up as a result of their position on the labour market. In the long run, however, levelling the educational playing field via extensive changes to society’s standards and values could reduce the direct effect of the father’s status on labour market position. Box 1: Policies to reduce the inequality of opportunity in Africa
A- Reduce the inequality of educational opportunity by developing the educational supply
1. Prioritise the poor in public education spending. A number of studies have shown that public education
spending in Africa does not prioritise the disadvantaged. To remedy this situation, some countries have defined
school catchment areas to identify the areas and populations not served by school services and consequently
make more equitable investment choices in terms of new establishments and teacher allocations. Yet this practice is far from widespread. Other countries have opted for new methods of educational resource allocation such as subsidies per pupil sent to the establishments to cover the non-wage expenses practised in many English-speaking countries, but also in Rwanda, Madagascar and Benin. In South Africa, a higher subsidy per pupil is allocated to the establishments when the school educates poor children or is located in a poor area. Teacher allocation standards have been set to be more pro-poor. They advocate a smaller number of pupils per teacher in disadvantaged establishments. These measures have helped reduce what were huge inequalities between state schools during the apartheid period. Nevertheless, despite these measures, the highest unit costs continue to be found in the 20% of state schools attended by the children of the wealthiest families due to the difficulty of sending qualified teachers to poor areas and the impossibility of setting overly different teacher allocation standards for the establishments.
2. Make school more affordable by phasing out school fees in primary education. One of the first countries
to apply such a measure in Africa was Malawi in 1991. The effects were immediately palpable, as seen from the increase in school enrolment from 1.7 million to 2.9 million children in two years. Uganda followed suit in 1997, posting a comparable increase in pupil numbers. Many countries have followed their lead since, including Cameroon in 1999, Tanzania in 2001, Zambia in 2002, Madagascar in 2003 and Burundi in 2005. This reform has had a considerable impact on school enrolment rates in all these countries, particularly among the poorest children and in rural areas. Yet it has not had a positive impact on pupil retention among the poor, mainly due to a lack of flanking measures leading to a sharp downturn in the quality of teaching conditions.
3. Make the education supply more flexible and tailor it to the needs of poor pupils, by relaxing certain regulations that impede enrolment (obligation to present a birth certificate on first registration or to be registered
by the parents, exclusion of pregnant girls and girls who have given birth), changing the school calendar to bring it into line with the agricultural calendar, and developing specific programmes for certain disadvantaged groups (AIDS orphans, child soldiers, disabled children, etc.)
4. Provide access to a good education for the most gifted poor children. Another strategy used by certain
countries is to encourage the highest achieving children to enrol in good schools that will prepare them to enter higher education. Many African countries have prestigious establishments for this purpose: boarding schools and select middle schools/secondary schools where the best pupils are groomed for higher education. Everything depends on the selection process and whether disadvantaged children and rural children are equitably represented in these establishments. There have been attempts to introduce quota practices (in Tanzania, for example), but they have rarely been effectively and fairly implemented in the long run. Other countries have introduced measures targeting underrepresented groups. India has set up special boarding schools for underrepresented castes. It also runs free boarding schools for girls in rural areas to encourage them to graduate to secondary education. Cost considerations keep this type of measure thin on the ground in Africa, but moves could be made to develop it.
B- Reduce the inequality of educational opportunity by increasing the demand for education
1. Reduce the indirect costs of education. There are a number of programmes designed to reduce indirect costs
for the poor to stimulate their demand for education. Among the most popular are the conditional cash transfer and school meal programmes. Conditional cash transfer programmes are highly developed in Latin America. They pay a monthly allowance to poor families on the condition that they send their children to school. The impact assessments of these programmes generally conclude that they significantly raise the poor’s school enrolment and retention in the school system. Projects of this kind are being pilot tested in a certain number of African countries (Tanzania, Nigeria, Kenya and Zimbabwe), but generally without conditionality (Malawi, Zambia, Ghana and Mozambique). No impact assessments have as yet been made of these programmes. School
meal programmes are being run in numerous African countries. Many studies have highlighted the positive
impact of this type of action on pupil participation and attendance. It improves the neediest pupils’ learning capacities and provides an incentive for families to send their children to school and keep them in school. These programmes are especially effective in that they are applied early in the course of education and they target the schools teaching the largest numbers of very poor and vulnerable children.
2. Improve children’s educability. The early childhood years are key to the development of the human brain.
Poor hygiene, malnutrition and abuse in infancy can permanently impair the physical, mental, cognitive and emotional development of newborns and infants. Infancy programmes combining healthcare, vaccination, nutrition and stimulation actions can help reduce inequalities in children’s cognitive development, and the earlier the better.
C- Reduce the inequality of opportunity by developing the labour market
1. Improve access to information on employment opportunities. Little use is made of formal job-seeking
channels in Africa. In the WAEMU capitals, only 10% of workers find their jobs through formal job-seeking channels. The rate of jobseeker registration with employment agencies is very low, due mainly to the low profile of such agencies: 65% of jobseekers not registered with these agencies are simply unaware of their existence. Making the employment agencies more efficient and higher profile would therefore make for more equitable access to the labour market.
2. Help the poor to access the credit market. If the direct intergenerational transmission of labour market
position works via the transmission of physical capital, levelling access to physical capital by improving access to the credit market should make for more equal opportunity on the labour market.
3. Help the poor create a social network that will serve job seeking. Over 60% of the workers in the WAEMU
capitals used their social network to find their job. Even though very little is known as yet about social network characteristics and formation methods in Africa, a policy to develop the poor’s social network would probably reduce the inequality of opportunity on the labour market. One possible course of action would be to develop partnerships between private and public enterprise and the training bodies that cater for the disadvantaged.
3. Inequality of opportunity in access to the socioeconomic groups
A profile of the inequality of opportunity on the labour market in the West African capitals has to consider more than just access to institutional sectors. It also needs to take in socioeconomic group. The 1-2-3 Surveys define nine socioeconomic groups which, like the classification used by Goldthorpe (1980), classify occupations by work relations, distinguishing between those who buy the work of others; those who do not buy the work of others, but do not sell their own work; and those who sell their work. Given the low numbers of four of these socioeconomic groups, the classification chosen has five categories, with the first three defining salaried workers:
- Managers, engineers, supervisors and equivalent, - Non-manual and skilled manual workers,
- Unskilled workers,
- Proprietors and employers,
- Self-employed, family workers and apprentices.
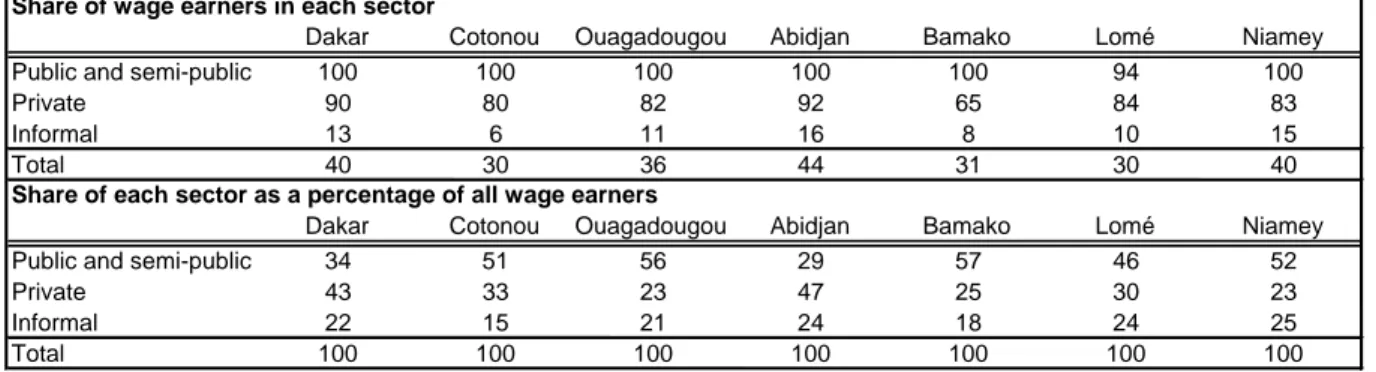
Although institutional sector and socioeconomic group are closely correlated – correlation coefficient of over 0.65 for all the countries – the correlation is far from perfect. This can be seen from Table 2, which cross-tabulates institutional sector and socioeconomic group to differentiate the wage-earning categories from non-wage earners. Although the public sector is made up exclusively of wage earners, 10% to 35% of the formal private sector are non-wage earners, and 5% to 15% of the informal sector are non-wage earners. So virtually one-quarter of wage jobs are found in the informal sector, as opposed to half in the public sector. The findings by institutional sector are therefore not necessarily the same as those for the socioeconomic groups.
Table 2: Link between institutional sector and wage-earning groups
Source: 1-2-3 Surveys, Phase 1, author’s calculations. Coverage: individuals aged 35 years and over
3.1. Socioeconomic group trends
In terms of trend, Cotonou, Lomé and Dakar post no significant change in the distribution of socioeconomic groups between workers employed at the time of the survey and their fathers (Table 3). This is not the case in Ouagadougou, Niamey, Bamako and Abidjan. These cities show a sharp drop in the self-employed, a group overrepresented among the fathers compared with the other cities. Consequently, the proportion of self-employed among respondents is highly similar across the cities. In Ouagadougou, Niamey and Abidjan, this decrease in the self-employed is offset by an increase in wage earners, especially managers. The numbers of proprietors and employers and also unskilled workers are too low
Share of wage earners in each sector
Dakar Cotonou Ouagadougou Abidjan Bamako Lomé Niamey
Public and semi-public 100 100 100 100 100 94 100
Private 90 80 82 92 65 84 83
Informal 13 6 11 16 8 10 15
Total 40 30 36 44 31 30 40
Share of each sector as a percentage of all wage earners
Dakar Cotonou Ouagadougou Abidjan Bamako Lomé Niamey
Public and semi-public 34 51 56 29 57 46 52
Private 43 33 23 47 25 30 23
Informal 22 15 21 24 18 24 25
to be able to identify significant differences between the countries and between fathers and their children.17
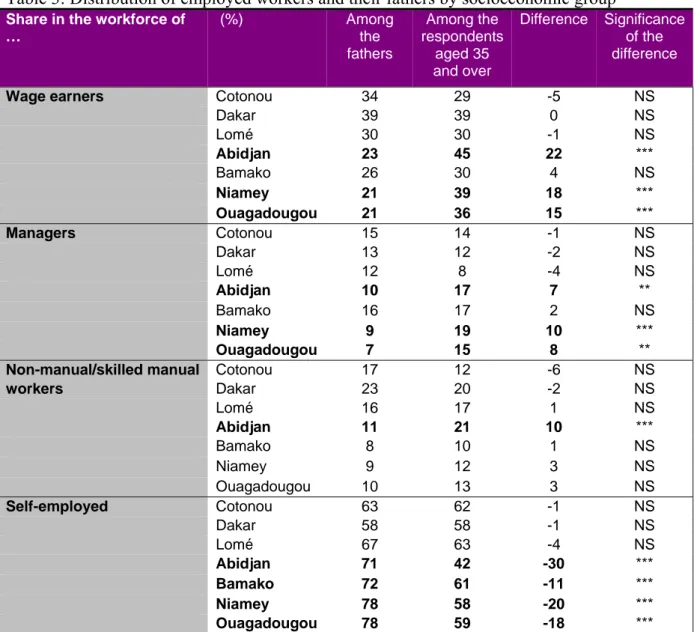
Table 3: Distribution of employed workers and their fathers by socioeconomic group Share in the workforce of
… (%) Among the fathers Among the respondents aged 35 and over Difference Significance of the difference
Wage earners Cotonou 34 29 -5 NS
Dakar 39 39 0 NS Lomé 30 30 -1 NS Abidjan 23 45 22 *** Bamako 26 30 4 NS Niamey 21 39 18 *** Ouagadougou 21 36 15 *** Managers Cotonou 15 14 -1 NS Dakar 13 12 -2 NS Lomé 12 8 -4 NS Abidjan 10 17 7 ** Bamako 16 17 2 NS Niamey 9 19 10 *** Ouagadougou 7 15 8 **
Non-manual/skilled manual Cotonou 17 12 -6 NS
workers Dakar 23 20 -2 NS Lomé 16 17 1 NS Abidjan 11 21 10 *** Bamako 8 10 1 NS Niamey 9 12 3 NS Ouagadougou 10 13 3 NS Self-employed Cotonou 63 62 -1 NS Dakar 58 58 -1 NS Lomé 67 63 -4 NS Abidjan 71 42 -30 *** Bamako 72 61 -11 *** Niamey 78 58 -20 *** Ouagadougou 78 59 -18 ***
Source: 1-2-3 Surveys, Phase 1, author’s calculations. Coverage: individuals aged 35 years and over
Note: *** and ** stand for differences significant at the 1% and 5% levels respectively; NS stands for a difference that is non-significant at the 5% level.
3.2. Inequalities of opportunity in access to socioeconomic groups similar to inequalities of opportunity in access to institutional sectors
17 If only the native city inhabitants are considered, the findings remain unchanged for Ouagadougou and Niamey, which post a significant increase in managers and a significant decrease in the self-employed. This finding holds when public sector managers are excluded. However, Dakar, Cotonou, Abidjan, Bamako and Lomé display a downturn in wage earners – i.e. managers, non-manual and skilled manual workers, and unskilled workers – and a significant increase in non-wage earners – i.e. proprietors and employers, and self-employed, family workers and apprentices.
As with the institutional sector, we set out to measure the link between the socioeconomic groups of respondents and their fathers, irrespective of the distributions of respondent and father workers. We again use the odds ratios for this. These ratios, as we have said, reflect the outcome of competition between two individuals whose fathers belonged to different socioeconomic groups to achieve one rather than another socioeconomic group. Chart 5 presents the odds ratios for all socioeconomic groups in all seven cities. Chart 6 compares the cities in terms of odds ratios for the most represented socioeconomic groups.
Chart 5: Odds ratios for all socioeconomic groups
Source: 1-2-3 Surveys, Phase 1, author’s calculations. Coverage: individuals aged 35 years and over
Chart 5 shows that, across all the cities, the social distances are the greatest between wage-earning and non-wage earning socioeconomic groups. The highest odds ratio in Dakar, Cotonou, Lomé and Ouagadougou is between managers and proprietors/employers. The highest in Abidjan, Bamako and Niamey is between managers and the self-employed.
Chart 6: City comparison by odds ratios between socioeconomic groups
Source: 1-2-3 Surveys, Phase 1, author’s calculations. Coverage: individuals aged 35 years and over
Note: For each city, the median, represented by a diamond, corresponds to the odds ratio. The lower and upper limits, represented by a horizontal bar, correspond to the limits of a 90% confidence interval.
Chart 6 shows firstly that there is no significant difference between cities in terms of social distance between wage-earning groups, whether between managers and non-manual workers (Chart 6A), managers and unskilled workers, or unskilled workers and non-manual/skilled manual workers: the confidence intervals for the odds ratios overlap for all these socioeconomic groups.18 Likewise, the cities do not differ in terms of social distance between the non-wage earners, i.e. between the self-employed and proprietors or employers
18 The confidence intervals for the ORs covering this socioeconomic group are very broad due to a small number of manœuvres.
(Chart 6B). Note, however, that the confidence intervals are very broad due to the low numbers of proprietors and employers.
Yet the cities do not display the same social distances between wage earners and non-wage earners, especially when it comes to managers and the self-employed (charts 6C and 6E). The four coastal cities of Dakar, Abidjan, Lomé and Cotonou have significantly higher social fluidity between wage earners and non-wage earners than Bamako, Niamey and Ouagadougou. As regards the social distance between managers and the self-employed, children of managers in Cotonou and Dakar are four times more likely than children of self-employed fathers to be managers rather than self-employed themselves. In Bamako, Niamey and Ouagadougou, the chances are three times higher.
The Unidiff log-linear modelling generates an ordering of the cities based on a composite measure of social inequalities in access to the five different socioeconomic groups defined here (see Appendix 3). Chart 7 shows the value of the intensity parameter for the seven cities, again normalising this value to 1 for Dakar.
Chart 7: Parameters of the intensity of the link between the socioeconomic group of individuals and their fathers
Source: 1-2-3 Surveys, Phase 1, author’s calculations. Coverage: individuals aged 35 years and over
The countries are found to be in the same groups for inequality of opportunity of access to an institutional sector as for inequality of opportunity of access to a socioeconomic group. Here again, Bamako, Niamey and Ouagadougou stand out from the other cities for their high levels of inequality of opportunity.
3.3. The role of education in the inequality of opportunity of access to wage-earning socioeconomic groups
As with the institutional sector, we need to look into the causal link between the socioeconomic group of father and child. So we again study whether the father’s socioeconomic group has a direct effect on attaining a given socioeconomic group or whether the effect is indirect in terms of conditioning the level of education achieved. Given that the
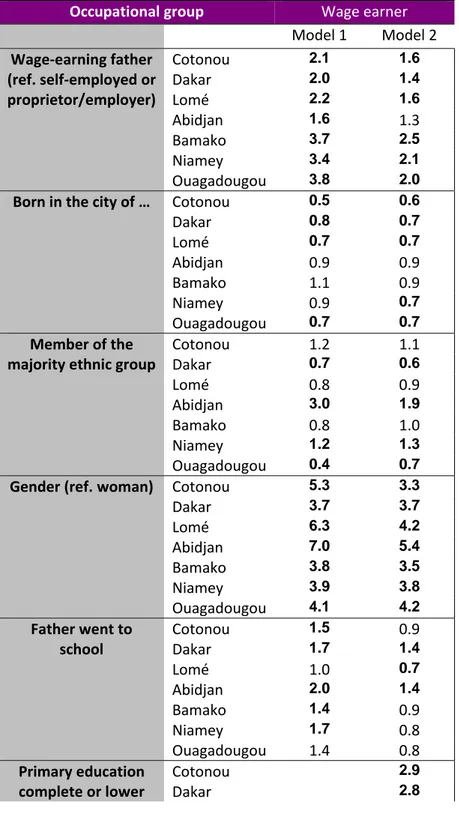
previous analysis finds that the cities’ main differences are in their social distances between wage earners and non-wage earners, we choose to initially define just two socioeconomic groups: wage earners (managers, non-manual workers, skilled manual workers and unskilled workers) and non-wage earners (proprietors, employers, self-employed, family workers and apprentices). For each city, therefore, we estimate two logit models explaining the probability of belonging to a wage-earning socioeconomic group. The second model includes the individuals’ level of education in its explanatory variables. The results of these estimations, presented in the form of odds ratios, are found in Table 3.
Table 3: Logit estimation of the effects of social origin on access to wage-earning socioeconomic groups Occupational group Wage earner Model 1 Model 2 Wage‐earning father (ref. self‐employed or proprietor/employer) Cotonou 2.1 1.6 Dakar 2.0 1.4 Lomé 2.2 1.6 Abidjan 1.6 1.3 Bamako 3.7 2.5 Niamey 3.4 2.1 Ouagadougou 3.8 2.0 Born in the city of … Cotonou 0.5 0.6 Dakar 0.8 0.7 Lomé 0.7 0.7 Abidjan 0.9 0.9 Bamako 1.1 0.9 Niamey 0.9 0.7 Ouagadougou 0.7 0.7 Member of the majority ethnic group Cotonou 1.2 1.1 Dakar 0.7 0.6 Lomé 0.8 0.9 Abidjan 3.0 1.9 Bamako 0.8 1.0 Niamey 1.2 1.3 Ouagadougou 0.4 0.7 Gender (ref. woman) Cotonou 5.3 3.3 Dakar 3.7 3.7 Lomé 6.3 4.2 Abidjan 7.0 5.4 Bamako 3.8 3.5 Niamey 3.9 3.8 Ouagadougou 4.1 4.2 Father went to school Cotonou 1.5 0.9 Dakar 1.7 1.4 Lomé 1.0 0.7 Abidjan 2.0 1.4 Bamako 1.4 0.9 Niamey 1.7 0.8 Ouagadougou 1.4 0.8 Primary education complete or lower Cotonou 2.9 Dakar 2.8