Transport Infrastructure and Local Economic Development: A Study of the Relationship Between Continental Accessibility and Employment Growth in Canadian Communities
107
0
0
Texte intégral
(2)
(3) Transport Infrastructure and Local Economic Development. A Study of the Relationship between Continental Accessibility and Employment Growth in Canadian Communities. Philippe APPARICIO, Gaëtan DUSSAULT, Mario POLÈSE et Richard SHEARMUR Spatial Analysis and Regional Economics Laboratory (SAREL). Institut national de la recherche scientifique Urbanisation, Culture et Société. September 2007.
(4) This study was made possible thanks to a research grant funded by Infrastructure Canada: Peer Review Research Studies (PRRS) Program. Parts of the study, notably data compilation and structuring, also draw on the support of two Canada Research Chairs, respectively, in Urban and Regional Studies and in Spatial Analysis and Public Policy. L’étude est également disponible en français : Infrastructures de transports et développement économique local. Étude de la relation entre accessibilité continentale et croissance locale de l’emploi, Canada, 1971-2001.. The cover photographs come from www.photo-libre.fr.. Distribution: Institut national de la recherche scientifique Urbanisation, Culture et Société 385 Sherbrooke St. East Montreal (QC) H2X 1E3 Phone number : 514 499-4000 Fax : 514 499-4065 www.ucs.inrs.ca. ISBN 978-2-89575-128-1 Legal Repository: - Bibliothèque et Archives nationales du Québec, 2007 - Library and Archives Canada © All rights reserved.
(5) Acknowledgements This study is the result of a team effort. In addition to the four authors on the title page, others have contributed significantly to the study. Students and interns attached to SAREL (Spatial Analysis and Regional Economics Laboratory) at INRS in Montreal played a major role during the various production phases of the study – especially data structuring, digitalization and mapping, and organization of spatial statistical analysis. Among the students and interns at SAREL, we cannot fail to mention Carine Discazeaux, Pauline Lizion and Mohamed Abdelmajid. The translation of the final text was ably carried out by Elena PouMadinaveita and the editing, by Viviane Brouillard, both at INRS-UCS in Montreal. At Infrastructure Canada in Ottawa we should like to thank Alex Duff and Jennifer Hincks for their unflinching collaboration and comprehension relating to administrative aspects. The opinions expressed in the study are, of course, the sole responsibility of the authors. This study can also be accessed (in English and in French) on the Internet at http://projetic.ucs.inrs.ca. The website houses an interactive atlas: Canadian Interactive Web-Atlas of Transport Infrastructures and Local Economic Development. The atlas presents the major quantitative findings of the study in a user-friendly series of maps and tables..
(6)
(7) “…as always in human experience since the invention of the telephone, the dissemination of electronic media may paradoxically even increase the need and the incentive for face-to-face contact…A key question, therefore, concerns the way people will travel to do business: …It is clear that cities with a high degree of accessibility – for instance, cities accessible within a one-day return trip from a large number of other cities – are at a special advantage” — (Sir) Peter Hall, Cities in Civilization, p. 962-963..
(8)
(9) CONTENTS. . List of Tables ................................................................................................................ix List of Figures...............................................................................................................ix List of Maps ................................................................................................................... x EXECUTIVE SUMMARY............................................................................ 1 Methodology: Innovative Features............................................................................1 Initial Findings: Transport Infrastructures and Continental Accessibility .........2 Principal Findings: The Positive Relationship with Growth.................................3 PART 1 CONCEPTUAL ISSUES. ACCESSIBILITY, CONTINENTAL INTEGRATION, THE KNOWLEDGE ECONOMY, AND LOCAL DEVELOPMENT .......................................................... 9 1.1 The Changing Face of Regional Development in Canada ......................11 1.2 The (Difficult to Measure) Impact of Transport Infrastructures..........14 1.3 The Knowledge Economy, Face-to-Face Linkages, and the Growing Interdependency of Transport Modes ........................................................16 1.4 The Competition Effects of IT and Lower Transport Costs ................20 1.5 Unravelling the Myriad Components of Regional Growth: What Is Local and What Is Not? ................................................................23 1.5.1 The “local” approach to regional growth.................................24 1.5.2 Geo-structural factors ..................................................................26 1.5.3 Other factors of regional growth...............................................28 PART 2 METHODOLOGY: THE AUGMENTED COFFEY-POLÈSESHEARMUR MODEL – DATA AND MEASUREMENT ISSUES...29 2.1 Data and Methodology..................................................................................31 2.2 The Model........................................................................................................32 2.3 Accessibility Measures...................................................................................33 2.3.1 Accessibility to what?....................................................................33 2.3.2 Accessibility along which transport networks? .......................34.
(10) viii. PART 3 RESULTS: THE IMPACT OF CONTINENTAL ACCESSIBILTY ON LOCAL EMPLOYMENT GROWTH – 1971-2001 ................... 39 3.1 Four Distinct Accessibilities (Modal Mixes)..............................................41 3.2 Continental Accessibility and Industry Location......................................46 3.3 The Incremental Impact of Continental Accessibility on Local Employment Growth.....................................................................................49 3.4 The Impact of Continental Accessibility on Local Employment Growth by Industry and by Modal Mix......................................................58 3.4.1 The Impact on Total and on Manufacturing Employment Growth ............................................................................................58 3.4.2 The Impact on Local Employment Growth in other Industries .........................................................................................61 3.4.3 Summary ..........................................................................................65 APPENDIX................................................................................................. 69 Appendix 1 – Detailed Results ................................................................................71 Appendix 2 – Methodology: Building the Digital Transport Networks..........75 REFERENCES ............................................................................................ 85.
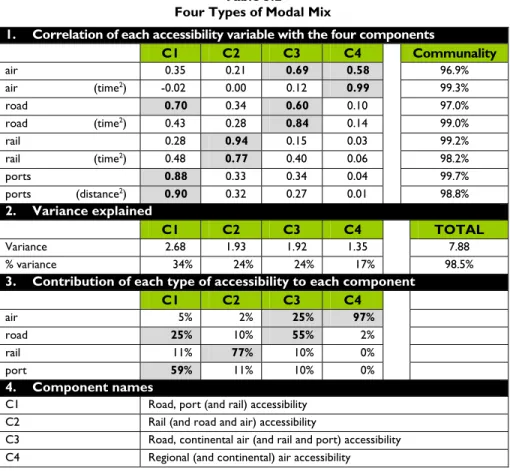
(11) ix. List of Tables Table 3.1 Table 3.2 Table 3.3. Table 3.4. Correlations between the Eight Accessibility Measures....................41 Four Types of Modal Mix .........................................................................42 Strength (standardised regression coefficient) and Direction of the Relationship between Industry Location Quotients (2001) and Continental Accessibility by Modal Mix.........................................47 Relationship (r2 increase) between Continental Accessibility and Employment Growth: Combined Impact of Four Modal Mixes.......61. List of Figures Figure 1. Figure 2 Figure 3.1. Figure 3.2. Figure 3.3. Figure 3.4. Figure 3.5. Figure 3.6. Figure 3.7. Relationship between Continental Market Access – via Four Modal Mixes – and Local Employment Growth in Manufacturing ...............................................................................................5 Relationship between Continental Market Access – via Four Modal Mixes – and Total Local Employment Growth .........................6 Relationship between Continental Accessibility (Four Modal Mixes) and Total Local Employment Growth. Unfiltered Impact (a) and Incremental Impact (b) .................................................................51 Relationship between Continental Accessibility and Total Local Employment Growth by Modal Mix. Unfiltered Impact (a) and Incremental Impact (b) ...............................................................................52 Relationship between Continental Accessibility (Four Modal Mixes) and Growth in Manufacturing Employment. Unfiltered Impact (a) and Incremental Impact (b) ....................................................53 Relationship between Continental Accessibility and Growth in Manufacturing Employment by Modal Mix. Unfiltered Impact (a) and Incremental Impact (b)........................................................................54 Relationship between Continental Accessibility (Four Modal Mixes) and Employment Growth in Producer Services. Unfiltered Impact (a) and Incremental Impact (b) ..................................55 Relationship between Continental Accessibility and Employment Growth in Producer Services by Modal Mix. Unfiltered Impact (a) and Incremental Impact (b)..........................................................................56 Relationship (r2 increase) between Continental Accessibility and Employment Growth by Industry. Combined Impact of Four Modal Mixes ......................................................................................62.
(12) x. List of Maps Map 3.1 Map 3.2 Map 3.3 Map 3.4. Road, Port (and Rail) Accessibility..........................................................43 Rail (and Road and Air) Accessibility .....................................................44 Road, Continental Air (and Rail and Port) Accessibility ....................44 Regional (and Continental) Air Accessibility........................................45.
(13) EXECUTIVE SUMMARY. . The purpose of this summary is to present the principal findings of the study in a straightforward manner. Technical aspects and conceptual issues – beyond those briefly covered in points 2 through 6 – are dealt with in the core of the study. 1.. The study seeks to measure the impact of transport infrastructures on local employment growth in Canada (1971-2000). Canada is divided into 145 urban and 214 rural places. Only those areas south of the 55th parallel are considered in the growth models because growth dynamics are very different in extreme northern communities and small employment numbers can lead to extreme growth and/or decline rates. The three decades (1971-1981, 19811991, and 1991-2001) are examined separately.. 2.. Explaining local economic development raises numerous conceptual and empirical issues. An impressive literature has accumulated over the years in Canada and elsewhere. Some writings stress “local” – sociological, institutional – factors, while others emphasize geographic and structural factors – city size, location, industry mix, etc. A rich research tradition has also developed dealing with the economic impacts of infrastructure investments. Measuring the impact of transport infrastructure on local employment growth remains a challenge, in part because the impacts are diffused over space and over time.. 3.. The rise of the knowledge economy has accelerated the interdependency between transport modes, as business travel – in part dependant on air transport – increasingly complements merchandise trade, relying in turn on rail, road, and water transport. At the same time, the progressive integration of the North American economy, notably since NAFTA, has meant that exports to continental – as opposed to local or national – markets account for a growing share of local GDP in Canadian communities. Trade as a share of local GDP is on the rise everywhere. In this evolving context, market access – via various transport modes – should, it is reasonable to expect, be an increasingly important factor driving the growth of local economies.. Methodology: Innovative Features 4.. The study examines the impact of transport infrastructures on local employment growth via the access they provide to continental markets. This is an innovative feature, made possible by the application of GIS (Geographical.
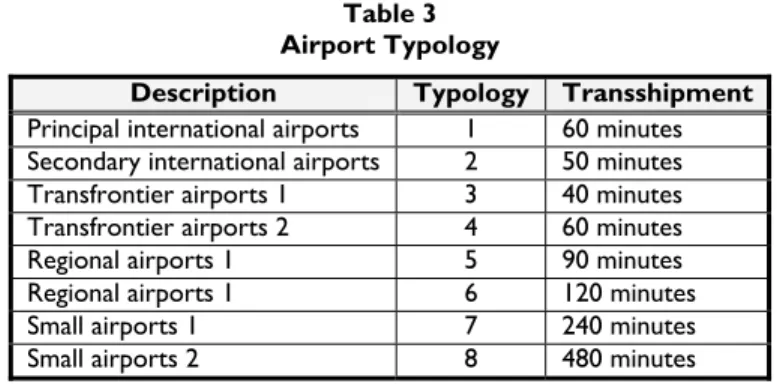
(14) 2. Information Systems) techniques combined with econometric modelling. Transport networks by mode – air, road, rail, and harbours – were mapped and digitalized for all of North America (Canada and the US). Continental accessibility indicators – by transport mode – were, in turn, calculated for all Canadian communities. Our study is based upon access to people, which is almost perfectly correlated with access to jobs and access to income. 5.. A second innovative feature of the study is the integration of the continental accessibility variables – associated with the four transport modes – into a broader econometric model of regional growth, which integrates other variables (city size, location, industrial structure, labour force characteristics…) that can contribute to local employment growth. This allows the study to identify the incremental impact of transport infrastructures, independently of other factors that might influence local economic development. By the same token, this allows the study to flush out impacts – of transport infrastructures – that might otherwise have remained hidden, swamped by other variables.. 6.. A third feature is the use of multivariate statistical techniques, which ensure not only the statistical significance of the results, but also allows the study to isolate statistically independent transport variables. A factor analysis was applied to the four continental accessibility variables, resulting in the identification of four statistically independent factors, henceforth called modal mixes: (1) Harbours and Roads; (2) Rail; (3) Roads and Air; (4) Air. It is these four modal mixes – specifically, the continental accessibility they provide Canadian communities – that are at the heart of the analysis. It is the impact of these four modal mixes – via the accessibility they provide – on local employment growth in Canada that the study examines.. Initial Findings: Transport Infrastructures and Continental Accessibility 7.. Transport modes – in terms of the accessibility they provide to North American markets – do not act in isolation. The results of the factor analysis – referred to in point 6 – confirm that transport modes are, as a rule, present (in any given location) in combination with other transport modes. This comes as no surprise. A harbour or an airport with no road leading to it is of little use. Accessibility is necessarily the result of a bundle of transport infrastructures; all must work together to generate accessibility (recall also point 3).. 8.. Each modal mix – bundle of transport infrastructures – produces a unique range of accessibilities. Thus, modal mix 1, in which harbours are dominant (followed by roads, and to a lesser extent by rail and air), reflects a different geography of continental market access from that of modal mix 3, in which roads and air are the dominant modes. Again, this comes as no surprise..
(15) 3. Roads do not affect accessibility in the same manner as rail lines, for instance. The fact that each modal mix has a dominant mode means that different infrastructures interact differently and have distinct impacts. A locality with a major port necessarily offers a different range of (continental) market destinations from that of an inland locality with no waterway. 9.. Each of these modal mixes is statistically independent from the others: they are not correlated across the 359 geographic units we study. This does not mean that in certain regions the modal mixes do not combine. For instance, even though there is no correlation between modal mixes 3 (road and air) and 4 (air) across Canada, they combine in some of Canada's largest cities. However, one also finds high air access in some of Canada's remotest Northern communities – but these have very low access by road. Indeed, the principal exception (but not a major one) to the interdependency of transport modes is air, which sometimes acts in almost total isolation from other transport modes.. 10. Looking at the location of employment (in 2001), the study finds that different transports modes are associated with different industries. Modal mix 3 (Roads and Air), strongest in larger cities, shows a significant positive statistical relationship with employment in financial services and producer services, a reflection of the role of air travel (but also urban size) in modern business transactions. Manufacturing employment, on the other hand, is associated, although not strongly, with harbours, roads, and rail. Wholesaling is positively associated with all modal mixes, a reflection of the importance of transport infrastructure for distribution and marketing. Public sector employment, on the contrary, exhibits a negative relationship with all transport modes, indicating that public sector employment (including health and education) is proportionally more concentrated in the least accessible places. 11. The previous point dealt with the relationship between transport infrastructure and the location of employment at a single moment in time (2001). The focus of the study, however, is on the relationship with employment growth. That is the subject of the remaining points of this executive summary.. Principal Findings: The Positive Relationship with Growth 12. The study finds a significant positive relationship between transport infrastructures – via the access they provide to continental markets – and local employment growth. For total employment growth, the introduction of the four transport variables raises the predictive power of the model for all three decades between 1971 and 2001. The positive incremental effect (increase in r2, in statistical terms) of the combined impact of the four modal mixes ranges from 4.6% to 8.0%, depending on the decade. It is useful to.
(16) 4. recall (point 5) that this result reflects the independent – incremental – effect of transport infrastructures on employment growth, once other factors contained in the model have been accounted for. In this respect, the results of the study constitute a conservative estimate of the positive relationship between transport infrastructures and local employment growth. In particular, the increased accessibility associated with being located close to a large city or closer to the US border is already integrated in the model. 13. Producer services (employment in consultancies, computer services, advertising agencies, etc.) provide a useful illustration of how the study works to isolate the independent effects of transport infrastructure on growth. A simple regression between accessibility (all transport modes) and employment growth in producer services reveals a statistically significant relationship for the two most recent decades. However, once the four transport variables are introduced into the broader econometric model, the relationship disappears. Accessibility, in other words, is associated with other attributes – notably city size and proximity to large cities – which, once included, wipe out (statistically speaking) any positive relationship with employment growth. This does not mean that transport infrastructures have no effect on local employment in producer services, only that growth effects are intermediated by other attributes. Stated differently, the possible growth effects of transport infrastructures on producer service employment are not independent of other factors. While an airport, for instance, might produce a positive effect in a large city, its presence, by itself, will have little effect in other locations. This is indicative of processes of agglomeration: airports will tend to locate in larger cities in response to demand, and roads converge on these larger cities. This leads to better market access for producer services and faster growth, which then consolidates the larger city's size and may lead to more investment in infrastructure and a new round of growth. However, an airport located far from a large city will not, by itself, generate economic activity. 14. The positive relationship between growth and continental accessibility varies between industries. The relationship with employment growth in the primary sector is weak, for instance, as one might expect. Resources are not necessarily found in the most accessible places. The strongest positive relationship, leaving the public sector aside, is with growth in manufacturing employment, a reflection of the weight of merchandise exports in interregional and in crossborder trade. One would expect the relationship to be strongest for industries – outside the primary sector – whose products are widely traded. 15. The combined positive impact of the four modal mixes on growth in manufacturing employment rises systematically over time, with r2 increases (attributable to accessibility) of – 0.5%, 4.8%, and 9.1% for the three decades between 1971 and 2001. In sum, growth in manufacturing employment in.
(17) 5. Canada is increasingly linked to considerations of transport access to continental markets. Location – at least as it affects the transport of goods to markets – is increasing in importance. This is one of the ironies of continental economic integration: as barriers to trade are lifted and as transport costs fall, location has taking on a new meaning. This is not really surprising when one considers the growing importance of external markets for local communities (recall point 3). Most provinces have seen the share of their GDP going to the rest of Canada decline, compared to the share exported to the US. Figure 1 Relationship between Continental Market Access – via Four Modal Mixes – and Local Employment Growth in Manufacturing 60% 1971-1981 1981-1991. 50%. Relationship (coeffient). 1991-2001 40%. 30%. 20%. 10%. 0%. -10% 1. Harbours (& Roads). 2. Rail. 3. Roads (& Air). 4. Airports (alone). Modal Mix. Note: This table shows the standardised regression coefficients of each of the four modal mixes when they are added to the CPS growth model.. 16. For manufacturing employment, the strongest – and growing – relationship is with modal mix 1, which captures the effects of harbours and road networks (figure 1). For the most recent period, the strength of the relationship is impressive. Places well served by harbours and well connected to the North American road and highway systems are clearly at an advantage for generating manufacturing jobs. The role of harbours (well connected to road systems) is growing, it would seem, which is consistent not only with the over-all globalization of the Canadian economy but also with the findings of US studies that observe a long-term shift in employment to coastal regions and places well served by waterways..
(18) 6. 17. Modal mix 3, which mainly captures the impacts of combined road and air links, also exerts a strong positive influence on manufacturing employment growth, notably since 1981. The importance of road networks – which are also a significant component of modal mix 1 – suggests that much manufacturing trade takes place between regions that are fairly close to each other. Trucking is the optimal transport mode for shorter hauls. This suggests that the most rapid expansion in merchandise trade – with concomitant growth effects – has often occurred between neighbouring provinces and states (say, between B.C. and Washington or between Québec and Vermont) as tariff barriers are eliminated, which is consistent with what economic theory would predict. By the same token, the relationship with modal mix 2, which mainly captures the effects of rail, is weak although positive; this suggests that overland long haul trade – often in bulk goods – is not a major driver of manufacturing employment growth, at least not in the majority of Canadian communities. Figure 2 Relationship between Continental Market Access – via Four Modal Mixes – and Total Local Employment Growth 60%. 1971-1981 1981-1991. 50%. Relationship (Coefficient). 1991-2001 40%. 30%. 20%. 10%. 0%. -10% 1. Harbours (& Roads). 2. Rail. 3. Roads (& Air). 4. Airports (alone). Modal Mix. Note: This table shows the standardised regression coefficients of each of the four modal mixes when they are added to the CPS growth model.. 18. For total employment (all industries), modal mix 3 – which chiefly captures the effects of roads and air – exerts the strongest positive influence on growth (figure 2). The positive relationship is very strong, and has grown since 1971. This modal mix, let us recall, is generally associated with large cities; the relationship with growth thus comes as no surprise. However, the positive relationship with modal mix 3 suggests that good road and air links give such.
(19) 7. locations an additional – incremental – boost, above and beyond the usual advantages of city size and proximity. Or, stated otherwise, the probable incremental growth impact of transport infrastructures is likely to be greatest in such locations. 19. The positive relationship since 1971 with total employment has grown most rapidly for modal mix 1 (harbours and roads), reinforcing the findings for manufacturing employment (point 16). Proximity to a well-connected harbour is increasingly an asset. The strength of the positive relationship with rail access has also grown over time, but remains weaker than for modal mixes 1 and 3, which are the dominant modal mixes driving local employment growth (figure 2). 20. Three conclusions flow from the findings of the study: . First: The gap between communities that are “well-connected” and those that are not is likely to widen in the future. This is good news for communities – small cities as well as large – in Southern Ontario, in south-western Quebec, and in parts of the Maritimes and in the B.C. Lower Mainland; but bad news for communities in Canada’s peripheral regions, less well-connected to continental markets.. . Second: Growth, most noticeably in manufacturing employment and in related industries, will tend to coalesce along trade and transport corridors. The prime example in Canada has always been, and remains, the WindsorQuébec City corridor. Other examples are the Edmonton-Calgary-Lethbridge corridor in Alberta and the Halifax-Moncton-Fredericton corridor, around which growth in the Maritimes is increasingly coalescing.. . Third: Investments in transport infrastructures that significantly improve the combined road, water, rail, and air accessibility of communities to continental markets should stimulate local employment growth, notably in manufacturing. However, the optimism implicit in the preceding sentence needs to be tempered by the word significantly; accessibility to continental markets is not only determined by local – or proximate – infrastructures, but by the entire continental network.. Finally, the findings of the study suggest that investments in infrastructures that improve the continental accessibility of Canadian communities have an overall positive effect on the Canadian economy, but whose scope is difficult to measure..
(20)
(21) PART 1 CONCEPTUAL ISSUES. ACCESSIBILITY, CONTINENTAL INTEGRATION, THE KNOWLEDGE ECONOMY, AND LOCAL DEVELOPMENT. .
(22)
(23) 11. The purpose of this study is to further our understanding of the forces driving the growth (or decline) of communities across Canada. Specifically, this study focuses on the impact of transportation infrastructures – via the access they provide to other destinations – on local and regional development in Canada,1 as measured by indicators such as employment, population and income. In this study, the focus is on employment.. 1.1. The Changing Face of Regional Development in Canada. Regional development has been a recurring theme in Canadian history. Development has never been evenly distributed – insofar as such a notion even makes sense – across Canada, if only because of its immense size and peculiar geography. From the beginning, economic development was highly concentrated in few pockets of settlement, only very loosely tied together by prevailing transport links – road, rail, or water – over vast distances. Regional disparities are part of the Canadian landscape. Since regional income and employment data began to be regularly collected – in 1926 (by the then Dominion Bureau of Statistics, now Statistics Canada) – the three Maritime Provinces, for example, have systematically lagged behind the rest of the nation on various indicators of economic welfare and performance, as has Newfoundland and Labrador since it joined Confederation in 1949. The two “eastern” Prairie Provinces of Manitoba and Saskatchewan have also systematically fared less well than the rest of the nation since the Great Depression of the 1930’s. Income disparities between provinces have lessened considerably in recent decades, in part a result of the various interregional transfer mechanisms built into the Canadian fiscal system: equalization payments; other intergovernmental transfers, progressive taxation, direct federal wage and infrastructure expenditures, etc. However, the issue has taken on a new dimension in recent years as a result of changes in demography, technology, global economic conditions, and resource availability – of which more will be said later on. Barring the very special case of Alberta – which is putting considerable strain on the Canadian fiscal system – the starkest social and economic differences between communities are now often found within provinces; that is, between the large urban and surrounding parts of a province and the more peripheral and rural parts. The difference between rapidly growing southern Ontario – centered on greater Toronto – and “declining” 1. All throughout this study, the adjectives “regional” and “local” are used interchangeably. The terms “growth” and “development” are also often used as synonyms. Thus, references to regional (or local) economic development and to regional growth all denote the same general process in which a region, locality or community moves from a lower to a higher level – depending on the variable considered (employment, income, population…)..
(24) 12. northern Ontario is striking. Every census agglomeration in Northern Ontario has seen its population decline since the 1996 census, a matter of growing concern both to the Federal and Provincial governments.2 A no less striking dichotomy is observable within Newfoundland between the Avalon Peninsula –centered on St. John’s – and the rest of the Island, where almost every community has seen its population decline in recent years. Indeed, the majority of Canada’s peripheral urban areas with populations below 250,000 declined between the 1996 and 2001 censuses (Bourne and Simmons 2004). In Quebec, the gap between the comparatively prosperous southwest – basically the area southwest of the city of Rimouski – and Les Régions ressources has been widening, compounded most recently by the acute crisis in the forestry and logging industries.3 Canada has a rich research tradition on the challenges facing resource-dependent and peripherally located regions (Innes 1933, Barnes and Hayter 1994, Lucas 1971, Randall and Ironside 1996, Slack et al. 2003). To describe the Canadian economic landscape, economists, geographers, and regional scientists have evoked dichotomies such as “heartland-hinterland,” “core-periphery,” and “centre-periphery” (Anderson 1988, Kerr 1968, McCann 1982, 1998, McCann and Simmons 2000). Large parts of Canada are sparsely settled and far from major markets. The widening gap between the urban, cosmopolitan, and growing parts of the nation and the rest of Canada is now well documented (Bourne 2000, 2002, Bourne and Rose 2001, Bourne and Simmons 2003, 2004). Bourne and Simmons (2003) speak of “new fault lines”. Peripheral communities in Canada witnessed periods of population decline before, but most continued to grow until the late 1980s. Absolute population decline was the exception. This period is coming to an end, as the regional implications of the demographic transition – from high to low birth rates – are starting to sink in. It is important to note that Canada is not unique in this respect. Analogous trends have emerged in other large industrialized nations that have completed their demographic transition – meaning natural growth rates close to zero4 – and are characterized by historical core-periphery relationships. Slack et al (2003) mention Australia, Russia, and Scandinavia. The last Australian census documents the decline of numerous small peripheral communities (Ausstats 2000), an increasing cause of concern in that nation (Collits 2000, Forth 2000). Hanell et al. (2002) observe that some 90% of Finland’s inhabited land area underwent population decline during the 1990s. Almost all municipalities in 2. See, for example, Slack et al. (2003).. 3. For a more detailed analysis of the challenges facing Quebec and Atlantic peripheral communities see Polèse and Shearmur (2002, 2006).. 4. As in most other Western societies, birth rates have declined sharply in Canada, with a major drop in the early 1960’s. The effects of that drop on population growth became visible during the 1990s, as women born during the baby boom years passed childbearing age. The number of deaths will soon equal (and then surpass) births..
(25) 13. central and northern Sweden witnessed decline. Even in Japan, despite its different geography and higher population densities, the projected population decline of its southern and northern peripheries (Kyushu and Hokkaido) has become a cause for concern (Portnov and Permutter 1999). In a nutshell, stabilizing national populations mean a zero-sum demographic game for communities. In a zero-sum demographic environment, population decline is the inevitable result of net out-migration. In this emerging context, regional employment growth and job opportunities take on a new importance. Population movements largely follow the spatial distribution of economic opportunities – in this, Canadians are no different from others. As Bryant and Joseph (2001) note, over time it is people who respond to economic activity; this is a common assumption in economic geography (Courchene 1970). The key factor becomes the spatial distribution and growth of employment, which is the principal focus of this study. However, demography is not the only thing that has changed. The 1990’s saw the rise of new information technologies, impacting productivity, the demand for new services, and the role of location in economic decisions. The IT revolution – the Internet and all that – is supposed to have heralded the death of distance (Cairncross 2001). However, one of the paradoxes of the IT revolution is that it may in fact have increased the importance of location and accelerated the concentration of economic activity (and population) in and around large metropolitan areas; about more will be said later. The rise, in general, of the knowledge economy, has tended to favour urban concentration, in large part because of the importance of personal contact – necessary correlate of creativity and imagination – for most knowledge-rich activities (about which more will also be said later). Continental economic integration accelerated during this period as the FTA and then NAFTA came into full force. Although this study will look at trends over a thirty year period (1971– 2001), the focus is on the most recent – post 1990 – period. During 1990’s and since, provincial trade (as a share of total trade) has steadily declined compared to trade with American states (Statistics Canada 1998, 2000, 2004). Correspondingly, we would expect access to U.S. markets to be an increasingly powerful determinant of the growth of Canadian communities. Explaining why employment – globally, or in particular industries – locates and grows in particular places and not in others is, arguably, the most important research question in economic geography, and also the most difficult to answer. Describing the location patterns of particular industries – at given moments in time – is not all that difficult.5 It is, for example, fairly well established that highorder services – professional, technical, and scientific services – tend to concentrate in the largest cities. This is as true in Canada as elsewhere. However, explaining why an industry will locate in a particular city – say, in Montreal 5. See, for example, our own writings on the subject for Canada (Polèse and Shearmur 2004; 2006a)..
(26) 14. rather than Toronto – is far more difficult. We can, for example, predict with some assurance that a large state-of-the-art software firm, specializing in computer graphics, will most likely locate its main operation in one of Canada’s large metropolitan areas; but, predicting in which one exactly is another matter. Explaining regional growth (or decline) is even more difficult, primarily because no unique explanation – valid for all communities and all time periods – exists or can exist. Different places can grow (or decline) for different reasons. The current growth of greater Calgary is built on very different foundations from that of the growth of greater Toronto. By the same token, the decline of many small towns in Saskatchewan is not occurring for the same reasons as the decline of Newfoundland outposts. Common explanatory factors do exist – otherwise all attempts at statistical modelling would be fruitless – but attempts to explain regional growth will never attain a 100% success rate (an r2 of 1.00, in econometric parlance). Some things will always be left out of the equation.. 1.2. The (Difficult to Measure) Impact of Transport Infrastructures. In this study, we focus on a specific variable in the regional growth equation: transportation infrastructure. An abundant literature exists documenting the positive impact of investments in infrastructures – in transportation infrastructures in particular – on economic growth (Aschauer 1993, Bidder and Smith 1996, Crichfield and McGuire 1997, Freire and Polèse 2003, Kessides 1992, Lobo and Rantisi 1999, Prud’homme 1997, TD 2004). We shall address the impact of transportation infrastructure from a different perspective, more closely related to the research tradition of economic geography and regional economics. We suggest that it is not the infrastructure per se, but rather the accessibility that it provides to other locations across the whole network that affects the location and the growth of economic activity. In this study, we shall consider accessibility with respect to all of North America. Building on a previously developed econometric model of regional growth for Canada – which is described in greater detail further on – we introduce a new set of variables into the equation that consider a community’s accessibility to markets and other destinations. Accessibility is not an easy concept to operationalize, if only because accessibility can take different forms: accessibility in terms of time, cost, reliability of service, etc. We focus on four transport modes: the road and highway network, the railway network, the airline network and ports. A community may have various accessibilities, so to speak. Thus, a community may be highly “accessible” by road – with a high market potential for goods transported by truck – but with low accessibility for goods transported by water. One would expect such a community.
(27) 15. to have a different industrial structure – and thus also growth rate – from communities with important maritime and/or fluvial infrastructures. The manner in which the accessibility variables are estimated and specified is explained below. The basic postulate, in short, underlying this study is that accessibility – by road, rail, water or air – is a significant determinant of employment growth (or decline) for the periods studied, in turn impacting population and income. A transport infrastructure as such – its mere presence – may not trigger growth: an airport or highway will not, by itself, generate growth. The important variable, we suggest, is the increased access they provide to potential customers, suppliers, and – as we shall explain in greater detail shortly – to information, relationships, and ideas that are dependant on face-to-face contacts. In this respect, different transport modes – and the different accessibilities they provide – are often complements rather than substitutes. Selling a good – shipping it by truck or rail – may necessitate several parallel meetings between suppliers and customers, in turn dependant on air travel. By the same token, some “accessibilities” will matter more over shorter distances, while others will matter more over longer distances. Road and air infrastructures do not – for obvious reasons – address the same markets. As the reader will have guessed by now, accessibility is a multidimensional concept, which cannot be reduced to a single measure. The important point to bear in mind all throughout this study is that we shall be examining the impact of transport modes on local economic development compared to other determinants of regional growth. Or, stated differently, do transport modes – via the accessibility they provide – have an independent impact on growth, above and beyond other factors? Accessibility is not necessarily the primary determinant of growth. The currently dominant theories in economic geography stress the role of agglomeration, industrial diversity, and proximity to large urban centres (Fujita and Thisse 2002, Henderson 2003, Krugman 1995, Phelps and Ozawa 2003, Quigley, 1998). Others have stressed the importance of industrial specialisation – clusters – as determinants of growth (Porter 1996, 2000). Others again point to the importance of “local” – institutional and social – determinants of local economic development (see section 1.5). The econometric model used in this study – which is presented in part 2 – incorporates various variables that can influence growth: urban size, initial industrial structure, education, etc. The question then becomes, how important is accessibility relative to other factors, which accessibility, and for which industries? The relative importance of different accessibilities may also be changing over time for different industries. We may, for example, reasonably assume that air travel accessibility will be of greater importance for explaining the location and growth of high-order services – say financial services – than for explaining the location and growth of manufacturing. Financial services – to stay with that example – are also a priori more sensitive than most other sectors to the.
(28) 16. introduction of IT; for most standardized financial transactions, electronic communication is today a practical substitute for face-to-face contacts. For service industries for which the final product (service) can now be delivered at almost zero cost, we would expect the relative weight of different “accessibilities” to have changed over time. If output can be transported without cost, then the primary consideration becomes the cost of transporting inputs. The rise of the knowledge economy and especially the rise of tradable services – services that can be consumed over large distances – require that we take a closer look at how different transport modes relate to each other.. 1.3. The Knowledge Economy, Face-to-Face Linkages, and the Growing Interdependency of Transport Modes6. As in other industrialized nations, the most rapid growth in the Canadian economy over the last few decades has been in services, specifically in scientific and technical services, professional services, and entertainment and leisure related services. What do these sectors have in common? They rely heavily on face-toface contacts and direct human interaction. Why the need for face-to-face meetings? Simply put, because these are often “creative” activities (to use a currently fashionable term) with high knowledge content, where spontaneity, imagination, and informal meetings play a major role in determining productivity. At another level, the need to establish and reinforce trust, especially for the most information sensitive activities (R&D, investment…), also fuels the demand for face-to-face contacts. The obvious question is: why has IT not reduced the demand for face-to-face meetings? Should not e-mail, cell phones, and other media of electronic communication reduce the need to meet? The impact of IT is often quite the opposite. IT can in fact increase the need for face-to-face meetings. Gasper and Glaeser (1998) argue that electronic communication and face-to-face contacts are complements, not substitutes. People who regularly communicate via e-mail will, eventually, have to meet. In other words, IT has fuelled a new demand for face-toface meetings, and thus – this is the paradox – in fact increased the importance of location and the forces of urban concentration, as various authors have pointed out (Ghemawat 2001, Glaeser 1998, Zook 2001, 2004). The same thing happened, Gasper and Glaeser (1998) recall, a century ago with the introduction of the telephone. The evidence appears to bear them out. Never has the demand for business air travel (9/11 notwithstanding) risen so fast as in the last few decades. This also sheds light on an apparent contradiction. While communication – both electronically and via travel – increasingly occurs over greater distances, suggesting a weakening of distance, the locations via which such contacts occur 6. This section draws in part on a paper prepared for Infrastructure Canada (Polèse 2005)..
(29) 17. are increasingly polarized, suggesting a strengthening of distance. IT links have become largely ubiquitous (at least outside the poorest nations and regions) generating electronic exchanges that are not sensitive to distance, but which in turn must be complemented by face-to-face contacts, which are sensitive to distance and thus to relative accessibility. The most rapidly growing services are generally producer services; that is, intermediary inputs into the production process, most notably, professional, scientific and technical services. In the knowledge economy, the production of goods – manufacturing – is increasingly linked to a set of services that rely on face-to-face contacts. This change in the production process will continue as long as the knowledge content of manufactured goods continues to grow. The growth in the marketing of goods and of direct investments – in plants, distribution facilities, etc. – over large distances has a similar impact. Managing a plant at a distance is facilitated by IT, but must be backed up by meetings between management, technical and marketing people at both ends. In short, electronic communication, trade in goods, direct investment linkages, and face-to-face meetings are often interdependent. Growth in one – say in goods shipped by rail – will in turn fuel growth in the demand for other modes of communication and transport. In an economy where the knowledge and the creative content of products – goods and services – is on the rise, we should normally expect demand for face-to-face contacts to grow. This favours, one would predict, those places which are well positioned in terms of multiple accessibilities – air, rail, water, and road. This a priori favours the largest cities. However, the role of cities as centres of exchange, communication, and trade is double. Not only are they “natural” hubs where various modes come together, but they are also the points with the highest potential for direct interaction with the greatest number of people. Cities exist, in large part, to facilitate face-to-face contacts. As the American economist and Nobel prize winner R. Lucas (1988: 39) famously wrote: “What can people be paying Manhattan or downtown Chicago rents for, if it is not for being near other people?”. Why indeed would a firm choose to pay the high rents and wages of a location in Toronto, Montreal or Vancouver if it could avoid it? Arguably, the primary advantage of large cities in the knowledge economy is the diversity of potential contacts they offer. The non-standardized nature of modern producer services, with constantly changing demand and input requirements, is a powerful force driving them towards large cities. Where else but in New York (perhaps Toronto or Montreal) is one likely to find a Portuguese-speaking accountant, versant in international trade regulations, qualified to practice in Brazil? For a consultancy wishing to bid on a World Bank contract, rapid access to such a person can be crucial. An advertising agency may need an opera singer one day, a symphony orchestra the next, and a whiz in computer graphics the.
(30) 18. following day. A research laboratory may need to bring in a variety of scientists on short notice. The entertainment industry relies on a broad range of face-to-face linkages: actors, screenwriters, musicians, technicians, producers, etc. coming together in ever changing combinations. The preceding paragraph refers to the range of face-to-face contacts between people in the same city. It is easy to see that larger cities hold a clear advantage.7 This advantage is compounded by the superior accessibility that large cities also provide for distant face-to-face contacts. The polarisation of air travel-dependant face-to-face meeting is largely driven by the economics of air transportation, sensitive to scale economies. Only large markets with high volume can provide frequent cost-efficient service. Flights between Montreal and New York are far more frequent (and generally less costly) than between Montreal and, say, Rimouski. At the other end, the businessperson in Rimouski has no access to a direct – face-to-face – air-link with New York. He or she must spend more time and more money (probably flying via Montreal) to develop an active relationship with associates in New York. Little wonder, given the choice, that a Québécois establishment with close ties to New York will prefer Montreal. For the entrepreneur in Rimouski, if the need for face-to-face meetings with New York associates grows beyond a certain point, the pressure to move to Montreal may become irresistible. However, the double role of large cities as both points of dense and diverse local interaction and as points of multiple accessibilities (to other points) creates an analytical problem, which is not easy to resolve: the circular relationship between agglomeration economies and accessibility, notably for transport modes sensitive to scale economies and the (mainly) service industries that rely on them. The concentration of financial services – to take that example again – in large cities is undoubtedly driven both by the local density of potential contacts and by the wider accessibility which the infrastructures in large urban places provide. It might even be argued that accessibility, certainly multi-mode accessibility, is simply a subset of the broader concept of agglomeration economies. The challenge is separating out the “pure” effects of accessibility on growth. The interdependency between different accessibilities – driven by the growing interrelationship between the production of goods and the need for services – also operates at a second level. The concentration of producer services in large cities affects the location of other industries, precisely because the consumption of theses services depends on face-to-face contacts. Our findings for Canada (Polèse and Shearmur 2004, 2006a) as well as evidence for France (Gaigné et al. 2005) 7. On this, a quote from a recent survey of New York in The Economist (2005: 6, 10), which needs no further comment: “Discourse and intercourse – in the broad sense of that word – are the essence and the comparative advantage of New York” and (four pages later): “…a design or a report can be emailed from anywhere; but a handshake, a lunch and look in the eye remain popular as foreplay”..
(31) 19. and the U. S. (Desmet, K. and M. Fafchamps 2005) suggest very similar patterns for most manufacturing, specifically medium value-added manufacturing: electronics, machines, furniture, motor vehicles and parts, etc. Such industries tend – in relative terms – to concentrate in small and medium-sized cities. The process at the root of this location behaviour is commonly called “crowdingout”; that is, the expulsion from metropolitan areas of medium-tech, spaceextensive activities, due to high land, labour, and other congestion costs in large metropolitan areas brought on, precisely, by the growing concentration of highorder services and knowledge-intensive activities in large cities (Carlino and Chatterjee 2002, Graham and Spencer 1997, Ingram 1998). For manufacturing, Henderson (1997) nicely explains the process in terms of economic theory, explaining why all manufacturing does not concentrate in the biggest cities. Simply put, since such industries are important consumers of space and do not generally require a highly skilled labour force, they will seek out locations with lower land costs and lower wages. The decision to locate or not in the biggest cities will in part be determined by the trade-off between the gains from agglomeration economies (of locating in a large city) and the cost-savings of locating in a smaller city. If smaller urban areas are distinct labour sheds with lower wages and lower land costs, then those industries most sensitive to wage and land costs will locate there. For French manufacturing, Gaigné et al. (2005) note the relationship between wages and land (housing) costs, the latter being in part driven by the former. If distance (from a metro area) drives down land prices, labour costs in turn will follow. This feedback between land (housing) costs and wages, in sum, serves to push space-extensive, low-wage industries ever further from metro areas, and ultimately into the periphery, Henderson et al. (2001) observe this “dispersal” process for manufacturing for various nations. The evidence for Canada and other industrialized nations also shows us that most such industries, given the choice, prefer to locate close to (but not in) a metropolitan area, generally within a radius of an hour’s drive or so. The reason, in large part, is the need for frequent face-to-face meetings. Plants need to be in frequent contact with providers of producer services, generating a constant flow of travel back and forth between the plant and the nearby metropolis for technical, financial, marketing or other services. By locating within an hour’s drive (more or less), face-to-face contacts can still be maintained with the neighbouring metropolis, but without incurring the costs of an intra-metropolitan location; the plant is, so to speak, “borrowing” the agglomeration advantages of the large city, but without actually locating in it. Compared to the entrepreneur in Rimouski, this provides a considerable advantage. Not only does the plant manager close to, say, Montreal have the option of driving there when he or she pleases – at fairly low cost and time lost – but he or she also, indirectly, has the use of the infrastructures that define Montreal’s multiple accessibility – port; rail, airport. The economies of scale – hub and spoke configuration – of the airline industry do not penalize him (or her)..
(32) 20. Thus, we would expect most manufacturing activities – unless directly tied to resources (i.e. pulp and paper plants) – to be influenced by two distinct accessibility criteria: accessibility to markets, often continental in scope; accessibility to a large metropolis. The introduction of the second accessibility criteria suggests that there are limits to the dispersal process of manufacturing to more outlying locations. It also follows that communities of similar size – but below a certain threshold – can have very different accessibilities and thus, in principle, different growth potentials. Communities close to a metropolis will have a different matrix of accessibilities – for different modes – than those far away. St-Hyacinthe (about 45 minutes from Montreal) may be about the same size as Rimouski, but its accessibility both to large metropolis and to U.S. markets is not the same. The interdependency of transport modes and the importance of accessibility to multiple locations have at least two implications for regional growth. First, this suggests that in many cases the salient territory will be the broader city-region, encompassing a large metropolis as well as the smaller cities linked to it (but, beyond its commuting shed). Second, it suggests that growth will often concentrate along trade corridors, traversed by various transport modes, combining the advantages – so to speak – of accessibility to distant markets and to cities located on the corridor. The Economist (2006), in a recent article, notes that of the fifteen new car and truck plants that were opened in the U.S. between 1980 and 1990, all but two were built along Interstates 65 and 75, which form a narrow corridor running from Michigan down the Ohio Valley; since then, three more have been built further south on I-65. Lang and Dhavale (2005) note a similar phenomenon – for population growth in general – for other “corridors” in the U.S.; for example, along I-35, which cuts across the United Sates from the Mexican border to Kansas City, crossing San Antonio, Austin, Dallas, and Wichita.. 1.4. The Competition Effects of IT and Lower Transport Costs. A basic tenet of regional economics holds that a fall in communications or transport costs (linkage costs, in other words) will generate competition between the locations connected, and will in turn foster the concentration of production (in one of the locations) if: a) production is subject to scale and/or agglomeration economies; b) one of the two locations holds an initial advantage. This economic “law”, when combined with the rise of face-to-face linkages as a production input, largely explains the trend to spatial concentration. Geographic concentration is facilitated when transport costs are nil or negligible and when the product in question (good or service) is very sensitive to scale and/or agglomeration economies. The entertainment industry is a prime example. It is very sensitive to agglomeration economies, largely defined by its reliance on a diverse web of face-to-face linkages. But, this was also largely true in the past..
(33) 21. What has changed is the cost of transporting the final product (sound, images…), which can now literally be transported free of charge over the air waves or by other electronic media. Video clips or CDs can be mailed at little expense. The result has been the decline of entertainment-related employment in small and middle-sized communities. One simply needs to turn on a Radio, TV or computer, where before one might have gone to a local cinema, show, or concert. The national news we watch on TV is produced in Toronto (if English) or Montreal (if French), where the jobs are located. There are countervailing forces working against spatial concentration. Congestion costs, as we saw, act as barriers to concentration – traffic, housing costs, pollution, higher wages – pushing manufacturing towards smaller places. Resources still need to be exploited where they are found. Information (verbal, written…) is sensitive to cultural and linguistic differences, which has prevented the (total) concentration of entertainment and broadcasting-related jobs, as well as other language-sensitive services,8 in Toronto (Polèse and Shearmur 2004a). However, in the Canadian case, we should not be too optimistic about the decentralising impact of congestion costs. Our largest metropolis – Toronto – is fairly unremarkable by world standards, barely a sixth the size of greater Tokyo and barely fourth that of greater New York. In other words, if communications costs continue to fall in the future, we should expect continued concentration in and around large urban centres. In sum, falling communication costs produce conflicting results. They reduce distance costs, but they also increase competition. The rise of the automobile and of paved roads – greater accessibility, in sum – was largely responsible for the demise of small towns in rural Saskatchewan. Where before, residents shopped locally, they now prefer the nearest larger town, accessible by car. In more recent times, IT and other innovations (i.e. bar codes, ATMs…) have facilitated the spatial concentration of jobs in finance, distribution, and marketing. Warehouses, outlets, and plants can now be more easily managed from the centre. The information highway goes both ways. It opens up big city markets to small distant producers, but it also allows big city producers to penetrate distant markets. Ecommerce has had a devastating effect on many small town wholesalers. That falling transport or communications costs foster centralization runs counter to much popular perception, especially since the arrival of the Internet. As noted earlier, the Internet was supposed have sealed the death of distance. The conclusion seems logical at first sight. Does not modern information technology (IT) free firms from the tyranny of distance, so to speak, from the need to locate in big cities? Witness, for example, the outsourcing of computer programming services to Bangalore (India) and of call centers to smaller-sized cities across North America 8. Other examples are marketing, publicity, and consulting, as well as some financial services..
(34) 22. and elsewhere. To understand what is actually happening, it is useful to think of communications or transport costs as if they were tariffs or other barriers to trade. When such barriers fall, say between two nations, competition increases. If one of the two nations is more efficient in the production of good x, it will increase its share of the market perhaps totally eliminating producers in the other nation. Production of good x is now “centralized” in one nation. The outsourcing of certain services to new (more distant) places does not mean that distance no longer matters. Rather, it means that the new location can produce the service (being outsourced) at lower cost. The fall in communications costs brought on by IT allows production to be increasingly centralized in the new location. In Canada, the largest metropolitan areas – with population over 500,000 – have grown more rapidly than smaller cities since 1991, a sign that on balance IT has not fostered decentralization. This is consistent with historical experience. The arrival of the steam engine (railways), of the telegraph and of the telephone, and of the internal combustion engine (automobiles, trucks) have all been accompanied by periods of rapid urban growth. The introduction of the telegraph more than a century ago (as revolutionary then as the Internet today) did not slow down the growth of New York or London. Quite the contrary, it allowed the financial institutions and corporate offices in those cities to expand their reach around the planet. The arrival of radio in the 1920’s and television thirty years later provide vivid examples of the centralizing impact of communications technologies. Before that, much entertainment was produced locally. Almost every town had its own theatre. Few remain today. Today, for entertainment or news, one turns on the TV, radio, or Internet. For American or British audiences, the person on the other side (actor, singer, newscaster…) will most likely be in New York, Los Angeles or London. An obvious implication of the above is that any infrastructure that facilitates trade will also foster agglomeration – in those places best able to dominate the market. Our reference to tariffs and trade barriers was not accidental. Economic integration – NAFTA, globalisation – facilitates agglomeration. At the risk of repetition: low transport and communication costs and falling barriers to trade allow industries to centralize operations. This, in the end, brings us back to the fundamental question in economic geography: why do firms or other institutions choose to “centralize” their operations in one place rather than another? Which is simply another way of restating our central question: why do some communities grow while others lag behind? Numerous other factors, we have suggested, influence regional growth (or decline). An abundant literature has accumulated over the years – in economics, geography, and regional science – on the issue of regional growth; to which we now turn..
(35) 23. 1.5. Unravelling the Myriad Components of Regional Growth: What Is Local and What Is Not?. In this section, we briefly outline two complementary approaches to understanding regional growth. We specifically distinguish between endogenous place-based factors, which focus upon local milieus and local innovation systems, and approaches – closer to the research traditions of regional economics and economic geography – that focus upon broader geo-structural factors. As will become clearer as we proceed, the introduction – into our model – of explicit accessibility variables is in part an attempt to operationalize and to better measure those geo-structural factors. Much has been written on what makes a region grow, and often it is growth in per capita incomes or GDP, rather than employment, that is analysed (Barro and SalaI-Martin 1991, 1995; Coulombe 2000; Kangasharju 1998; Kangasharju and Pekala 2000). However, as Martin and Tyler (2000) point out, local employment growth is not necessarily connected to local per capita income or GDP. It is quite conceivable for local wages and per capita GDP to rise (because of rising productivity) at the same time as local employment falls. Of course, productivity and employment are not unrelated: if a region provides conditions that are conducive to productivity growth, then economic activity will flow towards it in order to benefit from these conditions. But this link, which is often taken for granted in larger and more diversified regions, is not so evident in smaller and more specialized ones: in such regions there may indeed exist a high-productivity environment but only for a few industries. If employment declines in these industries, few if any alternatives exist. The two approaches – “local” and geo-structural – are complementary. Both approaches to understanding regional growth take regions – communities, localities – as their unit of analysis, and try to understand growth by looking at what is happening within regions (local intra-regional analysis – a micro approach) or between regions (geo-structural approach – a macro approach). A critical factor is the scale at which regions are defined: at a very large scale (the world), all factors are local. As the scale of analysis becomes smaller – and in Canada we shall often be working with very small units9 – a key question is whether factors that are endogenous at one scale (e.g. education levels at the scale of nations) are exogenous at another (e.g. education levels in small resource based towns). In this study, we can only provide a broad outline of the two approaches. The aim is to highlight some of the growth factors that each approach identifies, and to specify the general framework within which our model – presented below – is situated. 9. 75% of our spatial units have fewer than 50,000 residents in 2001, and 50% have fewer than 25,000. Two hundred and fifteen of the spatial units (those considered rural) do not include any urban area of over 10,000 people..
(36) 24. 1.5.1. The “local” approach to regional growth. Work on community development, on the clustering of economic activity, on local milieus, and on regional innovation systems has in common the fact that certain local factors or processes are studied in order to obtain a better understanding of a region’s economic performance. The focus and the methodology of this work vary greatly. Some researchers examine the institutional framework within regions (Maillat 1990, Maillat and Kébir 2001; Cooke et al. 2004); others study individual and collective actors involved in development processes (Galaway and Hudson 1994); others still explore interfirm dynamics and the way in which knowledge spillovers, competition and cooperation can lead to innovation and growth (Jacobs 1984; Piore and Sabel 1984; Porter 1990, 2000; Malecki and Oinas, 1999). Related work explores endogenous growth (Romer 1989; Martin and Sunley 1998), human capital (Romer 1989, Florida 2002), social capital (OECD 2001, Putnam 2001), and knowledge spillovers (Audretsch and Feldman 1996). Finally, others have looked at local development more from a policy perspective, emphasising the power of local government action and community organization (Bennington and Geddes 1992, Blackey 1994, EEC 1990, Perry 1987, Wievel and Hall 1992). A number of local or endogenous factors that appear to be conducive to productivity growth and innovation10 have been uncovered. On the whole they fall into three groups, which we will briefly describe. First, institutional factors are often presented as key to understanding the local development process (Maillat and Kébir 2001; Cooke et al. 2004): the way in which local governments, chambers of commerce, universities and so on interact amongst themselves and with the local and non-local business community can have an impact (positive or negative) on growth. Second, local business practices and industrial structure (Birch 1987; Giaoutzi et al. 1988; Piore and SabeL 1984; Porter 1996, 1998) are seen as contributing to local economic success: a stimulating combination of competition and cooperation, which both encourages productivity and innovation whilst ensuring that information and know-how are shared, can lead to growth. By contrast, an industrial structure dominated by a few large firms, or by passive subcontractors, can slow local development. Third, and somewhat more vaguely, local culture – attitudes towards new ideas, entrepreneurship, innovation, wage expectations, trade-unionism (Pecqueur 1989; Florida 2002) – can be an important factor in determining growth prospects in a region.. 10. Innovation is not distinguished here from productivity: firms can compete on a cost basis (traditional productivity) or on a quality basis (new or improved products). The recent focus on innovation can be partly explained by the recognition that many industries can no longer compete with developing countries on a pure cost basis (Krugman 1991). Productivity and innovation are directly linked if process innovations are considered..
(37) 25. The quality of the local labour force, and in particular the knowledge that it embodies, has been linked with growth at the national and metropolitan scale (Florida 1995; Lever 2002; Romer 1989; Simon 1998). However, the extent to which it is a “local” factor at smaller scales – such as those often encountered in Canada – is debatable because qualified labour is mobile, and can itself be attracted to regions that display conditions conducive to productivity and innovation. A more “classic” factor that is associated with local development is industrial structure: the mix of economic sectors in a locality can determine growth in a variety of ways, some of which are recognised and investigated in the literature on milieus. Randall and Ironside (1996) and Cuadrado-Roura and Rubalcaba-Bermejo (1998) show how specialisation in particular sectors can lead to volatility, but also, if output from the sectors is in demand, to strong growth. Porter (1998) describes how specialisation in certain types of industry is associated with development, and the work by Henderson (Beardsell and Henderson 1999) and others on agglomeration economies emphasises the importance of the concentration of certain sectors. From another perspective, the tradition of shift-share analysis in regional science rests upon the assumption that local employment growth is partly attributable to industrial structure (Lamarche 2003). Finally, although not often treated in the literature on local innovation systems and milieus, costs are an important factor that may determine levels of employment growth. To the extent that costs are determined locally – wages, taxes, land costs – they are place-based: but to the extent that they are a reflection of transport costs and distance from markets, they are geo-structural in nature. Notwithstanding the problems associated with categorizing costs as endogenous or exogenous, cost minimization is the straightforward attempt by each firm to identify the location that will enable it to produce a given item at the lowest cost – including transport – given the structure of its inputs and outputs. It is important to note that there is nothing in these “local” place-based factors that necessarily ties them to any particular type of region or community. Indeed, development policies have attempted to nurture productive milieus, competitive industrial structures or business-friendly environments in a variety of regions decline (OECD 2002; Pezzini 2000). Thus, in Canada, the local economic development initiatives sponsored by ACOA – Atlantic Canada Opportunities Agency – are not limited to the poorest communities of the region, but also involve urban centres such as Moncton, St John’s, and Halifax. However, as Hall (1999), Simmie (2001), Jacobs (1984), Malecki et al. (2004) and Crevoisier and Camagni (2000) emphasize, it is most often in large cities that the cultural, institutional and business practice elements conducive to growth are combined. In the same way, the link between labour force qualification and employment growth (Gertler et al. 2002) is closely related to urban size: there is a strong tendency for larger cities to have proportionally more qualified inhabitants.
Figure
Documents relatifs
Focusing on nuclear energy consumption and using a panel cointegration test for sixteen countries, Apergis & Payne (2010) find a bidirectional relationship with GDP
Among these elements are the uselessness of protective rules of employees in terms of efficiency, 14 the incompleteness of formal employment contracts, which give
Saidi K and Mbarek M B 2016 Nuclear energy, renewable energy, CO 2 emissions, and economic growth for nine developed countries: evidence from panel Granger causality tests
In china, researches on the relationship between ICT application and economic growth are also followed the two directions, noteworthy studies includes: Zhu Youping (1996) uses
The results showed that public investment in transport causes positive effect and it is statistically significant on the economic performance of the Brazilian states [5].... 2 Luz
The study utilizes panel data on seven variables – per capita CO 2 emissions, GDP per capita, energy consumption, human population, trade openness, financial
Money Matters: Mobile Workforces and Local Economic Development in Source Communities...
What are the impacts of commuting on community development in source communities. Community
