HAL Id: hal-00806406
https://hal.archives-ouvertes.fr/hal-00806406
Submitted on 30 Mar 2013
HAL is a multi-disciplinary open access
archive for the deposit and dissemination of
sci-entific research documents, whether they are
pub-lished or not. The documents may come from
teaching and research institutions in France or
abroad, or from public or private research centers.
L’archive ouverte pluridisciplinaire HAL, est
destinée au dépôt et à la diffusion de documents
scientifiques de niveau recherche, publiés ou non,
émanant des établissements d’enseignement et de
recherche français ou étrangers, des laboratoires
publics ou privés.
Stochastic improvement of inspection and maintenance
of corroding reinforced concrete structures placed in
unsaturated environments
Emilio Bastidas-Arteaga, Franck Schoefs
To cite this version:
Emilio Bastidas-Arteaga, Franck Schoefs. Stochastic improvement of inspection and maintenance of
corroding reinforced concrete structures placed in unsaturated environments. Engineering Structures,
Elsevier, 2012, 41, pp.50-62. �10.1016/j.engstruct.2012.03.011�. �hal-00806406�
Stochastic improvement of inspection and maintenance of corroding
reinforced concrete structures placed in unsaturated environments
Emilio Bastidas-Arteagaa, Franck Schoefsa
aLUNAM Universit´e, University of Nantes, Research Institute in Civil and Mechanical Engineering, UMR CNRS 6183, 2
rue de l’Houssinire, BP 92208 - 44322 Nantes cedex 3, France
Abstract
Multiple constraints imposed by economic, social and environmental considerations lead maintenance planning optimization to a major challenge for designers, owners and users of infrastructure. This study focuses on the management of reinforced concrete (RC) structures placed in chloride-contaminated atmo-spheres. Under these exposure conditions, chloride penetration generates corrosion of the reinforcing bars reducing the RC durability. Therefore, modeling the deterioration process as well as the maintenance actions carried out during the operational life becomes paramount for the formulation of a comprehensive main-tenance strategy. This paper presents a new methodology for improving the performance of mainmain-tenance strategies for corroding RC structures. The proposed approach is based on preventive maintenance and com-bines: a numerical model of chloride penetration, Markov processes and decision theory. The uncertainty related to material properties, model and environmental actions as well as the e↵ect of imperfect inspections are also integrated in the model. The aforementioned points are illustrated with a numerical example. In general, the overall results indicate that the proposed methodology can be useful to improve the costs of a given maintenance strategy by ensuring appropriate levels of serviceability and safety.
Keywords:
Chloride ingress, corrosion, reinforced concrete, reliability, inspection, maintenance, unsaturated environments
1. Introduction
Nowadays, design and management of infrastructure must consider economic, social and environmental constraints to reduce environmental impact, to optimize resource management and to decrease waste gen-eration. This new trend in design and management must also consider all the phenomena that a↵ect the structural performance. For reinforced concrete (RC) structures, corrosion induced by chloride ingress gen-erates important damage after 10 or 20 years of service [1, 2]. The management of corroding RC structures should therefore integrate the stages of inspection and maintenance to ensure an optimal level of safety dur-ing its operational life. However, the complexity and the uncertainties related to the deterioration process and the repair techniques transform management into a challenge for owners/operators where decisions are
frequently taken without being aware of the consequences of the actions. Many deteriorated structures are being currently evaluated for possible repair and continued service because they are situated where their replacement would be economically unfeasible. For instance, Bhide [3] reports that about 173,000 bridges in the United States are structurally deficient or functionally obsolete due in part to corrosion. Thus, develop-ing robust models for prediction and strategies for periodic inspection and maintenance plays a significant role in enabling target reliabilities to be met over a period of continued service [4].
Management of deteriorating structures should also include the variability and uncertainties present in both deterioration process and maintenance actions. The main sources of uncertainty are related to properties of construction and repair materials, environmental actions (climate conditions, chloride concen-trations), loading and e↵ectiveness of inspection and repair actions. The following approaches can be used to model deterioration and maintenance actions by taking into consideration the aforementioned aspects [5]: (i) failure rate functions, (ii) Markov models, (iii) stochastic processes, and (iv) time-dependent reliability index. Maintenance based on failure rate function is useful in electrical or mechanical engineering where the states of “functioning” and “failure” are well-defined. However, the concept of structural failure in civil engi-neering can be related to di↵erent structural conditions (i.e., corrosion initiation, loss of serviceability, etc.). Markov-based management systems are widely used in management of civil engineering systems [6, 7, 8]. However, since the most part of these systems are based on visual inspection, the major limitation of this approach is that reliability is not directly incorporated in structural management [9]. Time-dependent dete-rioration processes and maintenance actions can also be modeled by stochastic processes. In particular, the gamma process has been widely used to represent several deterioration processes such as: permanent erosion of dunes, long-shore rock transport near berm breakwaters, loss of steel thickness due to corrosion, etc. [5]. However, this model only focuses on one component, one failure mode and one uncertainty [10] and the identification of its parameters for common deterioration processes is still a challenge [11]. Reliability-based management systems minimize costs by ensuring an optimal level of safety. One major advantage of this approach lies in the direct incorporation of the uncertainties and in the consideration of various limit states and failure modes. However, the main disadvantage of this approach is that the e↵ects of maintenance are difficult to estimate [5].
Each management approach has its advantages and shortcomings. The selection of a given approach should take into account other aspects such as: context (civil, mechanical or electrical engineering prob-lems), size of studied problem (network or single structures), and other socio-economic aspects (priorities of the agency, country). The main purpose of this paper is to develop a methodology to improve the manage-ment of RC structures subjected to chloride penetration. Improved managemanage-ment should minimize the costs of inspection, repair, corrosion initiation and failure ensuring appropriate levels of serviceability and safety. This study uses a Markovian approach for modeling deterioration and maintenance actions. Contrary to the Markov-based management systems available in the literature, inspections are based on a measurable
pa-rameter (chloride concentration) and consider the uncertainty of the measurements (imperfect inspections). Consequently, inspection results a↵ect the assessment of the probability of corrosion initiation or failure used in the management system. Within this context, the specific objectives of this paper are:
1. to define a comprehensive strategy that could be used to maintain corroding RC structures;
2. to integrate a probabilistic model of chloride penetration for modeling this phenomenon as a Markov chain;
3. to develop a model of maintenance that includes various practical problems such as errors in the inspection measurements and uncertainties; and
4. to study the e↵ect of the model parameters on the total costs and to illustrate its use for decision-making.
The description of the maintenance strategy is presented in section 2. Section 3 details the assessment of the transition matrices used for modeling chloride penetration. The maintenance and cost models are described in sections 4 and 5. Finally, section 6 presents a numerical example illustrating the proposed methodology.
2. Description of the strategy of maintenance
Maintenance strategies should ensure optimal levels of serviceability and safety during the structural life-time minimizing both costs and environmental impact. Therefore, when structural performance is strongly a↵ected by the kinematics of the deterioration process, repair and/or replacement of structural components are the only way to maintain appropriate serviceability and safety levels. This study supposes that repair actions are based on inspection results. Then, the strategy of maintenance is divided into two stages: in-spection and repair. Inin-spection results alert the owner/operator when a given deterioration threshold is reached. Repair actions should ensure an appropriate structural condition.
Inspection can be carried out by employing nondestructive and/or destructive methods. Visual inspection is a nondestructive technique usually used for evaluating the condition of deteriorating RC structures based on the appearance of the structure [8]. However, the assessment of the structural condition remains largely uncertain for this technique. Nowadays, there have been significant advances in the development of inspection methods based on nondestructive monitoring. Nondestructive techniques aim at quantifying the instant value or the evolution in the time of a given variable (material strength, chloride concentrations, corrosion rate, etc.) from measurements of a physical parameter (frequency, capacity, etc.). Nevertheless, their results are highly influenced by environmental conditions reducing its accuracy [12, 13]. The accuracy of inspection results is largely improved by using destructive inspection techniques. However, they are expensive, time-consuming and require a larger number of tests when there is a larger variability of the inspected parameter. The selection of one or a combination of inspection/repair techniques depends on several aspects such as:
• the type of inspected phenomenon –e.g., material strength, chloride concentration, etc.; • size of the project –e.g., structural network or particular structure;
• accessibility to the inspection/repair area –e.g., immersed, splash and tidal or atmospheric zone; • use of the structure –e.g., nuclear, transportation, etc. This point is related to the risk allowed by the
agency; and
• other socio-economic aspects such as priorities of the country, availability of resources, etc.
This study refers to RC structures subjected to chloride ingress and is focused on the maintenance of structural components of a single structure placed in a splash and tidal zone. The requirements for the selection of a maintenance strategy were defined within the framework of the project FUI (2007-2010) MAREO1[14] with the collaboration of agencies, construction companies and research centers. The corrosion damage is important in this zone because there is a higher availability of chlorides and oxygen in the environment and chloride ingress is accelerated by wetting/drying cycles. Moreover, this area is the most critical for the e↵ectiveness of inspection and repair due to varying conditions with the tide level. Then, stakeholders manifest that inspection and repair in this zone become an important issue for infrastructure management.
The selection of the strategy of maintenance took into account both the characteristics of the targeted repair zone and previous experience of stakeholders with other repair techniques –i.e., cathodic protection, use of inhibitors, patch repair, etc. In the strategy of maintenance considered herein, inspection is undertaken by analyzing the concentration of chlorides at the cover depth on concrete cores (semi-destructive method). Afterwards, depending on inspection results, the repair technique consists in rebuilding the polluted concrete cover by several methods. The advantage of the proposed approach is that repair is more preventive than corrective. This characteristic ensures an optimal level of safety during the lifespan of the project.
2.1. Definition of the repair criterion
The owners/operators define the schedule of repair actions on the basis of a given criterion related to an allowable damage threshold. The selection of the repair criterion is an important topic in maintenance because it should consider several aspects that di↵er for particular problems –i.e., economic, environmental, practical, etc. This study establishes a repair criterion where the structure is repaired before corrosion initiation. This criterion can be considered conservative in comparison to other criteria found in the literature where repair is carried out after initial or several concrete cracking occurs [15]. Thus, the consequences of failure (corrosion initiation) remain moderate in terms of economy, safety and functionality.
The criterion proposed herein has been defined after discussion with the stakeholders participating in the MAREO project taking into account the following reasons:
• Reduction of the structural safety decay. When the repair criterion is based on the structural condition after corrosion initiation (e.g., concrete cracking), structural safety is a↵ected by the loss of reinforcing steel. Therefore, the assessment of the next repair time should consider this loss and/or the replacement of the corroded reinforcing bars at a given time. These considerations make the repair scheme complex because the repair times are time-dependent and the strengthening actions should be included in the analysis. Since for the selected criterion repair is carried out before corrosion initiation, it is possible to assume that after each repair the RC member is “as good as new”. Under this assumption, the repair intervals are constant.
• Reduction of the replacement of reinforcing bars. From a practical point of view, the building companies manifest that the replacement of reinforcing bars in existing structures is complicated. Therefore, another advantage of the proposed criterion is that, since repair takes place before corrosion initiation, the replacement of corroded bars is reduced. However, the condition of reinforcement should be checked before cover rebuilding.
• Inspection based on a quantifiable parameter. This criterion is convenient to combine the maintenance strategy with inspections because it is based on a measurable variable (chloride concentration at the reinforcement depth). Furthermore, the owner/operator can use the inspection results to update the condition of the structure before repair calibrating the maintenance schedule.
This repair criterion is related to the probability of corrosion initiation. Then, the determination of an appropriate threshold chloride concentration for corrosion initiation, Cth, becomes a major challenge for the owner/operator. It is not feasible to define a representative value for this parameter because there is a wide range of threshold chloride concentrations for corrosion initiation suggested in the literature. This larger variability can be attributed to the number of parameters influencing Cth: type and content of cement, exposure conditions, time and type of exposure, distance to the sea, oxygen availability at the bar depth, type of steel, electrical potential of the bar surface, presence of air voids, etc. In addition, the following aspects add more variability to the problem [16, 17]:
• Definition of corrosion initiation: As discussed in Duracrete project [18], corrosion initiation could be defined as the depassivation of the reinforcing steel (a shift in the potential or rate of corrosion) or associated with “visible” or “acceptable” deterioration of the RC structure. The adopted scheme of inspection/maintenance considers depassivation as the definition of corrosion initiation. According to [19], depassivation occurs when, in a surface of steel of 1 cm2, the corrosion rate is higher than 0.1 µA.
• Technique used to determine active corrosion: The method used to determine depassivation also influences the measurement of Cth. A certain decay of corrosion potential Ecorr or an increase of corrosion rate icorrcan be used as indicators of corrosion initiation. However, taking into account that there is no direct relationship between Ecorr and icorr [20], the assessment of Cth for each technique would lead to di↵erent values. Consequently, an increase in corrosion rate is considered herein to define Cth.
• Testing methods for chloride threshold determination: Alonso and Sanchez [16] classified these testing methods into two categories:
– Accelerated methods: these methods are carried out in laboratory and take into account any external action that could a↵ect the electrochemical conditions of the surface of the reinforcement from its natural state accelerating chloride penetration and/or corrosion initiation.
– Natural methods: this category considers on-site tests or tests under natural exposure conditions. Therefore, the electrochemical changes occurring at the surface of the reinforcement during de-passivation are not a↵ected by any electrical action.
As expected, threshold chloride concentrations for accelerated methods are lower than those for natural methods. Depending on the technique for the accelerated methods (potentiostatic and migration), the mean value of the total threshold chloride concentration measured by natural methods can be reduced from 25 to 92% [16]. Accordingly, the threshold chloride concentrations measured by natural methods are considered herein because they are more representative of real exposure conditions.
Table 1 presents the values of Cthrelated to depassivation and measured taking into account an increase of the corrosion rate for natural methods [16]. To compute Cth in kg/m3, it is assumed that the concrete contains 400 kg of cement per m3 because the real cement content is unknown. This cement content corresponds to repair materials (mortar or concrete) specially used when repair is carried out in the splash and tidal zone. However, the real cement content should be used for a practical application. Table 1 shows that for a given environmental exposure, a lower value of the mean of Cth implies that the quantity of chlorides required to initiate the corrosion reaction is small. It is also noted that the mean and the standard deviation of Cth are highly dependent on concrete cracking and exposure conditions (immersed or in air). The worst condition corresponds to cracked structures exposed to the air above the splash zone. In this case, since the availability of oxygen and water at the corrosion cell is larger, the quantity of chlorides required for corrosion initiation decreases. It is also important to note that the larger variability for “in field” case is explained by the fact that this category groups measurements for several environmental conditions.
3. Modeling chloride ingress
Taking into account that there are many factors that influence the deterioration process and the e↵ects of maintenance on RC structures, numerical models could be used to represent deterioration and maintenance, and therefore, to improve decision-making. Many management systems use Markov chains to simulate deterioration and repair of structures over the time [8, 21, 22]. This study also uses a Markovian approach that integrates the following aspects:
• a comprehensive model of chloride penetration; • the accuracy of the inspection technique; and
• the uncertainty inherent to chloride penetration, corrosion initiation and inspection results.
A discrete-time Markov process can be used to predict the future by knowing the present state. Towards this aim, the space of the variable of interest is discretized into M states. The Markov process is thus used to determine the probability that an event belongs to a state j knowing that for a preceding time step it belonged to a state i. This probability, noted ai,j= P[Xt+1= j|Xt= i], is called transition probability. It is considered herein that ai,j is independent of t (Discrete-time Markov process). The transition probabilities can be grouped in a matrix of size M ⇥ M called transition matrix P [23]. According to the Chapman-Kolmogorov equations, by knowing the initial state, the probabilities of belonging to the M states after t transitions, q(t), are [23]:
q(t) = qiniPt (1)
where the vector qini contains the probabilities of belonging to the states at an initial time –i.e., t = 0. In this study, the variable of interest is the concentration of chlorides at the cover depth which controls corrosion initiation. Therefore, the Markov processes will provide the probability that the concentration of chlorides at the cover depth belongs to a given state in time –i.e., q(t) = C(t) = qiniPt. If it is supposed that after construction (t = 0) the concentration of chlorides at the cover depth is zero, all the concentrations will belong to the first state, and the vector qini becomes qini= Cini= [1, 0, 0, ..., 0].
In several applications of Markov chains, the transition matrix is obtained from experimental data or expert judgment. However, for chloride penetration, the assessment of P from experimental measurements presents two difficulties:
• Given that the rate of chloride ingress into concrete is slow, it is difficult to study the evolution of chloride ingress before construction. Accelerated tests or the use of data obtained for similar materials could be considered to solve this problem.
• Since chloride ingress is influenced by several parameters such as concrete properties, environmental exposure, etc. [24, 25]; it is necessary to perform a large number of measurements to obtain a good representation of the phenomenon. This is difficult to pursue in practice because experimental testing is expensive and time-consuming.
Consequently, it is proposed herein to estimate the probabilities C(t) on the basis of a numerical model of chloride penetration. The computed values bC(t) will be used afterwards to estimate the transition matrix P. Section 3.1 outlines the model of chloride penetration considered. Section 3.2 describes the method proposed to compute the transition matrix.
3.1. Modeling chloride ingress in unsaturated environments
The chloride ingress model adopted considers the interaction between three physical phenomena: chloride ingress, moisture di↵usion and heat transfer. Each phenomenon is represented by a partial di↵erential equation expressed in the following general form:
⇣@ @t = div J| {z } di↵usion + div J| {z }0 convection (2)
where ⇣ represents the studied parameter, t is the time and the correspondence between , J, J0 and the terms for the physical problem is presented in Table 2.
For chloride ingress, Cf cis the concentration of free chlorides, h is the relative humidity and D⇤c and Dh⇤ represent the apparent chloride and humidity di↵usion coefficients, respectively:
D⇤c = Dc,ref f1(T )f2(t)f3(h) 1 + (1/we) (@Cbc/@Cf c) (3) D⇤h= Dh,ref g1(h)g2(T )g3(te) 1 + (1/we) (@Cbc/@Cf c) (4) where Dc,ref and Dh,ref are reference di↵usion coefficients measured to standard conditions [26], weis the evaporable water content, and fi and gi are correction functions to account for the e↵ects of temperature, relative humidity, aging and degree of hydration of concrete. These functions are detailed in [24]. The term @Cbc/@Cf c represents the binding capacity of the cementitious system which relates the free and bound chlorides concentration at equilibrium. This relationship is considered herein by using the Langmuir isotherm [24].
For moisture di↵usion, the humidity di↵usion coefficient Dhis estimated by accounting for the influence of the parameters presented in eq. 2. The term @we/@h (Table 2) represents the moisture capacity which relates the amount of free water, we, and the pore relative humidity, h. For a given temperature this relationship has been determined experimentally by adsorption isotherms. According to the Brunauer-Skalny-Bodor model, the adsorption isotherm depends on temperature, water/cement ratio, w/c, and the
degree of the hydration attained in the concrete, te. This work adopts such a model to represent the moisture capacity.
Finally, for heat transfer (Table 2) ⇢c is the concrete density, cq is the concrete specific heat capacity, is the thermal conductivity of concrete and T is the temperature inside the concrete after time t.
The flow of chlorides into concrete is estimated by solving simultaneously the system of equations de-scribed by eq. 2 and Table 2. The numerical approach used to solve the coupled system of partial di↵erential equations combines a finite element formulation with finite di↵erence to estimate the spatial and temporal variation of Cf c, h and T [24]. Then, the time to corrosion initiation, tini, is estimated by comparing the chloride concentration at the cover depth, ct, with a concentration threshold for corrosion initiation Cth. 3.2. Estimation of transition matrix from simulations
Transition matrices are estimated from Monte Carlo simulations of the model of chloride penetration presented previously. The random variables used in the simulation are presented in Table 3. Each simulation records the chloride concentration at cover depth during time. From all simulations, it is determined the frequency of belonging to a given state –i.e., histogram. The evaluation of the probability that the chloride concentration at the cover depth belongs to the state j at time t is assessed by computing:
b Cj(t) =
nj(t)
N (5)
where nj(t) is the number of observations in the state j measured at time t and N is the number of simulations. Figure 1 shows the variation of bCj(t) obtained from Monte Carlo simulations and Markov chains considering: N = 100, 000 simulations, M = 10 states and for the original material (Table 3). As expected, whereas the probability of belonging to the first state decreases with time, it increases for the last state.
Once the probabilities bC(t) have been estimated, the transition probabilities can be determined by minimizing the di↵erence between bC(t) and the probabilities obtained from the Markov model (eq. 1). Thus, there are M functions to minimize:
8 > > < > > : min
a maxF F(a) = (f1(a), f2(a), . . . , fM(a)) T
u.c. ai,j 0 and 1 X j=0
ai,j= 1
(6)
where a is a vector containing the transitions probabilities (optimization parameters) and fj(a) is the explained sum of squares for each state j:
fj(a) =
tXana
t=0
where tana represents the analysis period used to perform the adjustment. This problem of multi-objective optimization has been solved by using the “optimization toolbox” of Matlab c . The selected optimization method minimizes the maximum value of a set of multi-variable functions from an initial value.
The optimization problem is very sensitive to the kind of Markov Model chosen. In other words, the di↵erence between Monte-Carlo and Markov simulations decreases when the Markov model considers optimal values for: (i) the number of terms ai,j, (ii) the number of states M , and (iii) an initiation phase tM0 . These numerical aspects are discussed in detail in [27]. Various studies consider a Markov matrix with two terms ai,j per state [8, 28]. In such a case, the transition probabilities can be estimated from a non-linear regression. However, complex stochastic phenomena cannot be modeled by a transition matrix with two transition probabilities per state [8]. When all the terms aij of the transition matrix are estimated, it has been observed that most terms are close to zero [27]. Consequently, after optimizing the number of terms per state ai,j, this study considers a transition matrix with three terms per state. For instance, for M = 5 states, the transition matrix becomes:
P = 2 6 6 6 6 6 6 6 6 6 4 a1,1 a1,2 a1,3 0 0 0 a2,2 a2,3 a2,4 0 0 0 a3,3 a3,4 a3,5 0 0 0 a4,4 a4,5 0 0 0 0 1 3 7 7 7 7 7 7 7 7 7 5 (8)
Taking into account the data presented in Table 3 and minimizing the di↵erence between the values predicted with Monte-Carlo and Markov models, it is adopted a transition matrix with M = 10 states [27]. The consideration of an initiation phase, tM
0 , improves the predictability of the Markov model. This initiation phase represents the time needed for chlorides to reach the cover depth. Therefore, for a new or repaired structure, the defects belonging to the first state are forced to remain in such a state during the initiation phase [29]. The length of this initiation phase varies in terms of the di↵usivity of the repair material. For the material presented in Figure 1, an initiation phase of tM
0 = 15 year minimizes the explained sum of squares. Considering this value, M = 10 and three transition probabilities per state, Figure 1 presents a comparison between the probabilities estimated from Markov and Monte-Carlo simulations for the states 1, 5 and 10. It is observed that, under these considerations, the probabilities estimated from the Markov model have good agreement with those computed from Monte-Carlo simulation. Therefore, this study will adopt these characteristics for modeling chloride ingress using Markov chains.
4. Probabilistic modeling of inspection and repair 4.1. Consideration of imperfect inspections
The selected maintenance strategy considers that the structure is inspected periodically every t years. Inspections aim to establish the “real” or “theoretical” chloride concentration at the cover depth, C, to determine the corrosion initiation probability. This information could be used by the owner/operator to decide if the structure must be repaired or not. The experimental test considered in the adopted maintenance strategy to determine the chloride concentration at a given depth (chloride profile) is based on the AFREM procedure [30, 31]. This test determines free or total chloride profiles from the titration of powder extracted from concrete cores at di↵erent depths. Although this procedure is widely used to determine chloride profiles worldwide, Bonnet et al. [32] found that there are significant di↵erences between theoretical and measured chloride content profiles (Figure 2). Theoretical profiles are computed from analytical functions knowing the porosity and the chloride concentration in water. This di↵erence has been related to the error in the protocol, the error due to material variability and the error induced by the operator. To take into account the influence of error in measurement, the di↵erence between measured bC and theoretical C values is usually modeled by a noise [33]:
⌘ = bC C (9)
where ⌘ represents an unbiased noise. As observed in Figure 2 and as reported by [32], chloride measurements underestimate theoretical chloride concentrations. To account for this aspect, a bias b⌘ is added to eq. 9:
b
C = C + ⌘ + b⌘ (10)
Errors in measurement can lead, for a given inspection, to under- or overestimations of the measured parameter. If it is underestimated, the owner/operator could decide to “do nothing” when repair is required. This erroneous decision increases the probability of failure and can produce overcharges if excessive repair should be carried out in the future. On the contrary, an overestimation generates a “wrong” decision where the early repair generates overcharges. Repair is undertaken in the adopted approach when inspection indicates that the chloride content at the corrosion cell reaches a repair value Crep. This value can be defined in the construction standards or based on expert judgment and is related to the required safety level itself linked to the allowable risk. From a probabilistic point of view, two measures can be defined to consider imperfect inspections:
• probability of good assessment, PGA: determines the probability of detecting an event (e.g. chloride concentration higher than the repair value) given that the event exists:
• probability of wrong assessment, PWA: establishes the probability of detecting an event given that it does not exist:
PWA = P( bC(X) Crep|C(X) < Crep) (12)
where X is a vector containing the considered random variables.
The probabilities of good and wrong assessment are estimated taking into account the probability density functions (PDF) of the noise and the signal [34, 33]. Therefore, the PDFs of noise and signal (chloride concentration) and the repair concentration should be determined for a particular problem. They will depend on the characteristics of both the inspection technique and the inspected parameter. It is supposed herein that the noise is independent of the real chloride concentration because there are several sources of error influencing the results of the inspection. This assumption has been validated from a series of measurements on metallic harbor structures [12]. It is also assumed that the distribution of the noise and the repair concentration are constant for each inspection.
The noise is usually modeled by a normal random variable. Nonetheless, on the basis of experimental measurements, Bonnet et al [32] report that a generalized extreme value distribution (GEV) is more appro-priate to represent the noise for the adopted technique of inspection. The parameters estimated (in kg/kg of concrete) are: scale K⌘ = 0.016, shape ⌘ = 9.3⇥ 10 5 and location µ⌘ = 8.4⇥ 10 5. For a density of concrete of ⇢c = 2400 kg/m3, the shape and location of ⌘ in kg of chlorides per m3 are ⌘ = 0.2 and µ⌘ = 0.2, respectively. By considering that the chloride concentration cannot be negative, and by fitting some chloride concentrations obtained from the model presented in section 3.1, it is assumed herein that C is log-normally distributed with mean µC and standard deviation C. Taking into account that, for this problem, the noise is modeled as a random variable with an important variability, it is possible to consider that the eventsh bC(X) Crepi and hC(X) Crepi are weakly correlated. Consequently, it is assumed that both events are independent and that the probability of good assessment becomes:
PGA = P[g(X) 0)] (13)
where g(X) is the limit state function. In this problem, there is no analytical solution to estimate PGA from eq. 13. Therefore, PGA is numerically computed by using a first order reliability method (FORM) where the limit state function is:
g(X) = Crep C(X) ⌘(X) (14)
It is assumed in eq. 14 that, knowing the bias, the measurements can be unbiased –i.e., b⌘= 0. By taking into account that the repair concentration Crepis deterministic and that ⌘ follows a GEV distribution, the probability of wrong assessment can be estimated as:
PWA = 1 exp 1 + K⌘ ✓ Crep µ⌘ ⌘ ◆ 1/K⌘! (15)
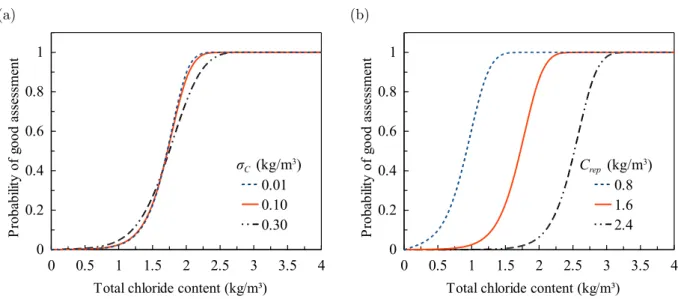
Equation 14 shows that PGA depends on the chloride content C, the repair concentration Crep, and the characteristics of the noise. From the probabilistic model of chloride penetration presented in section 3.1, it has been determined that the standard deviation of C for ordinary Portland concrete is about C= 0.10 kg/m3. However, this parameter should be determined for a particular problem. Figure 3a presents the influence of C on PGA when µ⌘ = 0.2 kg/m3, ⌘ = 0.2 kg/m3 and Crep= 1.6 kg/m3. Overall behavior indicates that PGA increases for higher total chloride contents. Note that small variations of C from the estimated value do not produce appreciable changes in PGA. Then, this study adopts the value estimated from simulations –i.e., C= 0.10. These results indicate that the precision of the inspection technique is not suitable for measuring small chloride concentrations. However, it can be used to determine concentrations higher than 0.3 kg/m3which are compared with the threshold chloride concentration for corrosion initiation, that varies between 1 and 2.5 kg/m3, to determine if the structure should be repaired or not. Further research should be addressed to improve the precision of the inspection technique.
Figure 3b describes the interaction between the repair concentration Crepand PGA. These values were obtained for the following conditions: C = 0.10 kg/m3, µ⌘ = 0.2 kg/m3 and ⌘ = 0.10 kg/m3. PGA is very sensitive to Crep diminishing when the repair concentration increases. The repair concentration indicates a limit after which the structure is repaired. This value can be defined according to the construction standards or based on expert judgment. The French standard [35] establishes that the maximum allowable chloride content is 0.4% wt. cem. (⇡1.6 kg/m3 for a cement content of 400 kg per m3 of concrete and ⇢c = 2400 kg/m3) whereas the Spanish standard [36] recommends a higher value (i.e., 0.6% wt. cem. ⇡ 2.4 kg/m3). Taking into account the higher influence of this parameter on PGA, the considerations for selecting a representative value will be discussed in section 6.
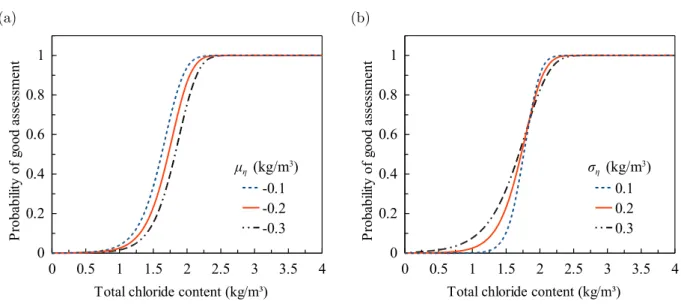
The influence of the mean and standard deviation of noise on PGA is presented in Figure 4. The PGAs presented in this figure were computed with the following parameters: C = 0.10 kg/m3 and Crep = 1.6 kg/m3. As expected, the PGA are larger when µ
⌘ tends to zero and the change in PGA from 0 to 1 is more pronounced when ⌘ increases. This indicates that the precision of the inspection technique is improved for smaller µ⌘ and ⌘. For the value reported by [32], the PGA vary from 2% to 100% for chloride contents between 1 and 2.2 kg/m3 which are in the interval of interest.
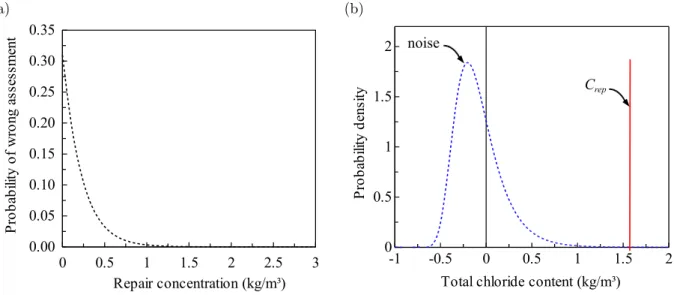
Given that the probability of wrong assessment is only influenced by the characteristics of the noise and the repair concentration –i.e., eq. 15, Figure 5a presents the influence of the repair concentration on PWA for µ⌘ = 0.2 kg/m3 and ⌘ = 0.2 kg/m3. Note that although PWA is sensitive to changes in Crep, their values are low (< 10 3) for C
rep varying between 0.8 and 2.4 kg/m3. The higher PWA correspond to small repair concentrations. This indicates that the area below the PDF of the noise after Crep(PWA) increases when Crep is reduced (Figure 5b). This behavior is expected because this inspection technique always underestimates the real chloride content. Then, the decisions are principally based on the probability of good assessment in this maintenance strategy.
4.2. Simulation of inspection, repair and corrosion initiation After inspection, there can be two decision outcomes:
1. to repair, in which case the structure/component returns to its initial state (this assumption is adopted herein but it can be changed without lack of generality of the method) or
2. to carry out no repair.
If no repair is decided, there is a remaining probability of corrosion initiation that increases when the chloride content is larger. When corrosion initiation occurs the structure/component is repaired or rebuilt to its initial state. These events are represented by probabilities that are calculated analytically and integrated in the Markov model. Therefore, there are two Markov matrices for modeling the whole process. The former is used to model corrosion initiation and repair between inspections Pbe. The latter represents inspection, repair and corrosion initiation at inspection times Pin.
Once both matrices have been formulated they are used to simulate chloride ingress, inspection, repair and corrosion initiation over time. Each state is assumed to have an initial population of defects. The number of defects in each state is then calculated on a yearly basis using the relevant transition matrix, and the number of defects in each state from the previous year. This section presents the methodology for determining Pbeand Pin.
The variable of interest (i.e., chloride concentration at the cover depth) is discretized into M states in the following formulation. Each state i is therefore characterized by a random variable di(X) which is assumed log-normally distributed.
4.2.1. Corrosion initiation between inspections
Chloride penetration into concrete produces corrosion initiation when no repair is carried out. The chloride concentration leading to corrosion initiation, Cth, is chosen in this work to compute the probability of corrosion initiation pini. By assuming that Cth is log-normally distributed, the probability of corrosion initiation between the inspection intervals for a state i can be estimated as:
pini,i= P(Cth(X) di(X) 0) = pdi Cth
⇠di+ ⇠Cth !
(16) where and ⇠ are the log-normal location and scale of Cthand di.
The transition probabilities ai,j in the complete Markov matrix for a year between inspections Pbet are computed in terms of those of the Markov growth matrix Pgr (estimated according to the methodology described in section 3) and the probability of corrosion initiation for the corresponding state as [34]:
abeti,j = 8 > > < > > : agri,j+ M X k=2
[agri,k pini,k] for j = 1
agri,j(1 pini,j) otherwise
(17)
where abet i,j and a
gr
4.2.2. Corrosion initiation and repair at inspection times
At an inspection year, the events of preventive repair R or corrosion initiation F can occur (i.e., R[ F ). Therefore, the probability of repair or corrosion initiation for a state i, pR[F,i, can be computed as follows: pR[F,i= Pi[Repair] + Pi[Corrosion initiation | No repair] (18) where:
Pi[Repair] = P[ ˆC Crep] (19)
Taking into account that inspections are imperfect and could lead to “repair” or “no repair” after corrosion initiation, it is assumed that the eventshCorrosion initiationi and hNo repairi are independent. Thus:
Pi[Corrosion initiation| No repair] = P[ ˆC < Crep]pini,i (20) On the other hand, the parameter i represents the probability that for the state i the actual chloride concentration is greater than the repair concentration:
i= P[di(X) Crep] (21)
The parameter i can be determined based on expert judgment. However, as mentioned previously, by assuming that di(X) is log-normally distributed, i is calculated analytically as:
i= ✓ di ln(Crep) ⇠di ◆ (22) The probability of repair can be written analytically in terms of i, PGAi and PWAi:
Pi[Repair] = PGAi i+ PWAi(1 i) (23)
Similarly, the probability of corrosion initiation given that no repair is carried out writes:
Pi[Corrosion initiation| No repair] = [(1 PGAi) i+ (1 PWAi)(1 i)]pini,i (24) These values are then used to calculate the transition probabilities in the complete Markov matrix for an inspection year Pin in terms of those of the Markov growth matrix Pgrand the probability of corrosion initiation for the corresponding state as [34]:
aini,j= 8 > > < > > : agri,j+ M X k=2 [agri,k pR[F,k] for j = 1 agri,j(1 pR[F,j) otherwise (25) where ain i,j and a gr
5. Cost analysis
Depending on both the kinematics of the deterioration process and the repair strategy, the number of defects in each state stabilizes after a given number of simulations [34]. These stabilized values are used to evaluate the cost of the maintenance strategy. This methodology distinguishes between three costs:
• the expected inspection cost, E[cI], • the expected repair cost, E[cR] and
• the expected corrosion initiation cost, E[cF].
The expected total cost of the maintenance strategy, E[cT], is then computed as:
E[cT] = E[cI] + E[cR] + E[cF] (26)
Although the aforementioned costs are agency (direct) costs, user costs can also be added to the analysis. According to Thoft-Christensen [37], in some cases, the consideration of user costs could be an influencing factor in management of deteriorating infrastructure. However, taking into account that no data is available to accurately quantify the user cost, it was decided to model only the agency costs. The development of accurate cost models for agency costs is beyond the scope of this study. Nonetheless, the cost parameters presented herein were defined on the basis of expert judgment of the operators of the port of Nantes-Saint-Nazaire in France.
For comparative purposes, the cost models described herein are computed on an annual basis. In other words, these costs indicate the annual expenditures of the agency to maintain a structure. Decision-making based on expected costs is widely used in the practice. However, Schoefs et al. [38] demonstrated that decision-making based on values di↵erent than the expected one (e.g., 5 or 95% quantiles) are more conve-nient in some cases where a representative value is hard to find. Although this point is not explored in this work, it is an important area for further research.
5.1. Annual inspection cost
The annual inspection cost should take into account all the stages of the inspection process: preparation of the access to the inspected area, extraction of concrete cores, laboratory tests, data analysis, etc. Therefore, for a particular problem, this cost could be considered as constant. The expected inspection cost is calculated by assuming that all structures/components are inspected. Then, the expected annual number of inspections nI is equal to the total number of components to inspect ntdivided by the length of the inspection interval
t:
E[nI] = nt
Thus, the expected annual inspection cost E[cI] is evaluated as a fraction of the initial cost of construction c0 as:
E[cI] = E[nI]c0kI (28)
where kI is a coefficient used to compute the inspection cost as a fraction of c0. 5.2. Annual repair cost
Repair costs depend on the maintenance strategy, deterioration mechanisms, labor costs, material costs, site setup costs etc. The proposed approach assumes that the structure is repaired before corrosion initiation (preventive maintenance). Therefore, the annual repair cost only involves the expenditures incurred in avoiding corrosion initiation by the owner. For example, in the studied maintenance strategy, this cost considers mainly the cost of rebuilding chloride-polluted concrete. The deterioration mechanism defines the expected number of repairs which is computed from the results of the Markov model. Then, these costs are defined as a function of the characteristics of the repair technique.
As mentioned before, repair is carried out when inspection indicates that chloride concentration is larger than the repair concentration. Therefore, the number of repairs nR depends on the probability of repair (eq. 23) and the stabilized number of structures/components in each state nd(i) [34]:
E[nR(i)] = nd(i)
t Pi[Repair] (29)
Thus the expected annual repair cost E[cR] becomes: E[cR] = c0kR
M X i=1
E[nR(i)] (30)
where kR is a coefficient used to compute the repair cost as a fraction of c0. It is observed from eq. 30 that the cost of repair is constant and only depends on the initial construction cost, c0 and the repair cost coefficient kR. When corrective maintenance is undertaken, repair costs depend mainly on the extent of damage. However, in the proposed approach the structure is repaired at a given damage threshold where the repair actions, and therefore the expected value of preventive repair costs, are known and can be considered as constant.
5.3. Annual corrosion initiation cost
The annual corrosion initiation cost is related to the overcharges of maintenance actions that should be carried out to ensure that the structure is repaired to its initial state when corrosion has started. For instance, replacement of corroded bars, removal of more chloride-polluted concrete, etc. Therefore, in the considered maintenance strategy, the annual corrosion initiation cost accounts for the overcharges incurred by corrective repair. The assessment of this cost depends on the number of components corroded between
inspections and at inspection times. The expected annual total cost of corrosion initiation E[cF] is then calculated by summing the expected cost of corrosion initiation between inspections E[cF 1] and the expected cost of corrosion initiation at inspection year E[cF 2]:
E[cF] = E[cF 1] + E[cF 2] (31)
According to eq. 16, there is a probability of corrosion initiation that depends on the actual chloride concentration for each state. Therefore, the expected number of corroded components in each state for a year between inspections, E[nF 1], is computed by multiplying the number of corroded components in each state i each time between inspections j, nf(i, j), by its corresponding probability of corrosion initiation. At each year between inspections, there will be a di↵erent number of corroded components in each state. Therefore, the expected number of corroded components in each state must be calculated and summed together (assuming that they are independent):
E[nF 1(i)] = pini(i) t
t 1 X j=1
nf(i, j) (32)
Then, the expected annual cost of corrosion initiation between inspections writes: E[cF 1] = c0kF
M X i=1
E[nF 1(i)] (33)
where kF is a coefficient used to compute the corrosion initiation cost as a fraction of c0.
When repairs are carried out at inspection times, the probability of corrosion initiation given no repair (eq. 24) is used to compute the expected number of corroded components, E[nF 2(i)]:
E[nF 2(i)] = nd(i)
t Pi[Corrosion initiation|No repair] (34)
where nd(i) is the number of structures/components in each state. Then the expected annual cost of corrosion initiation at inspection year becomes:
E[cF 2] = c0kF M X i=1 E[nF 2(i)] (35) 6. Illustrative example 6.1. Problem description
The objective of this example is to illustrate the proposed methodology studying the influence of the inspection interval on the expected annual maintenance costs of a corroding RC structure. It is supposed that this structure is composed by 100 structural components placed in an oceanic climate with temperature ranging from 5 to 25oC and with relative humidity between 0.6 and 0.8 for each year. The stochastic
climate model is described in [24]. The structural components are supposed to be in a splash and tidal zone characterized by a larger environmental chloride concentration and where chlorides ingress is accelerated by the variations in temperature and humidity [24]. The environmental chloride concentration for this zone is modeled as a stochastic process generated by independent numbers following a log-normal distribution (log-normal noise) with a mean of µCenv= 6 kg/m3and a coefficient of variation of 0.2 [24]. The considered random variables for chloride penetration are presented in Table 3. These random variables have been defined based on previous experimental and probabilistic studies [24, 39]. Table 3 includes chloride di↵usion coefficients for four materials. The first one corresponds to the original material which is supposed to be ordinary Portland concrete. The following three materials correspond to repair materials that are being tested in the framework of the MAREO project by accelerated and normal tests. The chloride di↵usion coefficients for these repair materials were defined based on preliminary results [40]. It is important to mention that although these coefficients are used to study the influence of the quality of the repair techniques, the conclusions concerning the repair techniques are not general.
Following the procedure presented in section 3, the Markov matrices of deterioration were obtained for the four materials (original and repair materials). To estimate these Markov matrices, the problem is discretized into M = 10 states varying from 0 to 4 kg/m3by steps of 0.4 kg/m3. The transition probabilities were obtained from 100,000 simulations for a concrete cover of 5 cm. The lengths of the initiation phase for all the materials are 15, 24, 31 and 10 years for the original material, wet shotcrete, dry shotcrete and formed concrete respectively. It is noted that, excepting formed concrete, the repair materials have initiation phases larger than the original material. This behavior is expected because according to the material specifications, these materials have lower chloride di↵usivity. Unfortunately, it was impossible to obtain the material composition to study in depth its influence on chloride di↵usivity.
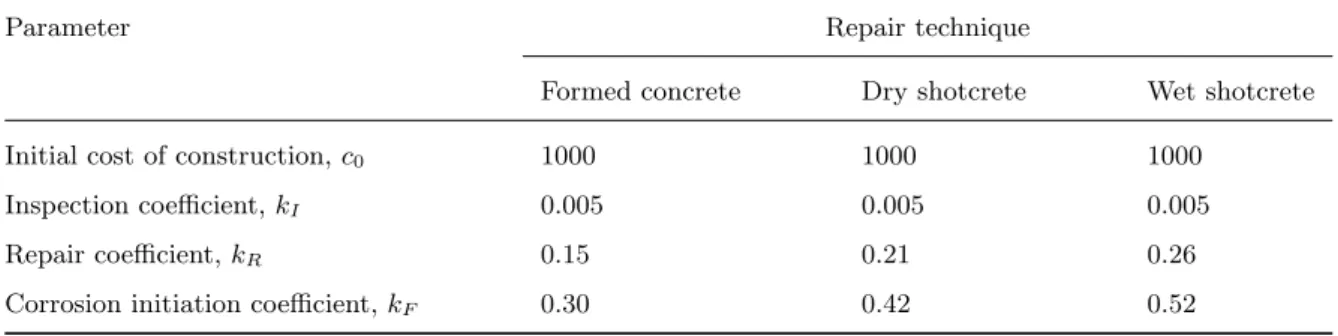
The determination of an optimal inspection interval is very sensitive to the cost models. Therefore, to obtain realistic results, the inspection, repair and corrosion initiation coefficients (i.e., kI, kR and kF) were defined by taking into account the average expenditures for these items incurred by the port of Nantes-Saint-Nazaire in France. These coefficients are presented in Table 4. Note that these costs coefficients are refereed to an initial construction cost of 1000 units per structural element. The coefficient of corrosion initiation is usually equal to or greater than 1 in engineering applications based on ultimate limit states. In such cases corrosion initiation implies a loss in the serviceability capacity and/or the replacement of the a↵ected component. However, for the adopted limit state, the coefficient given in Table 4 indicates that after corrosion initiation the overcharges are lower than the initial cost of construction.
6.2. Results
The first part of the results is devoted to study the influence of the length of the inspection interval on the total costs and its governing parameters. To simplify the study, it is assumed that the repair material
has the same characteristics as the construction material. Finally, the discussion focuses on the use of the proposed approach as a decision-making tool for the selection of a given repair technique (Section 6.2.5). 6.2.1. Total costs
The influence of the length of the inspection intervals on the expected annual cost is presented in Figure 6. This analysis considers that the repair concentration is Crep= 1.6 kg/m3which corresponds to the limit established in the French standard [35]. The total cost is composed of the costs of inspection, repair and corrosion initiation. It is observed that the costs of inspection and repair decrease and the cost of corrosion initiation increases for larger inspection intervals. This behavior is explained by the fact that when the inspection interval is greater, most part of inspections detect that the components are corroded. On the contrary, when the structure is inspected regularly, repair is preventive, and therefore, the cost of corrosion initiation decreases. By varying the length of the inspection interval, it can be concluded, in this case, that total costs are optimal when the structure is inspected every 7 years.
6.2.2. Repair concentration
Figure 7a shows the influence of the repair concentration Crep on the expected total costs. For compar-ative purposes, two values of Crep defined in the French [35] and Spanish [36] standards are also included –i.e., Crep = 1.6 and Crep = 2.4 kg/m3, respectively. The overall behavior indicates that total expected annual cost is sensitive to this parameter. For Crep< 1.6 kg/m3, the optimal inspection intervals decrease when Crep is larger. It is also noted that there is no minimum value when the repair limit is Crep = 2.4 kg/m3. This behavior indicates that costs could be optimized when C
repis defined for a particular problem. The assessment of an optimal Crepis presented in Figure 7b. The costs presented in this figure correspond to the optimal inspection interval and include the discrimination of costs in each case. The inspection costs increase when Crepis greater. This indicates that for larger values of Crepthere are more corrosion risks, and consequently, the structure should be inspected more periodically (Figure 7a). On the contrary, repair cost decreases and corrosion initiation cost increases for larger values of Crep. When the repair concentration increases there are more corrosion risks. Therefore, the components are repaired once they have failed increasing corrosion initiation costs. These results show that the optimal inspection interval should be determined for a value lower than the suggested in the standards –i.e., Crep= 1.2 kg/m3. In such a case, the optimal inspection interval is 10 years.
6.2.3. Corrosion initiation threshold
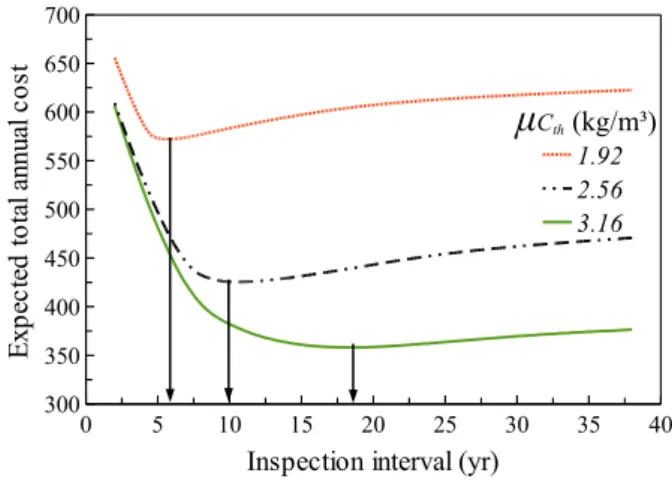
The e↵ect of the mean of the corrosion initiation threshold, Cth, on the total expected annual costs is presented in Figure 8. These values were obtained for a repair concentration of Crep = 1.2 kg/m3. The compared means were defined based on the values presented in Table 1. Then, Cth = 1.92 kg/m3 corresponds to the mean reported by [18] and Cth= 2.56 kg/m3and Cth= 3.16 kg/m3are the values found
by [16] for “in field” and “cracked immersed” cases, respectively. Taking into account that the standard deviation reported in [16] gathers information of several studies under di↵erent conditions, it is assumed in this example that for one single structure the variability is reduced. Therefore, all threshold chloride contents have the same coefficient of variation (i.e., COV[Cth]=0.20). As expected, the total expected annual cost decreases when the mean of Cth increases. This means that a higher chloride concentration is necessary to start the corrosion reaction, and then, the number of inspections, repairs and corroded components will be reduced. As mentioned in section 2.1, a comprehensive assessment of this parameter is crucial for an optimal management of structures.
It can be also noted in Figure 8 that there is a flat zone on the curve near the minimum when the mean of Cthincreases. Since Cth= 3.16 kg/m3 is more than twice Crep, the probability of corrosion initiation is very small reducing corrosion initiation costs. In that case, there is this flat zone where it is difficult to find an optimum value because inspection and repair costs govern total costs and decrease when the inspection interval is higher (Figure 6). Thus, it would be suitable to find an appropriate Crepthat will minimize costs for a given Cth.
6.2.4. Inspection quality
Figure 9 shows the influence of the quality of the inspection technique on the expected total annual costs. To simulate inspection quality, it is assumed that an improvement of the quality decreases the values of the parameters µ⌘ and ⌘. Then, Figure 9a shows that a decrease of µ⌘ and ⌘ reduces the scatter of the measurement leading to more precise results. It is noted from Figure 9b that the expected optimal total annual cost is lower when the quality of the inspection technique increases. Furthermore, it is observed that for the same problem the structure should be inspected every 11 years for high quality instead of 10 years for low quality. These results indicate that further research is required to improve the quality of the inspection techniques, and consequently, to reduce the total costs.
6.2.5. Use of the model for decision-making
This section compares the cost-efficiency of three repair techniques that can be implemented in the maintenance strategy: formed concrete, wet shotcrete and dry shotcrete. Figure 10 presents the expected total annual cost for the three repair techniques. The optimal inspection intervals for these techniques are 8, 10 and 13 years for formed concrete, wet shotcrete and dry shotcrete, respectively. Comparing the cost of the repair techniques, it is observed that the cost of dry shotcrete is about a half of the other techniques. This behavior is explained by the fact that the repair material used in this technique has the lowest chloride di↵usion coefficient (Table 3). Therefore, the largest inspections intervals correspond to this technique and the probability of corrosion initiation throughout time is lower and the costs of inspection, repair and corrosion initiation are reduced. From an economic point of view, it is concluded that dry shotcrete is the
more cost-efficient technique.
7. Conclusions
This paper focused on the improvement of a preventive maintenance strategy where repair is carried out before corrosion initiation. This strategy was developed after discussion with stakeholders that are confronted to this problem. The inspection technique measures the concentration of chlorides at the cover depth. Afterwards, based on the inspection results, the structure is repaired by replacing the polluted concrete with new material to ensure optimal levels of serviceability and safety during the structural lifetime. Given that Markov chains are more appropriate for modeling all the stages of the life-cycle (i.e., deterioration process, inspection, maintenance, failure), this paper proposed a methodology for determining the transition matrix from Monte Carlo simulations of a chloride penetration model. The Markovian approach included an initiation phase and several transition probabilities per state for improving the accuracy of the model. The inspection/maintenance strategy chosen is modeled using decision theory and Markov processes. This approach is convenient to take into account the “good” or “wrong” decisions resulting from imprecise inspection measurements as well as the uncertainties involved in the process. In addition this paper included data determined from experimental measurements or expert judgment to give more representative results. The proposed method was illustrated with an example. This example discussed the e↵ect of the main influencing parameters as well as an application of the model for decision-making when various repair techniques can be applied. The main findings of this work are summarized as follows:
• The proposed approach can be used to determine the inspection interval that minimizes the costs of inspection, repair and corrosion initiation for the studied maintenance strategy. However, this approach can be extended to other deterioration processes or materials where maintenance actions are based on imperfect inspection results.
• For corroding RC structures, it can be concluded that the repair concentration Crepshould be estimated for a particular problem taking mainly into account real costs, material properties and environmental actions. For instance, the value determined in the illustrative example was lower than the values suggested in the standards. However, these results could be di↵erent for other specific applications. • There are many factors influencing the assessment of the corrosion initiation threshold Cth.
There-fore, further research is required to determine this parameter as a function of the conditions of the surrounding environment as well as the characteristics of the concrete/repair material.
• The increase of the quality of inspection results is essential to reduce the uncertainty on the assessment of chloride content and therefore to reduce total costs Future work on this area should be addressed
to improve the quality of the existing techniques and/or to develop new inspections techniques based on non-destructive or semi-destructive principles.
References
[1] Kumar Mehta, P.. Durability – critical issues for the future. Concrete International 1997;19:27–33.
[2] Poupard, O., L’Hostis, V., Catinaud, S., Petre-Lazar, I.. Corrosion damage diagnosis of a reinforced concrete beam after 40 years natural exposure in marine environment. Cement and Concrete Research 2006;36:504–520.
[3] Bhide, S.. Material usage and condition of existing bridges in the U.S. Tech. Rep. SR342; Portland Cement Association; Skokie, Ill; 1999.
[4] Liu, M., Frangopol, D.M.. Optimal bridge maintenance planning based on probabilistic performance prediction. Engi-neering Structures 2004;26(7):991–1002.
[5] van Noortwijk, J., Frangopol, D.. Life-Cycle Performance of Deteriorating Structures: Assessment, Design and Man-agement; chap. Deterioration and maintenance models for insuring safety of civil infrastructures at lowest life-cycle cost. ASCE; 2004, p. 384–391.
[6] Wang, K., Zaniewski, J.. 20/30 hindsight: The new pavement optimization in the Arizona state highway network. Interfaces 1996;26:77–89.
[7] Thompson, P., Small, E., Johnson, M., Marshall, A.. The pontis bridge management system. Structural Engineering International IABSE 1998;8:303–308.
[8] Roelfstra, G., Hajdin, R., Adey, B., Br¨uhwiler, E.. Corrosion evolution in bridge management systems and corrosion-induced deterioration. Journal of Bridge Engineering ASCE 2004;9:268–277.
[9] Frangopol, D., Kong, J., Gharaibeh, E.. Reliability-based life-cycle management of highway bridges. Journal of Computing in Civil Engineering ASCE 2001;15:27–34.
[10] van Noortwijk, J., Frangopol, D.. Two probabilistic life-cycle maintenance models for deteriorating civil infrastructures. Probabilistic Engineering Mechanics 2004;19:345–359.
[11] Deloux, E., Castanier, B., B´erenguer, C.. Maintenance policy for deteriorating system evolving in a stressful environment. Journal of Risk and Reliability 2008;222:613–622.
[12] Schoefs, F., Cl´ement, A., Nouy, A.. Assessment of spatially dependent ROC curves for inspection of random fields of defects. Structural Safety 2009;31:409–419.
[13] Breysse, D., Yotte, S., Salta, M., Schoefs, F., Ricardo, J., Chaplain, M.. Accounting for variability and uncertainties in NDT condition assessment of corroded RC structures. European Journal of Environmental and Civil Engineering 2009;13:573–592.
[14] Schoefs, F., Aury, F., Vilvoisin, P., Menard, N., Bastidas-Arteaga, E.. Repair of wharves in tidal area: MAREO project. In: Structural Faults & Repair. Edinburgh, Scotland, UK; 2010,.
[15] Mullard, J., Stewart, M.. Stochastic assessment of timing and efficiency of maintenance of corroding RC structures. Journal of Structural Engineering ASCE 2009;135:887–895.
[16] Alonso, M., S´anchez, M.. Analysis of the variability of chloride threshold values in the literature. Materials and Corrosion 2009;60:631–637.
[17] Angst, U., Elsener, R., Larsen, C., Vennesland, O.. Critical chloride content in reinforced concrete – a review. Cement and Concrete Research 2009;39:1122–1138.
[18] Duracrete, . Statistical quantification of the variables in the limit state functions. Tech. Rep.; The European Union -Brite EuRam III - Contract BRPR-CT95-0132 - Project BE95-1347/R9; 2000.
[19] Alonso, C., Andrade, C., Castellote, M., Castro, P.. Chloride threshold values to depassivate reinforcing bars embedded in a standardized OPC mortar. Cement and Concrete Research 2000;30:1047–1055.
[20] Geocisa, , the Torroja Institute, . Contecvet: A validated users manual for assessing the residual service life of concrete structures. manual for assessing corrosion-a↵ected concrete structures. annex C calculation of a representative corrosion rate. Tech. Rep. EC Innovation Program IN309021; Geocisa and Torroja Institute; 2002.
[21] Cesare, M., Santamarina, C., Turkstra, C., Vanmarcke, E.. Modelling bridge deterioration with markov chains. Journal of Transportation Engineering, ASCE 1992;118:820–833.
[22] Scherer, W., Glangola, D.. Markovian models for bridge maintenance management. Journal of Transportation Engineering 1994;120:37–51.
[23] Ross, T.. Fuzzy Logic with Engineering Applications. Chinchester: Wiley; 2 ed.; 2004.
[24] Bastidas-Arteaga, E., Chateauneuf, A., S´anchez-Silva, M., Bressolette, P., Schoefs, F.. A comprehensive probabilistic model of chloride ingress in unsaturated concrete. Engineering Structures 2011;33:720–30.
[25] El Hassan, J., Bressolette, P., Chateauneuf, A., El Tawil, K.. Reliability-based assessment of the e↵ect of climatic conditions on the corrosion of RC structures subject to chloride ingress. Engineering Structures 2010;32(10):3279 – 3287. [26] Saetta, A., Scotta, R., Vitaliani, R.. Analysis of chloride di↵usion into partially saturated concrete. ACI Materials
Journal 1993;90(5):441–451.
[27] Bastidas-Arteaga, E., Schoefs, F.. Markovian approach for modeling of deterioration processes with an initiation phase. Computer-Aided Civil and Infrastructure Engineering 2011;Submitted for publication.
[28] Pappas, Y., Spanos, P., Kostopoulos, V.. Markov chains for accumulation of organic and ceramic composites. Journal of Engineering Mechanics 2001;127:915–926.
[29] Sheils, E.. Optimisation of inspection planning for structures. Ph.D. Thesis; University of Dublin, Trinity College; 2009. [30] Chaussadent, T., Arliguie, G.. AFREM test procedures concerning chlorides in concrete: extraction and titration
methods. Material and Structures 1999;32:230––234.
[31] RILEM TC 178-TMC, . Analysis of chloride content in concrete. Material and Structures 2002;35:583–585.
[32] Bonnet, S., Schoefs, F., Ricardo, J., Salta, M.. E↵ect of error measurements of chloride profiles on reliability assessment. In: Furuta, H., Frangopol, D., Shinozuka, M., editors. 10th International Conference on Structural Safety and Reliability. Osaka, Japan; 2009,.
[33] Rouhan, A., Schoefs, F.. Probabilistic modeling of inspection results for o↵shore structures. Structural Safety 2003;25:379– 399.
[34] Sheils, E., O’Connor, A., Breysse, D., Schoefs, F., Yotte, S.. Development of a two stage inspection process for the assessment of deteriorating infrastructure. Reliability Engineering and System Safety 2010;95:182–194.
[35] NF EN-206, . B´eton–partie 1 : Sp´ecification, performances, production et conformit´e. 2004. [36] EHE, . Instrucci´on espa˜nola del hormig´on estructural. 2008.
[37] Thoft-Christensen, P.. Life-cycle cost-benefit (LCCB) analysis of bridges from a user and social point of view. Structure and Infrastructure Engineering 2009;5:49–57.
[38] Schoefs, F., Aduriz, X., Bernard, O., Capra, B.. Comparison of additional costs for several replacement strategies of randomly ageing reinforced concrete pipes. Computer–Aided Civil and Infrastructure Engineering 2009;24:492–508. [39] Bastidas-Arteaga, E., Chateauneuf, A., S´anchez-Silva, M., Bressolette, P., Schoefs, F.. Influence of weather and global
warming in chloride ingress into concrete: A stochastic approach. Structural Safety 2010;32:238–249.
[40] Villain et al., . Protocoles de mesures non destructives et profils en chlorure – premiers r´esultats de marnage acc´el´er´e sur dalles en laboratoire. Tech. Rep.; projet FUI (2007-2010) MAREO; 2010. Number 9, version 1.
List of tables: Table 1. Total threshold chloride concentrations [16].
Table 2. Correspondence between Eq. 2 and the governing di↵erential equations. Table 3. Probabilistic models of the random variables.
Table 4. Coefficients for cost models.
List of figures:
Figure 1. Comparison between the probabilities computed from Monte Carlo simulations and Markov chains. Figure 2. Di↵erences between theoretical and measured chloride profiles for three specimens (with the values
reported by [32]).
Figure 3. Factors influencing PGA: (a) C and (b) Crep. Figure 4. Factors influencing PGA: (a) µ⌘ and (b) ⌘. Figure 5. (a) E↵ect of Crepon PWA. (b) PDF of noise.
Figure 6. E↵ect of the inspection interval on expected annual costs.
Figure 7. (a) Influence of Crep on total cost. (b) Assessment of an optimal Crep. Figure 8. Impact of the mean of Cth on the total expected annual costs.
Figure 9. Influence of the quality of the inspection technique on the total expected annual costs. Figure 10. Expected total annual cost for various repair materials.
Table 1: Total threshold chloride concentrations [16].
Exposure conditions Mean Standard dev.
% wt. cem. % wt. cem.
– Cracked-air : cracks > 0.4 mm and exposed to the air above the splash zone
0.15 (0.60 kg/m3) 0.06 (0.24 kg/m3)
– Cracked-immersed : cracks > 0.4 mm and immersed in seawater 0.79 (3.16 kg/m3) 0.39 (1.56 kg/m3)
– In field : it groups measurements for cracked, uncracked, im-mersed and non-imim-mersed conditions
0.64 (2.56 kg/m3) 0.61 (2.44 kg/m3)
Table 2: Correspondence between Eq. 2 and the governing di↵erential equations.
Physical problem ⇣ J J0
Chloride ingress Cf c 1 Dc⇤!rCf c Cf cDh⇤!rh
Moisture di↵usion h @we/@h Dh!rh 0
Heat transfer T ⇢ccq !rT 0
Table 3: Probabilistic models of the random variables.
Variable Mean COV Distribution
Dc,ref (original material) 3⇥ 10 11m2/s 0.20 log-normal
Dc,ref (formed concrete) 4.5⇥ 10 11 m2/s 0.20 log-normal
Dc,ref (wet shotcrete) 2.0⇥ 10 11 m2/s 0.20 log-normal
Dc,ref (dry shotcrete) 1.8⇥ 10 11 m2/s 0.10 log-normal
ct 50 mm 0.25 normala Uc 41.8 kJ/mol 0.10 beta on [32;44.6] m 0.15 0.30 beta on [0;1] Dh,ref 3⇥ 10 10m2/s 0.20 log-normal ↵0 0.05 0.20 beta on [0.025;0.1] n 11 0.10 beta on [6;16] 2.5 W/(m C) 0.20 beta on [1.4;3.6] ⇢c 2400 kg/m3 0.05 normal cq 1000 J/(kg C) 0.10 beta on [840;1170]
Table 4: Coefficients for cost models.
Parameter Repair technique
Formed concrete Dry shotcrete Wet shotcrete
Initial cost of construction, c0 1000 1000 1000
Inspection coefficient, kI 0.005 0.005 0.005
Repair coefficient, kR 0.15 0.21 0.26
0 2 4 6 8 10 12 14 16 18 20 0 1 2 3 4 5 6 Depth (mm) T ot al c hl or id e co nt en t ( kg /m ³) Theoretical S1 Measured S1 0 2 4 6 8 10 12 14 16 18 20 0 1 2 3 4 5 6 Depth (mm) T ot al c hl or id e co nt en t ( kg /m ³) Theoretical S2 Measured S2 0 2 4 6 8 10 12 14 16 18 20 0 1 2 3 4 5 6 Depth (mm) T ot al c hl or id e co nt en t ( kg /m ³) Theoretical S3 Measured S3
(a) (b) 0 0.5 1 1.5 2 2.5 3 3.5 4 0 0.2 0.4 0.6 0.8 1 0.01 0.10 0.30
Total chloride content (kg/m³)
P ro ba bi lit y of g oo d as se ss m en t σC (kg/m3) 0 0.5 1 1.5 2 2.5 3 3.5 4 0 0.2 0.4 0.6 0.8 1 0.8 1.6 2.4
Total chloride content (kg/m³)
P ro ba bi lit y of g oo d as se ss m en t Crep (kg/m3)


![Figure 2: Di↵erences between theoretical and measured chloride profiles for three specimens (with the values reported by [32]).](https://thumb-eu.123doks.com/thumbv2/123doknet/11473596.291928/30.892.113.800.506.726/figure-erences-theoretical-measured-chloride-profiles-specimens-reported.webp)