HAL Id: inserm-00188487
https://www.hal.inserm.fr/inserm-00188487
Submitted on 22 Nov 2007
HAL is a multi-disciplinary open access
archive for the deposit and dissemination of
sci-entific research documents, whether they are
pub-lished or not. The documents may come from
teaching and research institutions in France or
abroad, or from public or private research centers.
L’archive ouverte pluridisciplinaire HAL, est
destinée au dépôt et à la diffusion de documents
scientifiques de niveau recherche, publiés ou non,
émanant des établissements d’enseignement et de
recherche français ou étrangers, des laboratoires
publics ou privés.
A tissue-level model of the left ventricle for the analysis
of regional myocardial function.
Virginie Le Rolle, Alfredo Hernandez, Pierre-Yves Richard, Erwan Donal, Guy
Carrault
To cite this version:
Virginie Le Rolle, Alfredo Hernandez, Pierre-Yves Richard, Erwan Donal, Guy Carrault. A tissue-level
model of the left ventricle for the analysis of regional myocardial function.. Conference proceedings : ..
Annual International Conference of the IEEE Engineering in Medicine and Biology Society. IEEE
En-gineering in Medicine and Biology Society. Annual Conference, Institute of Electrical and Electronics
Engineers (IEEE), 2007, 1, pp.1172-1175. �10.1109/IEMBS.2007.4352505�. �inserm-00188487�
Abstract— This paper presents a model-based method for
the analysis of regional myocardial strain, based on echocardiography and Tissue Doppler Imaging (TDI). A multi-formalism, tissue-level electromechanical model of the left ventricle is proposed. The parameters of the model are identified in order to reproduce regional strain signal morphologies obtained from a healthy subject and a patient presenting a dilated cardiomyopathy. The parameters identified for the DCM patient allow the localization of the failing myocardial segments and may be useful for a better design of cardiac resynchronization therapy on heart failure patients.
I. INTRODUCTION
HE evaluation of regional cardiac function is one of the most important challenges in cardiology and can be particularly useful for the diagnosis and optimal therapy planning on patients suffering from heart failure and biventricular desynchronization. Recently, Tissue Doppler Imaging (TDI) has been proposed as a non-invasive tool to quantify regional ventricular deformations, by estimating a set of regional myocardial strain signals [1]. TDI has been compared with other imaging techniques, like MRI or sonomicrometry [2,3] and has shown accurate results, available in real-time, and reduced operational costs. This technique has shown, for example, its efficiency to differentiate healthy and ischemic myocardium [4,5]. Although the interpretation of strain signals can be straightforward in normal conditions, this is not usually the case on certain pathologies, because of the complexity of the mechanical function of the heart and the inter-patient variability. Some indicators, like the maximum local systolic velocity or the local delays between the electrical and peak mechanical activities, have already been proposed in the literature [5] in order to ease interpretation and diagnosis. However, a finer, joint analysis of the morphology of the different strain signals remains a difficult task.
This work presents a model-based approach for the joint analysis of myocardial strain signals of the left ventricle
V. Le Rolle A.I. Hernández, E. Donal, G. Carrault are with INSERM U642, Rennes, F35000, France and with Université de Rennes 1, LTSI, Rennes, F35000, France. (email: virginie.lerolle, alfredo.hernandez, guy.carrault @univ-rennes1.fr)
E. Donal is with INSERM U642, Rennes, F35000, France and with Université de Rennes 1, LTSI, Rennes, F35000, France and with CHU, department of cardiology Rennes, F-35000, France of Rennes (email : [email protected]
P.-Y. Richard is with Supelec-IETR, Rennes, France. (email: [email protected])
(LV) trying to exploit the information contained in the morphology of strain signals. A tissue-level model of the electrical and mechanical activities of the heart is proposed and its parameters are identified in order to reproduce a set of observed strain signals.
The strain acquisition using TDI is firstly described. Then, the ventricular model is presented before introducing the identification method and the results.
II. STRAIN ACQUISITION
Strain signals acquired from TDI echography represent a mechanical expression that quantifies the percentage deformation of a given myocardial segment with respect to their original end-diastole state [5]. Tissue extensions correspond to positive strains while tissue compressions result in negative strains.
TDI echographic measurements have been performed on a healthy subject and a patient affected by a dilated cardiomyopathy (DCM). This pathology is characterized by a heart enlargement and a blood pump alteration. In each case, strain signals for a whole cardiac cycle have been obtained on eight different regions of the myocardial wall, at the base level (septum, anterior, inferior and lateral walls) and the equatorial level (septum, anterior, inferior and lateral walls). A standard echocardiographic test was performed in order to determine the LV dimensions of each subject.
III. MODEL DESCRIPTION
A. Multi-formalism approach
Current electromechanical models of the cardiac function can be usually classified in two categories: microscopic and macroscopic ones. The macroscopic approach, which is illustrated in [8], [9], is not a relevant solution to study myocardial strain because regional behaviors are not taken into account. An alternative approach is to use microscopic models [10], [11] but the computational resources required by these models are significant, leading to a limited concrete clinical applicability.
The present study proposes a mesoscopic implementation of a ventricular model that describes the different energy domains involved in cardiac function (electrical, mechanical and hydraulic) at different spatial and temporal scales. Multiple formalisms are employed for the definition of the model. Concerning the mechano-hydraulic description, Bond Graphs appear as a good approach, since this formalism can be used for all energy domains [12]. Cellular Automata are used for the electrical activation and propagation [13], [14].
A tissue-level model of the left ventricle for the analysis of regional
myocardial function
Virginie Le Rolle, Alfredo I. Hernández, Pierre-Yves Richard, Erwan Donal and Guy Carrault
T
This material is presented to ensure timely dissemination of scholarly and technical work. Copyright and all rights therein are retained by authors or by other copyright holders.
All persons copying this information are expected to adhere to the terms and constraints invoked by each author's copyright. In most cases, these works may not be reposted without the explicit permission of the copyright holder.
HAL author manuscript inserm-00188487, version 1
HAL author manuscript
B. Model geometry and segmentation
As in previous works, an ellipsoidal geometry has been chosen to represent the morphology of the LV. The myocardial wall has been divided into 12 segments that correspond to the same resolution used for strain acquisition and analysis. The segmentation is composed of three layers at the basal, equatorial and apical levels [7]. Each layer is separated in 4 components corresponding to the septal, lateral, anterior and inferior walls (Fig. 1). Each wall segment interacts with the blood volume inside the intra-ventricular cavity
Fig. 1 Ventricular model segmentation
C. Electrical activation model
In order to describe the electrical activity, each one of the twelve segments is represented by a cellular automaton, characterized by four physiological states [13]: the rapid depolarization period (RDP), the absolute refractory period (ARP), the relative refractory period (RRP) and a waiting period (idle). State transition functions and interactions between cellular automata are fully described in [14]. The simulation of a heart beat is initiated by an external excitation (Ext) on the mid-septum segment.
Each automaton approximates the intracellular calcium concentration shape by a truncated sinus, characterized by its amplitude K and period T, and triggered at the end of the depolarization period. The value of T equals the duration of both refractory periods. The calcium concentration gets its maximum at the mechanical activity peak time
!
TMP.
D. Mechanical–hydraulic model 1) Mechanical description
The mechanical behavior is described here by the radial force (Fr) developed by each wall segment. The ventricular mechanical activity is classically represented by the contributions of active and passive properties. Active properties are related to force development and are controlled by the dynamics of intracellular calcium concentration; whereas passive ones are associated with the organization of the myocardium (fibers, collagen…). The radial force can be computed as the integrated stress over the segment’s surface. The total stress is equal to the sum of an active (
!
"
r _ a) and a passive stress (!
"
r _ p).!
Fr =
#
"
r.dS=#
("
r _ a+"
r _ p)dS (1) The active stress tensor can be expressed using the relation:!
"a = Ta.(FN ).(FN )T (2)
where F is the deformation gradient tensor, N stands for a unitary vector in the fiber direction and
!
T
a depends on the intracellular calcium concentration (!
[Ca2+]i), such that [6]:
! Ta= Tref [Ca 2+] i n [Ca2+]in+ Ca50n [1 + " (# $1)] (3)
where λ is the strain, Tref is the value of the tension at λ =
1,
!
Ca50 the calcium concentration at 50% of the isometric
tension, n is the Hill coefficient and β represents the myofilament “cooperativity”. The passive stress tensor can be expressed using the relation:
!
"p= # pI + 2F$W
$C F
T (4)
where W is the strain energy function, p stands for the hydrostatic pressure, I is the identity matrix and C is the Cauchy-Green tensor computed from F:
!
C = FTF . The
energy function used in this paper is the one defined by Humphrey et al. [15], which is a polynomial energy function.
W = c1.(α-1)²-c2.(α-1)³+c3(I1-3)+c4(I1-3)(α-1)+c5(I1-3)² (5) I1 and I4 stand for the invariants of the deformation
gradient tensor and
!
"= I 4 . The radial stress is obtained
from a well-known relation, called the Laplace Relation, that links the three stress components [16]:
!
"#r= (#$ % e) Rp+ (#&% e) Rm (6)
The parameter e is the wall thickness,
!
Rm and
!
Rp stand for
the radii of curvature in the meridian and parallel directions. By integrating the Laplace relation, the force developed by the wall segment is defined as:
!
Fr= " ((
'
#$ % e) Rp+ (#&% e) Rm)dS (7)where the radial and the azimuthal stress are equal to the sum of active and passive components. These mechanical relations provide the constitutive law of two capacitive elements suitable to model the segment.
2) Mechano-Hydraulic coupling
The mechano-hydraulic interaction between the myocardial wall and the blood inside the ventricular cavity is then characterized by the coupling relation:
!
P= " Fr S (8) where
!
P is the pressure at the wall surface,
!
Fr is the radial
force developed by the wall segment and S can be easily calculated since the surface is ellipsoidal. This mechanical-hydraulic conversion can be represented by a Bond Graph element called transformer.
3) Hydraulic description
The blood behavior inside the cardiac cavity has also been described. In fact, although the flow is supposed to remain the same in each cavity segment, the pressure varies from the wall surface to the cavity center. This variation is due to the blood viscosity and mass effects that bring respectively some resistive and inertial properties. In the Bond Graph formalism, the hydraulic blood activity is modeled by a resistance and an inertance (Fig. 2).
Fig. 2: Bond Graph model of each mechano-hydraulic segment.
Segments are connected in the hydraulic domain, as the total flow is the sum of the contribution of each segment at the center of each layer. This relation is translated in Bond Graph by a 0-junction (Fig. 3).
Fig. 3: Bond Graph model of the coupled myocardial segments and a simplified circulatory network.
IV. PATIENT-SPECIFIC MODELS
A. Method description
A model-based process is proposed to analyze strain morphology. The method consists in adapting the model parameters to experimental data and to interpret patient-specific parameters.
The length and diameter of the model’s ellipsoid are first adjusted to the observed dimensions of the patient’s heart, determined by echocardiography. The model parameters are identified in order to minimize a cost function defined as the squared error between the eight experimental and simulated strain signals. Evolutionary Algorithms (EA) have been chosen, mainly because of the absence of differentiability of the cost function with respect to the model’s parameters and the fact that this method is particularly adapted for complex identification problems. EA are stochastic search techniques, inspired on the theories of evolution and natural selection, which can be employed to find an optimal configuration for a given system within specific constraints [14],[17].
Each individual of the EA represents an instance of the whole model and is characterized by 28 parameters, to be identified: the duration of the depolarization period (RDP), the period T and amplitude K of calcium concentration for each automaton, and four values for hydraulic resistances on basal and equatorial layers (Fig. 2). The other parameters of the model are determined from the literature [6],[15].
B. Myocardial strain analysis
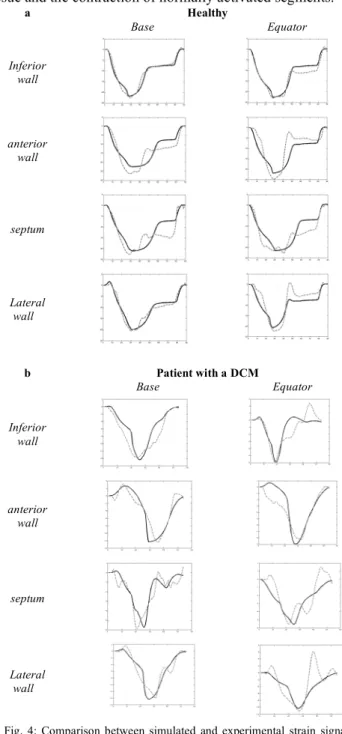
Fig. 4 shows the eight simulated and experimental longitudinal strain signals for each subject. The mean error value between simulations and real strain signals is respectively equal to 2.34% for the healthy subject and
1.30% for the DCM patient. For the healthy case, systolic peak times are synchronous, while electromechanical desynchronisations can be observed for the pathologic patient. Besides, the model simulations reproduce particular properties of this pathology. During the beginning of systole, the positive strain on some segments (e.g. basal anterior wall) can be explained by the extension of a yet inactivated tissue and the contraction of normally activated segments.
a Healthy Base Equator Inferior wall anterior wall septum Lateral wall b Patient with a DCM Base Equator Inferior wall anterior wall septum Lateral wall
Fig. 4: Comparison between simulated and experimental strain signals for a healthy subject (a) and a DCM patient (b) during one cardiac cycle. The black curve is the simulation and the dotted curve is the experimental data.
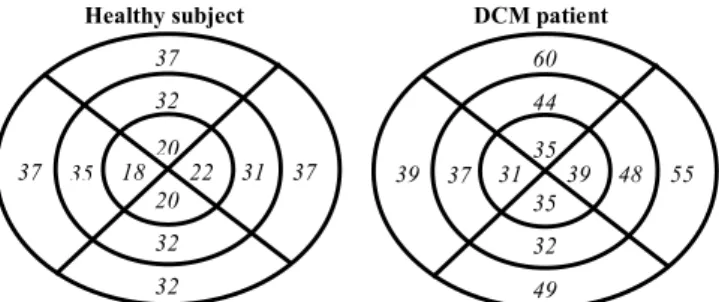
The identification process brings patient-specific parameters that can be useful to characterize their physiopathological state. Fig. 5 shows identified parameters
!
TMP, expressed as a percentage of the RR-interval (
!
TMP%),
for each segment, using a “Bull’s eye” representation.
Healthy subject DCM patient
Fig. 5: Bull’s eye representation of the identified
!
TMP expressed as a
percentage of the RR-interval for the 2 patients. For each Bull’s eye diagram, the left, top, right and down parts represent the septal, anterior free wall and posterior regions, respectively. The outer, mid- and inner rings represent the base, the equator and the apex of the LV.
The comparison of
!
TMP% for the two subjects shows
particularly high values for the basal anterior and lateral segments of 60 % and 55 %, respectively. These values can be used as a marker of myocardial dysfunction concerning these two segments.
C. Robustness analysis
In order to test the robustness of the identification method, the algorithm has been repeated ten times on the healthy patient data. The aim is to verify the reproducibility of the identified parameters. Fig. 6 shows a boxplot of the results obtained for
!
TMP, for each segment of the model. Although the identified parameters present slight dispersions, the global physiological interpretation of the identified parameters for the 10 different realizations of the identification process are the same.
Fig. 6: Boxplot of the ten identified
!
TMP for each analyzed segment.
V. CONCLUSION
This work presented a model-based approach for the analysis of myocardial strain morphology and evaluated its feasibility. A tissue-level model of the LV, based on a simplified geometry, has been proposed. This model shows reasonable simulation accuracy while keeping low computational costs, allowing parameter identification in order to estimate patient-specific models. Identification results have shown the similarities between model simulations and experimental strains, in particular during systole, and provide an interesting basis for the joint morphological analysis of these data. However, the description of the electromechanical coupling and the mechanical interaction between segments can explain the differences observed on strain simulation during the diastolic
phase. Improvements to our model are being carried out in this sense.
Although the robustness analysis has shown the viability of the
!
TMP identification, an evaluation of the sensibility and
specificity of this parameter should be realized on a greater number of subjects. Such an evaluation of the proposed model-based method should allow the development of new diagnosis applications on heart failure and planning assistance for cardiac resynchronization therapy.
REFERENCES
[1] A Heimdal, A Stoylen, H Torp, Skjaerpe “T. Real-time strain rate imaging of the left ventricle by ultrasound”. in J Am Soc Echocardio, 11, 1998, pp. 1013–1019.
[2] S. Urheim, T. Edvardsen, H. Torp, B. Angelsen, O.A. Smiseth “Myocardial Strain by Doppler Echography: Validation of a New Method to Quantify Regional Myocardial Function” in Circulation, 102, 2000, 1158-1164.
[3] T. Edvardsen, B.L. Gerber, J. Garot, et al “Quantitative Assessment of intrinsic Regional Myocardial Deformation by Doppler Strain Rate Echography in Humans: Validation Against Three-dimensional Tagged Magnetic Resonance Imaging” in Circulation, 106, 2002, pp. 50-56.
[4] T. Kukulski, F. Jamal, L. Herbots et al “Identification of Acutely Ischemic Myocardium Using Ultrasonic Strain Measurements A Clinical Study in Patients Undergoing Coronary Angioplasty” in
Journal of the American College of Cardiology, 41(5), 2003
[5] E. Donal, P. Raud-Raynier, D. Coisne et al “Tissue Doppler echographic quantification. Comparison to coronary angiography results in Acute Coronary Syndrome patients” in Cardiovascular
Ultrasound, 3:10, 2005
[6] M. Nash, “Mechanics and Material Properties of the Heart using an Anatomically Accurate Mathematical Model” PhD thesis, Auckland, 1998
[7] C.E. Suaide Silva, L.D. Cortez Ferreira, L. Braz Peixoto et al “Study of the myocardial contraction and relaxation velocities through Doppler tissue imaging echocardiography: A new alternative in the assessment of the segmental ventricular function” , In Arq Bras
Cardiol , 2002, 78(2): 200-11.
[8] M. Guarini, J. Urzua, A. Cipriano “Estimation of Cardiac Function from Computer Analysis of the Arterial Pressure Waveform” in IEEE
Transactions on Biomedical Engineering, 45, 1998, 1420-8.
[9] J.L. Palladino and A. Noordergraaf “A paradigm for quantifying ventricular contraction” in Cell. Mole. Biol., 7(2), 2002, pp. 331-335. [10] R.J. Vetter and A.D. McCulloch “Three-dimensional Stress and
Strain in Passive Rabbit Left Ventricle: A Model Study” in Annals of
Biomedical Engineering, 28, 2000, 781-792.
[11] RC Kerckhoffs, OP Faris, PH Bovendeerd, et al “Timing of depolarization and contraction in the paced canine left ventricle: model and experiment” in J Cardiovasc Electrophysiol. , 14(10 Suppl), 2003, pp. 188-95.
[12] Diaz-Zuccarini, V.A. “Etude des conditions d’efficacité du ventricule gauche par optimisation téléonomique d’un model de son fonctionnement” phd thesis, Lille, France, 2003.
[13] A. Bardou, P. Auger, P. Birkui and J. Chassé “Modeling of cardiac electrophysiological mechanisms: from action potential genesis to its propagation in myocardium” in Crit Rev Biomed Eng, 24 (issues 2-3), 1996, pp. 57-65
[14] A.I. Hernandez, G. Carrault, F. Mora and A. Bardou “Model-based interpretation of cardiac Beats by evolutionary algorthms: signal and model interaction” in Artif Intell Med, 26(3), 2002, pp. 211-35 [15] J.D. Humphrey, R.K. Strumpf and F.C.P. Yin “Determination of a
constitutive relation for passive myocardium: II. Parameter estimation” in J. Biomech., 112, 1990, 340-346.
[16] R. Comolet “Biomécanique circulatoire”, Paris, Masson, 1984 [17] D.E. Goldberg “Genetic Algorithms in Search, Optimization and
Machine Learning”. In Reading MA Addison Wesley, 1989
35 44 60 31 37 39 35 32 49 39 48 55 20 32 37 18 35 37 20 32 32 22 31 37