Part 2:
Global change, Ecosystems and Biodiversity
(SPSDII)
FINAL REPORT
BIOGEOCHEMICAL CYCLING OF CARBON, NITROGEN AND PHOSPHORUS IN THE NORTH SEA
CANOPY EV/20
Natacha Brion, Marc Elskens, Sandra De Galan, Cristina Diaconu and Willy Baeyens
ANCH - Vrije Universiteit Brussel
Lei Chou, Claar van der Zee, Nathalie Roevros
LOCGE – Université Libre de Bruxelles
Alberto V. Borges, Laure-Sophie Schiettecatte, Bruno Delille and Michel Frankignoulle - deceased 13 March 2005
Chemical Oceanography Unit, Université de Liège
Remy W. P. M. Laane
RIKZ (The Netherlands)
Tom van Engeland –
NIOO-CEME (The Netherlands)
D/2007/1191/47
Published in 2007 by the Belgian Science Policy Rue de la Science 8 Wetenschapsstraat 8 B-1000 Brussels Belgium Tel: +32 (0)2 238 34 11 – Fax: +32 (0)2 230 59 12 http://www.belspo.be Contact person: Mr David Cox Secretariat: +32 (0)2 238 36 13
Neither the Belgian Science Policy nor any person acting on behalf of the Belgian Science Policy is responsible for the use which might be made of the following information. The authors are responsible for the content.
No part of this publication may be reproduced, stored in a retrieval system, or transmitted in any form or by any means, electronic, mechanical, photocopying, recording, or otherwise, without indicating the reference.
TABLE OF CONTENTS
1. INTRODUCTION... 9
2. AIM OF THE PROJECT ... 11
3. METHODS... 13
3.1. CRUISES AND SAMPLING...13
3.2. CONCENTRATION MEASUREMENTS...13
3.2.1. Phosphorus speciation ... 13
3.2.2. Nitrogen speciation ... 14
3.2.3. Chlorophyll a... 14
3.2.4. Dissolved inorganic carbon and oxygen ... 15
3.3. PROCESS MEASUREMENTS... 16
3.3.1. Primary Production ... 16
3.3.2. Phosphate uptake... 16
3.3.3. Regeneration of PO4 by 3 5’ Nucleotidase activity... 17
3.3.4. Alkaline phosphatase activity... 17
3.3.5. Ammonium uptake, nitrate uptake and ammonium regeneration ... 18
3.4. USE OF EXISTING DATABASES FOR THE SPECIFIC STUDY OF N SPECIATION IN THE SBNS AND DUTCH COASTAL WATERS...19
4. RESULTS AND DISCUSSION ... 21
4.1. GENERAL TEMPERATURE AND SALINITY DISTRIBUTION IN THE SBNS...21
4.2. CHLOROPHYLL A...22
4.3. GENERAL NUTRIENTS (N AND P) DISTRIBUTION AND SPECIATION IN THE SBNS...23
4.3.1. Inorganic N and P: spatial and seasonal variations ... 23
4.3.2. Organic N and P speciation in the SBNS ... 27
4.3.3. DON distribution in the western coastal waters of the SBNS... 28
4.4. PROCESSES OF N, P AND C TRANSFORMATION...31
4.4.1. Primary production... 31
4.4.2. Inorganic N uptake and regeneration processes in the water column of the SBNS... 33
4.4.3. P processes ... 37
4.5. CO2 DYNAMICS AND AIR-SEA EXCHANGE...42
4.5.1. In the Scheldt Plume ... 42
4.5.2. In the SBNS... 46
4.6. NET ECOSYSTEM PRODUCTION (NEP)...51
4.6.1. In the Scheldt Plume ... 51
4.7. DIN AND DIP BUDGETS IN THE SBNS...58
4.7.1. River Plumes ... 58
4.7.2. Central SBNS ... 59
5. GENERAL DISCUSSION... 63
5.1. COUPLING BETWEEN N, C AND P DYNAMICS IN THE SBNS...63
5.1.1. Pelagic DIN uptake and primary production in the SBNS... 63
5.1.2. Whole Net Ecosystem DIN-DIC-DIP Dynamics... 63
5.2. PELAGIC VS WHOLE ECOSYSTEM C AND N DYNAMICS...65
6. CONCLUSIONS ... 67
7. AKNOWLEDGEMMENTS ... 69
ENGLISH SUMMARY
The CANOPY project aimed to determine the importance of the internal cycling processes of uptake and regeneration of carbon, nitrogen and phosphorus in the Southern Bight of the North Sea (SBNS), a marine area receiving riverine inputs from the Scheldt and Rhine rivers and influenced by inflowing English channel waters. The SBNS area was characterized by the presence of 2 large coastal river plumes with high levels of nutrients, and a central part with lower nutrient levels. Dissolved inorganic N (DIN and P (DIP) levels varied seasonally and were minimal for highest phytoplankton biomass, in spring and late summer. Additionally, organic N and P represented important fractions of the total N and P. In the central waters, dissolved organic N (DON), P (DOP) and particulate organic P (POP) dominated the N and P pools in summer, but their relative importance was more limited in the river plumes. For the pelagic system, DIC, DIN and DIP varied seasonally and were highest during the spring phytoplankton bloom, and for some stations, at the end of the summer phytoplankton bloom. Additionally, the uptake of DIN and primary production (PP) were well correlated with a C:N ratio of 6.5 very close to the Redfield ratio. In general, the regeneration of DIN largely exceeded the uptake except in spring, where a more balanced situation was observed. The regeneration of DIP also represented a large fraction of the DIP uptake. Heterotrophic processes are thus very active in the SBNS. They clearly dominate the pelagic N cycling, and are in balance with uptake processes for DIP. At ecosystem scale, it was demonstrated that the Scheldt plume was net heterotrophic during most years and acted as an important source of CO2 for
the atmosphere. In contrast, the Scheldt plume also acted as an active sink for both DIN and DIP probably due to active denitrification and physical adsorption processes in this organic matter and SPM rich environment. In contrast, the central waters were on the yearly average autotrophic and acted as a sink for CO2. Again in contrast,
there was a net production of DIN and DIP. The comparison of DIN and DIP budgets with DIC budgets showed that correlations exist but were not straightforward. In general, correlations showed a C:N ratio of 3.5 (<Redfield) and a C:P ratio of 109 (=Redfield). This suggests that whatever the season there is a DIC production sustained by OM with a high C:N ratio, either of terrestrial (estuarine) origin or from the sediment. This is agreement with the fact that consumption of DIC by PP exceeds the net ecosystem DIC production. The other possible cause is a large removal of DIN by denitrification in agreement with the fact that net pelagic DIN production largely exceeds net ecosystem DIN production. However, the correlation lines did not pass through 0 showing that primary production and respiration are not the only players in the DIC-DIN-DIP dynamics with the presence of unrelated DIC, DIN and DIP sources our sinks.
DUTCH SUMMARY
Het CANOPY project had als doel het belang aan te tonen van de interne cyclische processen van opname en regeneratie van C, N en P in de Zuidelijke Bocht van de Noordzee (SBNS). Dit zeegebied krijgt een enorme toevoer van rivierwater van de Schelde en de Rijn te verwerken en wordt beinvloed door water dat binnenkomt via het Engelse Kanaal. Het SBNS gebied werd gekenmerkt door de aanwezigheid van 2 grote rivierpluimen met hoge concentraties aan nutrienten en een centraal gedeelte met lagere hoeveelheden aan nutrienten. Opgeloste anorganische N (DIN) en P (DIP) hoeveelheden varieerden seizonaal en waren het laagst wanneer de phytoplankton biomassa het hoogst is, dwz. in de lente en de late zomer. Organische N en P vertegenwoordigden belangrijke fracties van de totale hoeveelheid N en P aanwezig. In het centrale gedeelte van het SBNS overheersten de hoeveelheden aan opgeloste organische N (DON) en P (DOP), en particulair organische P (POP) de N en P pools in de zomer, maar hun relatief belang was beperkter in de rivierpluimen. In het pelagische systeem varieerden DIC, DIN en DIP opnamen seasonaal en waren het hoogst tijdens de fytoplanktonbloei in de lente. Voor een aantal stations waren deze ook het hoogst tijdens de fytoplanktonbloei op het einde van de zomer. De opname van DIN en de primaire productie (PP) zijn zeer goed met elkaar gecorreleerd met een C:N verhouding van 6.5 (=Redfield). Over het algemeen overheerste de regeneratie van DIN zeer sterk de opname van DIN behalve in de lente, wanneer een goed evenwicht tussen beide werd waargenomen. De regeneratie van DIP vertegenwoordigde een belangrijke fractie van de opname van DIP. Men kan dus zeggen dat heterotrofe processen zeer actief zijn in de SBNS. Deze overheersten zeer duidelijk de pelagische N cyclus en waren in evenwicht met de opnameprocessen van DIP. Er werd aangetoond dat de Scheldepluim net heterotroof was gedurende het grootste gedeelte van het jaar en dat het een belangrijke bron van CO2 was voor de atmosfeer. In tegenstelling, de Scheldepluim
trad ook op als een actieve poel (sink) voor DIN en DIP hoogst waarschijnlijk door de actieve denitrificatie en fysische adsorptie processen die plaatsgrijpen in dit milieu rijk aan organisch materiaal en SPM. In tegenstelling, het centrale gedeelte was op jaarbasis autotroof en trad op als een poel voor CO2. Anderzijds werd vastgesteld dat
er hier een netto productie van DIN en DIP was. Een vergelijking van de DIN en DIP budgetten met deze van DIC toonden aan dat er een correlatie bestaat tussen beide. Over het algemeen toonden deze correlaties een C:N verhouding van 3.5 (<Redfield) en een C:P verhouding van 109 (=Redfield) aan. Dit veronderstelt dat er, onafgezien van het seizoen, een DIC productie is met een hoge C:N verhouding die in stand wordt gehouden door OM dat ofwel een terrestrische (estuarium) oorsprong heeft ofwel afkomstig is van de sedimenten. Dit is in overeenstemming met het feit dat het verbruik van DIC hoger is dan de netto DIC productie van het systeem. Een andere
mogelijke oorzaak is een zeer groot verbruik van DIN door denitrificatie wat in overeenstemming is met de netto pelagische DIN productie die de netto ecosysteem DIN productie in hoge mate overschrijdt. De correlatielijnen gaan echter niet door de oorsprong wat aantoont dat naast primaire productie en respiratie er nog andere processen een rol spelen in de DIC-DIN-DIP dynamiek. Bovendien zijn de bronnen en poelen van DIC, DIN, en DIP niet gekoppeld aan elkaar.
1. INTRODUCTION
The inputs of organic material and nutrients via rivers provide a significant contribution to the global marine carbon, nitrogen, phosphorus and silicon budgets (e.g., Sempéré et al., 2000; Beusen et al., 2005; Harrison et al., 2005). However, before this material reaches the open ocean, intense biogeochemical transformations take place in estuaries, delta’s and the open shelf (Siefert, 2004). As a result the quantity, origin and quality of the organic matter and nutrients that actually reach the open ocean may differ substantially from that delivered to upper estuaries. Biogeochemical processing may remove a significant fraction of the river nutrient load by e.g. nitrification-denitrification, or by uptake by phytoplankton and bacteria. Over the last century nitrogen and phosphorus discharges to the aquatic environment have increased dramatically due to human activities and population growth (Herbert 1999, Hulth et al. 2005) but it is believed that the situation should improve in Europe. The river N flux for example is likely to decrease by ~20 % over the coming 3 decades (Bouwman et al., 2005) in Europe. The important biogeochemical processes involved are, however, insufficiently quantified; causing global extrapolations to have a large uncertainty (e.g., for the CO2 budget see Borges, 2005 and Borges et al.,
2005; 2006). Many elementary data regarding the origin, fluxes and biogeochemical transformations of C, N, P and Si in coastal systems are simply lacking and extrapolations based on available data are not valid. Estimates of actual delivery to the coastal zone and of the high impact of human perturbations (Downing et al., 1999) remain speculative unless detailed insight in estuarine and open shelf biogeochemical processes is acquired. It is to this global perspective that the CANOPY research project is contributing.
Coastal ecosystems in industrialized densely populated areas, like the Southern Bight of the North Sea (SBNS), are subjected to increased organic matter (OM), dissolved inorganic carbon (DIC) and nutrient inputs via rivers, sewage and atmospheric deposition which may entail mass production of algae (i.e. eutrophication) which in turn, when decomposing, can result in oxygen depletion (hypoxia) or even anoxia, for the extreme cases. Sources, input trends and internal cycling processes of nutrients have been studied for many years in this system in the framework of large national (Belgian) and international projects. A large amount of information has been obtained but severe gaps and uncertainties are still prevailing, hampering our global understanding of the biogeochemistry of the system.
The Southern Bight of the North Sea (fig. 1) is a marine area receiving carbon and nutrients from river inputs (Rhine and Scheldt mainly), atmospheric deposition, and exchanges with the Atlantic Ocean through the English channel. Sources of nutrients and carbon are mostly linked to anthropogenic activities (agriculture, industries, domestic wastewater). The most recent Quality Status Report (OSPARCOM, 2000)
for the Greater North Sea highlighted very high inputs of nitrogen and phosphorus to the North Sea. These nutrients and carbon are subject to internal fluxes and processes like internal recycling of organic and inorganic compounds, uptake by phytoplankton, mineralization, atmospheric efflux, sedimentation, but recent average data for the North Sea dealing with these internal N, P and C recycling processes are rather scarce. In this project we study the relative importance of major processes involved in these cycles in order to be able to understand the global functioning of the concerned ecosystem.
Fig.1. Southern Bight of the North Sea with main water circulation (arrows) and position of the process stations.
The Southern Bight of the North Sea (fig. 1) corresponds to the southern part of the open North Sea located between the Strait of Dover and 52.5°N latitude line, as defined in OSPARCOM 2000. This 20,000 km² area is relatively shallow (20 to 30m) with a well mixed water column throughout the year. It is surrounded by the coastlines of South-Eastern England, The Netherlands, Belgium, and Northern France. Seawater flows from the English channel to the North through the central part of the area, western coastal waters flow southwards along the English coast until the Thames Bay before joining the main northward seawater flow, while eastern coastal waters flow northwards along the Dutch coast (OSPARCOM 2000). These eastern coastal waters receive the waters of two large rivers: the Scheldt (average discharge 100 m³s-1) and the Rhine-Maas (average discharge 1400 m³s-1), both draining densely populated and industrialized areas.
230
NS1 NS2
TB
2. AIM OF THE PROJECT
The general objective of this project is to determine the importance of the internal cycling processes of uptake and regeneration of carbon and nutrients (N and P) in the Southern Bight of the North Sea. These will be compared to the inputs and outputs of C-N-P in order to visualize the global functioning of the considered ecosystem. Moreover, the relative importance of the most important C-N-P compounds (organic/inorganic and dissolved/particulate) in these processes will be investigated.
More specifically, we will focus:
• On the in situ assessment of DIN, DIP and DIC uptake and regeneration rates using different tracer techniques (stable and radio-active isotopes.
• On whole ecosystem budgets for dissolved inorganic carbon, that should allow an estimation of Net Ecosystem Production (NEP) and provide air-sea CO2 exchange
budgets based on high temporal and spatial data sets.
• On whole ecosystem budgets for dissolved inorganic nitrogen and phosphorus, that should allow an estimation of the net filtering effect of the SBNS.
3. METHODS
3.1. CRUISES AND SAMPLING
Seven five-days cruises were carried out onboard the RV BELGICA between September 2003 and October 2004:
BG03-21: 1-5/09/2003 (end of summer) BG03-27: 27 to 31/10/2003 (autumn) BG03-32: 8-12/12/2003 (winter) BG04-03: 23 -27/02/2004 (late winter) BG04-07: 29/03-02/04/2004 (early spring) BG04-12: 24-28/05/2004 (spring) BG04-22: 04-08/10/2004 (autumn)
Water samples were taken at 5 fixed stations (Tab. 1 and Fig. 1) at a depth of 2 m using a 30L Go-Flo bottle for concentrations (see 3.2) and process measurements (see 3.3). At the same stations vertical profiles of temperature, salinity and light intensity were recorded with a Seacat SCTD SBE19 system.
Additionally, surface waters samples were collected along the ship track with a frequency of 1 minute (for pCO2 and O2 determinations) to half-an-hour (for dissolved
inorganic nitrogen and phosphate, and total alkalinity determinations) from the surface seawater supply of the ship (pump inlet at a depth of 2.5 m). Salinity and temperature corresponding to these samples were measured using a SeaBird£ SBE21 thermosalinograph. For each of the cruises, the track was chosen in order to obtain the best surface coverage.
Table 1. Coordinates of the fixed stations
Station Longitude (°W) Latirude (°N) St230 NS1 NS2 TB CH2 2°50 3°30 2°20 1°27.5 1°15 51°20 52°29 52°09 51°31 50°55 3.2. CONCENTRATION MEASUREMENTS 3.2.1. Phosphorus speciation
Dissolved phosphorus species were determined after filtration through pre-combusted (500ºC, 4 h) GF/F filters, which were used for the particulate phosphorus speciation. Soluble reactive phosphorus, hereafter phosphate (PO4), was measured
according to the method of Grasshoff et al. (1983). Dissolved inorganic phosphorus (DIP) was determined as PO4 after digestion with 9N H2SO4 (120ºC, 30 min). DIP
comprises PO4 and polyphosphates (poly-PO4), although hydrolysis of acid-labile
organic phosphorus compounds may also contribute to this parameter. Poly-PO4 was
determined as the difference between DIP and PO4. Total dissolved phosphorus
(TDP) was measured by wet oxidation in acid persulphate (120ºC, 30 min) (Grasshoff et al., 1983). Dissolved organic phosphorus (DOP) was subsequently calculated as the difference between TDP and DIP. Filters for total particulate phosphorus (TPP) determination were combusted at 500oC for 1.5 h with MgSO4 and subsequently
extracted in 1 N HCl for 24 h (Solorzano and Sharp, 1980). Filters for particulate inorganic phosphorus (PIP) were extracted in 1 N HCl for 24 h. Particulate organic phosphorus (POP) was calculated as the difference between TPP and PIP. Additionally, the unfiltered water sample was digested by wet oxidation in acid persulphate, which gives the total phosphorus (TP).
3.2.2. Nitrogen speciation
Ammonium, nitrate, and nitrite were determined after filtration through pre-combusted (500ºC, 4 h) GF/F filters with colorimetric methods. Ammonium is measured with the indophenol blue technique according to Koroleff (1969). Nitrate and nitrite are determined in acid preserved samples with a Technicon auto analyzer II system according to Elskens and Elskens (1989). Particulate matter is collected by filtration on pre-combusted (500ºC, 4 h) GF/F filters. The filters were dried for 8h at 50°C and particulate organic nitrogen (PN) was determined with a Carlo Erba C/N analyzer (Pella, 1991). The dissolved organic nitrogen (DON) assessment relies on the combination of a total dissolved nitrogen (TDN) and an independent dissolved inorganic nitrogen (DIN = nitrate + nitrite + ammonium) determination. TDN is determined as nitrate after peroxodisulphate oxidation of the dissolved nitrogen compounds (originally described by Valderama, 1981) in a microwave oven (Dafner et al., 1999).
3.2.3. Chlorophyll a
Chl a was measured on GF/F filters after filtration of 250-ml seawater under low suction, following the fluorometric method of Yentsch & Menzel (1963). For analysis, the filters were extracted with 90% acetone at -20°C for 24 h. Samples were centrifuged (10 min, 5500 rpm) and the fluorescence of the extract was measured with a Shimadzu RF-150 fluorometer, using an excitation wavelength of 430 nm and an emission wavelength of 663 nm. The fluorescence was calibrated with a stock solution of pure chlorophyll a (Merck).
3.2.4. Dissolved inorganic carbon and oxygen
Underway parameters (salinity, temperature and partial pressure of CO2 (pCO2))
were sampled with a 1 minute frequency from the surface seawater supply of the ship (pump inlet at a depth of 2.5 m). Salinity and temperature were measured using a SeaBird£ SBE21 thermosalinograph. pCO2 was measured by means of a
non-dispersive infrared gas analyzer (IRGA, Li-Cor£, Li-6262) and an equilibrator (Frankignoulle et al. 2001). The IRGA was calibrated daily using pure nitrogen (Air Liquide Belgium) and two gas mixtures of a CO2 molar fraction of 366 and 810 ppm
(Air Liquide Belgium), calibrated against two National Oceanic and Atmospheric Administration (NOAA) standards with a CO2 molar fraction of 361 and 774 ppm. The
temperature at the outlet of the equilibrator was monitored with a platinum resistance thermometer (PT100, METROHM£), with an estimated accuracy of ±0.05°C. The pCO2 values were corrected for the temperature difference between in-situ seawater
and water in the equilibrator using the algorithm proposed by Copin-Montégut (1988; 1989) and then corrected to the local barometric pressure. The accuracy of the pCO2
measurement by equilibration was estimated to ±2 µatm (cumulated errors on temperature correction and instrument calibration). Oxygen (O2) concentrations were
measured with a 1 min frequency using a galvanic electrode calibrated daily against discrete samples measured using the Winkler method. The oxygen saturation level (%O2) was computed from the observed concentration of dissolved O2 and the
concentration of O2 at saturation calculated according to Benson and Krause (1984).
The accuracy of O2 measurements was ± 0.5 µmol kg-1 (0.2% of level of saturation).
Total alkalinity (TA) discrete surface samples were measured with the Gran electrotitration method. The accuracy of TA measurements was ± 3 µmol kg-1. Dissolved inorganic carbon (DIC) was computed from pCO2 and TA measurements
using carbonic acid constants given by Roy et al. (1993), dissociation constants of boric acid given by Dickson (1990) and the CO2 solubility coefficient (α) given by
Weiss (1974). The accuracy on DIC computed from TA and pCO2 was ± 5 µmol kg-1
(estimated from cumulated errors on TA and pCO2).
The air-sea CO2 flux (FCO2) was computed from the pCO2 air-sea gradient (∆pCO2 =
pCO2 - pCO2atm, where pCO2atm refers to values in the atmosphere), α, and the gas
transfer velocity (k) according to:
FCO2 = α k ∆pCO2 (1)
We used nominally the k parameterization as function of wind speed (u10) given by
Nightingale et al. (2000), established in the North Sea. For comparative purposes with previous studies, computations were also carried out with the k parameterizations as function of wind speed given by Liss and Merlivat (1986), Wanninkhof (1992), and Wanninkhof and McGillis (1999).
3.3. PROCESS MEASUREMENTS 3.3.1. Primary Production
Dissolved inorganic carbon (DIC) uptake was essayed by incubation of 14 C-bicarbonate spiked seawater. During kinetic experiments, seawater was incubated under constant light conditions (~150 µmol quanta m-2 s-1) for 2, 4, 8, 12 and 24 hrs. Additional incubations were done using inhibitors. Photosystem II was blocked with 3-(3,4-dichlorophenyl)-1,1-dimethylurea (DCMU) using a final concentration of 24 µM, thus preventing photosynthetic DI14C uptake. The metabolic inhibitor sodium azide was used to stop all biological activity (46 µM, final concentration). Incubations were stopped by filtration on Whatman GF/F-filters. Filters were acidified with HCl, dried and stored until counting in the home laboratory. Radioactivity on the filters and in the standards was counted in a liquid scintillation counter using ReadySafe as scintillation cocktail.
Production versus irradiation curves were obtained by incubation of 14 aliquots with under a light gradient and in the dark for 2-4 hours. The Chl a normalized DIC uptake rate versus light intensity can be described with the Platt equation (Platt et al., 1980): PB =PmaxB (1−e−
α
E/PmaxB )e−β
E/PmaxB (2) where PB is the photosynthetic rate in µg C (µg Chl a)-1 h-1, PBmax is the maximumphotosynthetic rate in the same units as PB, α the maximum light utilization coefficient in µg C (µg Chl a)-1 h-1 (µmol quanta m-2 s-1)-1, β the photoinhibition parameter in the same units as α, and E the photosynthetically available radiation (PAR) in µmol quanta m-2 s-1.
The depth integrated primary production was calculated using the photosynthetic parameters obtained from the P-E curve fit, the Chl a concentration and the light availability at each depth. The incident light and day length were derived theoretically from the geographical position of the station and the date of sampling. The attenuation coefficient was deduced from the in situ measured light profile. The photoinhibition term of the Platt equation was not included in the fit of the P-E curves as this process was not of any importance during the incubations.
3.3.2. Phosphate uptake
Seawater samples were spiked in triplicate with 33PO4. PO4 uptake was measured in
a kinetic experiment under constant light conditions in September and October 2003 and in March and October 2004. Uptake of PO4 was determined in different size
fractions: 0.2-2 µm, 2-12 µm and >12 µm. Incubations with antibiotics, azide and DCMU were performed like in the carbon uptake experiments. The fraction of P
uptake due to abiotic processes such as passive adsorption is estimated by incubation amended with azide. Biological PO4 uptake is the total PO4 uptake minus
the PO4 uptake after addition of azide. Incubations with the addition of DCMU give an
estimate of the importance of photosynthetic versus non-photosynthetic rates of assimilation. Additionally, the 33PO4 assimilation in the dark was determined. The
contribution of heterotrophic bacteria to the P uptake was investigated by experiments using antibiotics. A mixture of the antibiotics streptomycine and polymyxine B (0.01% final concentration) was added to inhibit bacterial activity. Streptomycine is an inhibitor of prokaryotic protein synthesis, whereas polymyxine B kills gram-negative bacteria through the disruption of their cell-membrane. Incubations were stopped by filtration on nuclepore membrane filters, which were rinsed with filtered seawater containing 5 µM PO4 and filtered seawater. The
standards and the dried filters were counted in a liquid scintillation counter using ReadySafe as a scintillation cocktail.
3.3.3. Regeneration of PO4 by 3 5’ Nucleotidase activity
Regeneration of PO4 was assessed using the 5’-nucleotidase (5PN) method of
Ammerman (1993). Enzymatic liberation of 32PO4 from [Ȗ-32P]ATP and its subsequent
uptake was assayed in triplicate at in situ temperature in the light. Four fractions were incubated with [Ȗ-32P]ATP for 2-4 hours: seawater pre-filtered on 0.2 µm and 2 µm nuclepore filters, unfiltered seawater and formaline-killed seawater. The spiked samples were filtered on 0.2 µm nuclepore filters, the filters were rinsed with filtered seawater and the 32P on the filters was counted (total particulate 32P). The filtrate was subsampled for 32P counting (total dissolved 32P) and activated charcoal and sulphuric acid were added to the remainder of the filtrate. This slurry was filtered on Millipore HA filters (0.45 µm) and 32P was counted in the filtrate (32PO4).
Subsequently, the 5PN activity can be calculated and the percent of 32PO4 taken up
after liberation due to the hydrolysis of 32P-ATP by 5PN.
The 5PN activity in the dissolved fraction was subtracted from the activity in the <2 µm and the activity in the <2 µm fraction was subtracted from the total activity to obtain the 5PN activities in the small particulate fraction (0.2-2 µm) and the large particulate fraction (>2 µm), respectively. The same was done for the 32PO4 uptake in
the two particulate fractions. Dried filters, filtrate aliquots and standards were counted in a liquid scintillation counter using ReadySafe as a scintillation cocktail.
3.3.4. Alkaline phosphatase activity
The alkaline phosphatase (AP) activity assay was performed using 4-methylumbelliferyl-phosphate (MUF-PO4) as the fluorogenic substrate according to
Hoppe (1983). Seawater samples were incubated with MUF-PO4 in the dark at in situ
temperature. Time zero control samples were taken for all concentrations added at each station and season, as the extent of the spontaneous non-enzymatic hydrolysis of the MUF-P substrate increases with the amount substrate concentration added and the ratio between the two varies from site to site (Sebastian and Niell, 2004). The evolution of the fluorescent product MUF was followed in kinetic assays performed in triplicate after 0, 1, 2 and 4 hours. AP activity was calculated by linear regression from the first three kinetic points. When not immediately measured on board, the samples were preserved with HgCl2 (4mM final concentration) and stored frozen until
analysis in the laboratory (Christian and Karl, 1995). Furthermore, seawater samples, pre-filtered on 0.2 µm, 2 µm and 12 µm nuclepore filters, were incubated with MUF-PO4 at stations 230 and NS1. During the May and October 2004 cruises, kinetic
parameters were determined (Vmax and Km+Sn) and fluorescence was measured
directly onboard using a Shimadzu fluorometer.
The turnover time Ta of substrate in the incubation bottle was computed using
equation 3 following Thingstad et al. (1993):
(
R)
t Ta − − = 1 ln (3) where Ta = (Sa+Sn)/V is the turnover time in the sample with added and naturalsubstrate concentration Sa and Sn respectively; V is the velocity of the reaction; t is
the incubation time; R is the consumed fraction of the added MUF-PO4. Then,
following Wright and Hobbie (1966), the Michaelis-Menten equation can be rearranged to: max max V S V S K Ta = m + n + a (4) where Vmax is the maximum enzyme activity (in nM h-1), and Km is the value of S for
which V is half of Vmax. Km and Vmax were estimated from a modified Lineweaver-Burk
plot.
3.3.5. Ammonium uptake, nitrate uptake and ammonium regeneration
Isotope dilution and enrichment incubation experiments were performed using 15N labeled dissolved inorganic nitrogen (DIN = NH4+ or NO3-). Incubations were done for
250 ml samples in transparent plastic polycarbonate bottles submerged in an incubator with continuously flowing water to ensure ambient temperature and with constant artificial light intensities (~150 µmol quanta m-2 s-1). Samples are spiked with
15
N-NH4+ or 15N-NO3- (around 10 % final 15N abundance), incubated for 6 hours, and
filtered on combusted GF/F glass-fiber filters (Whatman). The filters are dried at 50°C for 8 hours prior to analysis of PON and 15N-PON abundance. The filtrates are used to determine final NH4+ and NO3- concentration and for the samples incubated with
15
NH4+ for 6 hours, additionally the filtrate is kept frozen until analysis of final 15
N-NH4+ abundance (Diaconu et al. 2005). In all cases, 15N abundances and PON
concentrations are measured using an elemental analyzer (Carlo-Erba C/N analyzer) coupled via a conflo-interface to an isotope ratio mass spectrometer (Finnigan Delta-Plus XL) (Nieuwenhuize et al. 1994).
Initial and final 15N-abundance and concentration data for the NH4+, NO3- and PON
pools obtained from the 3 incubation experiments were used simultaneously in an isotopic mass-balance model in order to compute NH4+ and NO3- uptake rates, and
ammonification rates. The model is a 3 compartment open model allowing the assessment of exchange rates between the considered compartments: NH4+, NO3
-and PON. This model assumes that exchange between compartments is governed by first order differential equations with constant coefficients of the general type: p n n p p i ji j ij i j i j i d X k X k X dt ≠ ≠ =
¦
⋅ −¦
⋅ (5) where Xi is the nitrogen concentration of isotope p (14N or 15N) within compartment iat time t, kij is the rate constant for exchange from compartment i to compartment j (in
reciprocal time units), p is the isotope 15N or 14N and n represents the number of compartments (3 in this case: NH4+, NO3- and PON).
The equation above states that the net content in any compartment i equals the sum of all inflows from the other compartments minus the sum of all outflows towards the other compartments. These mass balance differential equations have been solved numerically as described in Elskens et al. (1988). Values for the rate constants are obtained using weighted least squares techniques as described in Elskens et al. (2005). Rates for initial conditions are then obtained by multiplying rate constants with the in-situ concentrations of NH4+ or NO3-.
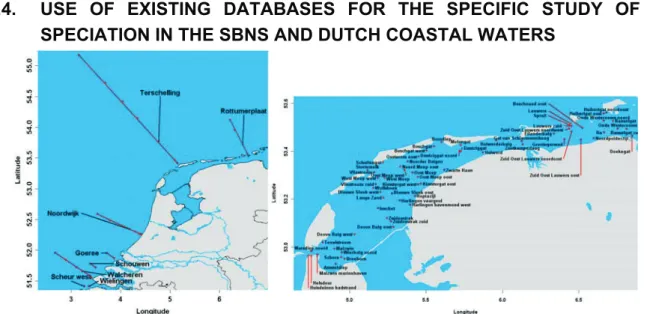
3.4. USE OF EXISTING DATABASES FOR THE SPECIFIC STUDY OF N
SPECIATION IN THE SBNS AND DUTCH COASTAL WATERS
Fig. 2. Map of the Dutch coastal zone and Wadden Sea with sampling locations (Ɣ) at different
Dissolved organic nitrogen data, together with the other nitrogen compounds (total nitrogen, dissolved nitrogen, particulate nitrogen, nitrate, nitrite a and ammonium) and associated parameters (e.g. salinity, suspended matter, dissolved and particulate organic carbon, phosphorus compounds and chlorophyll) have been used from the CANOPY database and combined with other available data from the North Sea and associated estuaries and rivers. The main data source was the DONAR database (35 years of data), managed by Rijkswaterstaat (www.waterbase.nl). This dataset was compared with measurement data from the database of the NIOO-CEME institute in Yerseke (The Netherlands) to assess the data quality and exclude artefacts due to changes in measurement techniques, human error, etc. Stations included in the DONAR data base are presented in figure 2.
Statistical analysis were performed with Statistica 7.0 (Statsoft) and R (R Development Core Team, 2006). Geographical illustrations were produced with GRASS 6.0 (Grass Development Team, 2006) and the maptools library of R (Lewin-Koh et al., 2005). Regression calculations were performed according to Venables & Ripley (2003), Koenker (2006) and Pinheiro et al. (2006).
Different water systems were distinguished to analyse the data: the Dutch Continental Shelf (further subdivided in a coastal zone and the open sea, the Wadden Sea, Haringvliet and the rivers Maas, Lek, Waal and IJssel. No long-term time series of DON were available for the rivers.
4. RESULTS AND DISCUSSION
4.1. GENERAL TEMPERATURE AND SALINITY DISTRIBUTION IN THE SBNS
0.5 1 1.5 2 2.5 3 3.5 4 4.5 50.5 51 51.5 52 52.5 September 2003 0.5 1 1.5 2 2.5 3 3.5 4 4.5 50.5 51 51.5 52 52.5 October 2003 0.5 1 1.5 2 2.5 3 3.5 4 4.5 50.5 51 51.5 52 52.5 December 2003 0.5 1 1.5 2 2.5 3 3.5 4 4.5 50.5 51 51.5 52 52.5 February 2004 0.5 1 1.5 2 2.5 3 3.5 4 4.5 50.5 51 51.5 52 52.5 March-April 2004 0.5 1 1.5 2 2.5 3 3.5 4 4.5 50.5 51 51.5 52 52.5 May 2004 11 13.5 16 18.5 21 23.5 26 28.5 31 33.5 36
Fig. 3: Surface maps of salinity (PSU) during the 6 cruises (September 2003-May 2004) in the SBNS. Dots represent the sampling positions. Isolines correspond to salinity 34 (PSU). The isolines were computed after interpolation with the Krigging method using the SURFER software (Golden-Software).
Water temperature was homogenous over the whole water column and the averages for the 7 cruises were 19, 13, 10, 6.5, 7, 12, and 16°C for September 2003, October 2003, December 2003, February 2004, March 2004, May 2004 and October 2004, respectively.
The surface salinity distribution in the SBNS (Fig. 3) shows the presence of the river plumes of the Scheldt and Rhine (between 16.0 and 34.0 PSU) along the western coast extending until the northern boundary of the studied area. The plume of the Thames covered only a limited portion of the studied area and was only discernable close to the Thames river mouth (May 2004). The central part was rather homogeneous in its surface salinity distribution, with salinities ranging from 34.5 to 35.1 PSU.
4.2. CHLOROPHYLL A #230 0 5 10 15
01-Aug-03 01-Dec-03 01-Apr-04 01-Aug-04 01-Dec-04
C h l-a ( µ g /l) 2m ~13-17m NS1 0 5 10 15
01-Aug-03 01-Dec-03 01-Apr-04 01-Aug-04 01-Dec-04
C h l-a ( µ g /l) 2m ~15m ~30m NS2 0 5 10 15
01-Aug-03 01-Dec-03 01-Apr-04 01-Aug-04 01-Dec-04
C h l-a ( µ g /l) 2m ~25m ~50m TB 0 5 10 15
01-Aug-03 01-Dec-03 01-Apr-04 01-Aug-04 01-Dec-04
C h l-a ( µ g /l) 2m ~13-17m CH2 0 5 10 15
01-Aug-03 01-Dec-03 01-Apr-04 01-Aug-04 01-Dec-04
C h l-a ( µ g /l) 2m ~16-20m ~31-37m
Figure 4. Seasonal trend in the chlorophyll a concentrations at different water depths at the fixed stations 230, NS1, NS2, TB and CH2.
The same seasonal distribution in chlorophyll a concentration (Fig. 4) was observed at the stations NS2, TB and CH2: a decrease between September and December 2003, low values in winter and a peak concentration in late May 2004. This pattern shows the spring bloom in May and the presence of phytoplankton in late summer / autumn. At station NS1, we have probably missed the spring bloom; the maximal chlorophyll a value in March was relatively small and malformed Phaeocystis colonies were observed in late May. We additionally visited stations 230 and CH2 in late April/early May. The chlorophyll a data showed higher concentrations during this cruise. The chlorophyll a concentrations were very similar at different water depths, except at station 230 in March 2004, indicating a usually well-mixed water column.
4.3. GENERAL NUTRIENTS (N AND P) DISTRIBUTION AND SPECIATION IN THE SBNS
4.3.1. Inorganic N and P: spatial and seasonal variations
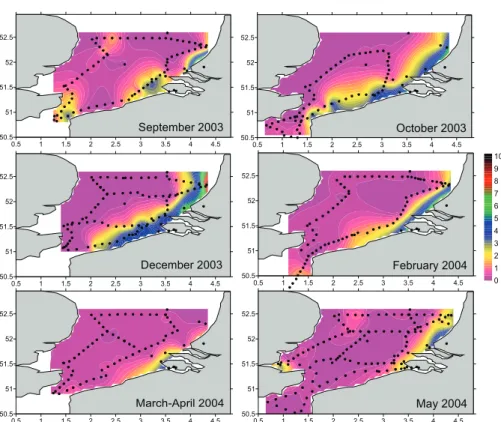
0.5 1 1.5 2 2.5 3 3.5 4 4.5 50.5 51 51.5 52 52.5 0.5 1 1.5 2 2.5 3 3.5 4 4.5 50.5 51 51.5 52 52.5 0.5 1 1.5 2 2.5 3 3.5 4 4.5 50.5 51 51.5 52 52.5 0.5 1 1.5 2 2.5 3 3.5 4 4.5 50.5 51 51.5 52 52.5 0 16 32 48 64 80 96 112 128 144 160 0.5 1 1.5 2 2.5 3 3.5 4 4.5 50.5 51 51.5 52 52.5 0.5 1 1.5 2 2.5 3 3.5 4 4.5 50.5 51 51.5 52 52.5 September 2003 October 2003 December 2003 February 2004 March-April 2004 May 2004
Fig 5: Nitrite + Nitrate (µM) distribution in the SBNS for the 6 cruises. Dots represent sampling positions. The isolines were computed after interpolation with the Krigging method using the
SURFER software (Golden-Software).
Figures 5, 6 and 7 illustrate the spatial and temporal distribution of nitrate+nitrite (hereafter as nitrate or NO3-), ammonium and phosphate concentrations during the
0.5 1 1.5 2 2.5 3 3.5 4 4.5 50.5 51 51.5 52 52.5 0.5 1 1.5 2 2.5 3 3.5 4 4.5 50.5 51 51.5 52 52.5 0.5 1 1.5 2 2.5 3 3.5 4 4.5 50.5 51 51.5 52 52.5 0.5 1 1.5 2 2.5 3 3.5 4 4.5 50.5 51 51.5 52 52.5 0 1 2 3 4 5 6 7 8 9 10 0.5 1 1.5 2 2.5 3 3.5 4 4.5 50.5 51 51.5 52 52.5 0.5 1 1.5 2 2.5 3 3.5 4 4.5 50.5 51 51.5 52 52.5 September 2003 October 2003 December 2003 February 2004 March-April 2004 May 2004
Fig 6: Ammonium (µM) distribution in the SBNS for the 6 cruises. Dots represent sampling positions. The isolines were computed after interpolation with the Krigging method using
the SURFER software (Golden-Software).
0.5 1 1.5 2 2.5 3 3.5 4 4.5 50.5 51 51.5 52 52.5 0.5 1 1.5 2 2.5 3 3.5 4 4.5 50.5 51 51.5 52 52.5 0.5 1 1.5 2 2.5 3 3.5 4 4.5 50.5 51 51.5 52 52.5 0.5 1 1.5 2 2.5 3 3.5 4 4.5 50.5 51 51.5 52 52.5 0 0.3 0.6 0.9 1.2 1.5 1.8 2.1 2.4 2.7 3 0.5 1 1.5 2 2.5 3 3.5 4 4.5 50.5 51 51.5 52 52.5 0.5 1 1.5 2 2.5 3 3.5 4 4.5 50.5 51 51.5 52 52.5 September 2003 October 2003 December 2003 February 2004 March-April 2004 May 2004
Fig 7: Phosphate (µM) distribution in the SBNS for the 6 cruises. Dots represent sampling positions. The isolines were computed after interpolation with the Krigging method using
In late summer (September 2003), the SBNS was completely depleted in DIN (NH4+
and NO3-) and PO4, except in the direct neighborhood of the mouth of the Scheldt
and Rhine estuaries. During fall-winter (from October to February), DIN concentrations increased, and the entire area was replenished with DIN and PO4 by
late February. NO2+NO3 µM 0 10 20 30 40 31 32 33 34 35 36 Salinity (PSU)
Scheldt plume Northern part
Thames plume Rhine plume
Channel English coast North
PO4 µM 0 0.5 1 1.5 2 31 32 33 34 35 36 Salinity (PSU)
Scheldt plume Northern part
Thames plume Rhine plume
Channel English coast North
Fig.8. NO3
and PO4Ł concentration as a function of salinity in the SBNS in October 2004
The influence of the Scheldt and Rhine riverine inputs was visible with the presence of a “plume” extending North and Southwards. Additionally, because of the different levels of NO3- and PO4 present in the Rhine and Scheldt estuaries, Rhine and
Scheldt plumes can clearly be distinguished from NO3- and PO4 vs salinity plots
(example Fig. 8). NO3- and PO4were progressively distributed in the entire area and
concentrations increased until February (for PO4) or March-April (for NO3-). NH4+ was
restricted to the river plumes area and increased until February. Between February and March-April (for PO4 and NH4+) and between March-April and May (for NO3-),
inorganic N and P nutrients decrease in the river plumes and the central part of the SBNS as a result of the spring phytoplankton bloom development.
Seasonal variations of NH4+, NO3- and PO4 can better be evaluated when
considering the monthly averages (corresponding to all sampling periods) computed for both the Scheldt plume area and the central region of the SBNS (Fig. 9), based on high resolution N nutrients concentrations profiles (Figs 5, 6 and 7).
The global variation in DIN concentrations is tuned on the one side by the supply of DIN from external sources (estuarine, marine and atmospheric inputs) and on the other side by biological processes such as DIN uptake and regeneration processes occurring in both the benthic and pelagic compartments of the ecosystem; both of them being subject to seasonal variations.
In the Scheldt plume, average nitrate levels are relatively stable (between 10 and 20 µM) from September to December and increase to a maximum (50 µM) in late February. From February to May, they decrease regularly. In the central part, nitrate increases regularly from September (2 µM) to late March (17 µM), and decreases rapidly in May (3 µM). Ammonium concentrations in the Scheldt plume increase from
September to December and decrease from December to May. The central area of the SBNS was characterized by low NH4+ concentrations all year round, with a small
and regular decrease between October and May. As a reduced and highly labile nitrogen compound, ammonium does not accumulate in the open sea part of the SBNS, but comprises a relatively small pool which probably cycles rapidly.
Central SBNS 0 0.4 0.8 1.2 1.6 A u g -0 3 S e p -0 3 O c t-0 3 N o v -0 3 D e c -0 3 J a n -0 4 F e b -0 4 M a r-0 4 A p r-0 4 M a y -0 4 N H 4 µ M Scheldt Plume 0 1 2 3 4 5 A u g -0 3 S e p -0 3 O c t-0 3 N o v -0 3 D e c -0 3 J a n -0 4 F e b -0 4 M a r-0 4 A p r-0 4 M a y -0 4 N H 4 µ M Central SBNS 0 5 10 15 20 25 A u g -0 3 S e p -0 3 O c t-0 3 N o v -0 3 D e c -0 3 J a n -0 4 F e b -0 4 M a r-0 4 A p r-0 4 M a y -0 4 N O 3 µ M Scheldt Plume 0 20 40 60 80 100 120 A u g -0 3 S e p -0 3 O c t-0 3 N o v -0 3 D e c -0 3 J a n -0 4 F e b -0 4 M a r-0 4 A p r-0 4 M a y -0 4 N O 3 µ M Central SBNS 0 0.1 0.2 0.3 0.4 0.5 0.6 0.7 A u g -0 3 S e p -0 3 O c t-0 3 N o v -0 3 D e c -0 3 J a n -0 4 F e b -0 4 M a r-0 4 A p r-0 4 M a y -0 4 P O 4 µ M Scheldt Plume 0 0.4 0.8 1.2 1.6 2 A u g -0 3 S e p -0 3 O c t-0 3 N o v -0 3 D e c -0 3 J a n -0 4 F e b -0 4 M a r-0 4 A p r-0 4 M a y -0 4 P O 4 µ M
Figure 9: Average nitrate, ammonium and phosphate concentrations in the Scheldt plume and the central part of the SBNS. Error bars represent standard deviations on the averages calculated from
the distributions shown in Figs 5, 6 and 7.
Phosphate concentrations in the Scheldt plume were relatively constant from September to late February and decrease from February to May. In the central part of the SBNS, PO4 increase from September to end of February and decrease from
To conclude, lowest nutrient levels were recorded in May at the maximum of the phytoplankton biomass (see Fig. 4) and maximum in winter (December, February or March).
4.3.2. Organic N and P speciation in the SBNS
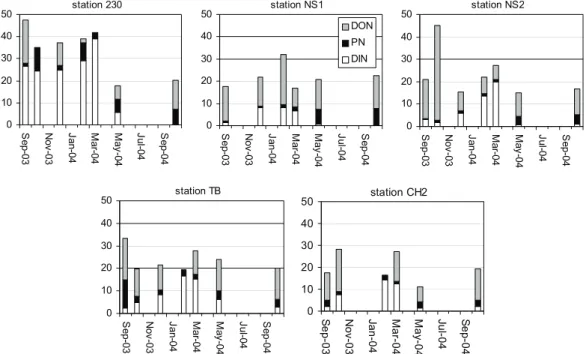
Organic N and P speciation were carried out at the 5 fixed stations and seasonal variations are shown in figures 10 and 11.
For nitrogen (Fig. 10), DON is the most abundant organic form except at station 230 located in the Scheldt Plume in spring. Organic nitrogen is in general highest in summer and fall and lowest in February (stations TB and CH2) or March (station 230, NS1 and NS2). The importance of the organic N pool compared to the inorganic one depends on the station. While the coastal station 230, located in the Scheldt plume region is dominated by inorganic N forms, the central waters have higher organic N content (Fig. 10). station 230 0 10 20 30 40 50 S e p -0 3 N o v -0 3 J a n -0 4 M a r-0 4 M a y -0 4 J u l-0 4 S e p -0 4 station NS1 0 10 20 30 40 50 S e p -0 3 N o v -0 3 J a n -0 4 M a r-0 4 M a y -0 4 J u l-0 4 S e p -0 4 DON PN DIN station NS2 0 10 20 30 40 50 S e p -0 3 N o v -0 3 J a n -0 4 M a r-0 4 M a y -0 4 J u l-0 4 S e p -0 4 station TB 0 10 20 30 40 50 S e p -0 3 N o v -0 3 J a n -0 4 M a r-0 4 M a y -0 4 J u l-0 4 S e p -0 4 station CH2 0 10 20 30 40 50 S e p -0 3 N o v -0 3 J a n -0 4 M a r-0 4 M a y -0 4 J u l-0 4 S e p -0 4
Fig. 10. Seasonal variations of inorganic (DIN) and organic N (Dissolved DON, and particulate PN) at the 5 process stations in the SBNS.
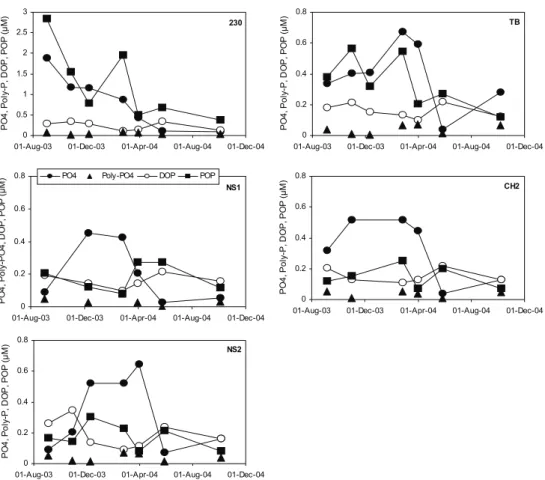
For phosphorus, polyphosphate is the least abundant P species (Fig. 11). The DOP concentration is elevated in late May and at some stations in September-October. In general, the seasonal trend in DOP seems to mirror that of phosphate. The seasonal trend in the POP concentration is obscured by variation in SPM load, particularly at the most turbid stations 230 and TB. The high POP value observed in February 2004 at CH2 is also due to a high SPM load.
NS2 0 0.2 0.4 0.6 0.8
01-Aug-03 01-Dec-03 01-Apr-04 01-Aug-04 01-Dec-04
P O 4 , P o ly -P , D O P , P O P ( µ M ) NS1 0 0.2 0.4 0.6 0.8
01-Aug-03 01-Dec-03 01-Apr-04 01-Aug-04 01-Dec-04
P O 4 , P o ly -P O 4 , D O P , P O P ( µ M
) PO4 Poly-PO4 DOP POP
TB 0 0.2 0.4 0.6 0.8
01-Aug-03 01-Dec-03 01-Apr-04 01-Aug-04 01-Dec-04
P O 4 , P o ly -P , D O P , P O P ( µ M ) 230 0 0.5 1 1.5 2 2.5 3
01-Aug-03 01-Dec-03 01-Apr-04 01-Aug-04 01-Dec-04
P O 4 , P o ly -P , D O P , P O P ( µ M ) CH2 0 0.2 0.4 0.6 0.8
01-Aug-03 01-Dec-03 01-Apr-04 01-Aug-04 01-Dec-04
P O 4 , P o ly -P , D O P , P O P ( µ M )
Figure 11. Seasonal trend in the depth-averaged phosphate, polyphosphate, DOP and POP concentrations at the fixed stations 230, NS1, NS2, TB and CH2.
4.3.3. DON distribution in the western coastal waters of the SBNS
Although the records of salinity and some other parameters in the DONAR data base are more than 35 years long, dissolved and particulate organic nitrogen have been determined routinely at various sampling locations on the Dutch Continental Shelf since 1991 (Fig. 12). For most of the locations the record is nowadays about fifteen years (Fig. 12) but for some minor records are on shorter periods (e.g. Walcheren 50).
Figure 12. Spatial and temporal coverage of Dissolved Organic Nitrogen (DON) data in Dutch coastal zone (from Van Engeland, 2006)
Analysis of long-term trends showed that the concentration of DON significantly decreased between 1991 and 2005 (linear regression with log transformation) at all sampling locations in the Dutch coastal zone (Fig. 13), except at Rottumerplaat, going from 0.6 ȝM.y-1 to 0.13 ȝM.y-1.
Additionally, there is a seasonal signal in the DON concentration with lowest values in winter and highest early summer. The seasonal signal, however, was more pronounced in the coastal zone than in the open sea (Fig. 13).
2 4 6 8 10 12 6 8 1 0 1 2 1 4 1 6 1 8 Month [D O N ] (µ M ) 1975-1979 1980-1984 1985-1989 1990-1994 1995-1999 2000-2004 1990-1994 2000-2004 1995-1999 2 4 6 8 10 12 6 8 1 0 1 2 1 4 1 6 1 8 Month [D O N ] (µ M ) 1975-1979 1980-1984 1985-1989 1990-1994 1995-1999 2000-2004 1990-1994 2000-2004 1995-1999 2 4 6 8 10 12 4 5 6 7 8 9 1 0 Month [D O N ] (µ M ) 1975-1979 1980-1984 1985-1989 1990-1994 1995-1999 2000-2004 2000-2004 1995-1999 1990-1994 2 4 6 8 10 12 4 5 6 7 8 9 1 0 Month [D O N ] (µ M ) 1975-1979 1980-1984 1985-1989 1990-1994 1995-1999 2000-2004 2000-2004 1995-1999 1990-1994
Figure 13. Seasonal evolution of the monthly median and interquartile range of the DON values for the coast (left) and open sea (right).
1992 1996 2000 2004 0 .2 0 .4 0 .6 H ig h S e a s 1992 1996 2000 2004 0 .1 0 .2 0 .3 0 .4 0 .5 C o a s ta l Z o n e 1992 1996 2000 2004 0 .1 5 0 .2 5 0 .3 5 0 .4 5 W a d d e n S e a 1992 1996 2000 2004 0 .2 0 .3 0 .4 0 .5 E a s te rn S c h e ld t Time (year) [NH4 + ]/[DN] [NOx -]/[DN] DON]/[DN]
Figure 14. Year-to-year variation in the major fractions of dissolved nitrogen in the central area (S>30), the coastal zone, the Wadden Sea and the Oosterschelde. Ammonium (plain line), nitrate and nitrite
(dashed line) and dissolved organic nitrogen (DON) (dotted line).
The contribution of DON to total dissolved nitrogen differs for the water systems studied (Fig. 14). In general, the DON concentration is a major constituent of dissolved nitrogen; highest ratios (>0.6) are found on the central area, decreasing to the coastal zone and Oosterschelde to ratios around 0.4. This is also reflected in the ratio of DON to total nitrogen for the Dutch coastal zone and central area during the years 1992-2004 (Fig. 15) and is in accordance with the measurements made in the SBNS stations during the CANOPY cruises (Fig. 10).
0.4 0.3 0.4 0.4 0.3 0.4
Figure 15. Temporal and spatial distribution of the ratio between Dissolved organic Nitrogen (DON, ȝM) and total nitrogen in the Dutch coastal zone and associated open sea.
4.4. PROCESSES OF N, P AND C TRANSFORMATION 4.4.1. Primary production
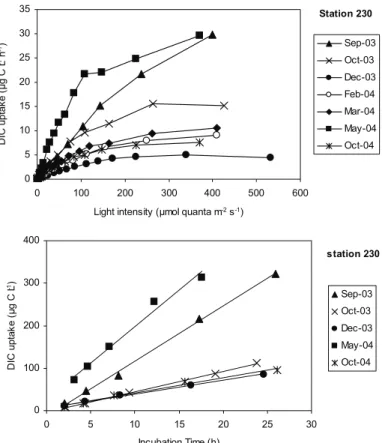
The depth integrated primary production was calculated using the photosynthetic parameters obtained from the P-E curve fit, the Chl a concentration (Fig. 4) and the light availability at each depth as described in methods. An example of P-E curves is presented in figure 16 for station 230. Additionally, respiration was not expected to be important in our production vs. irradiance incubations because DIC uptake was linear during at least a 12-hour period (Fig. 16).
Station 230 0 5 10 15 20 25 30 35 0 100 200 300 400 500 600 Light intensity (µmol quanta m-2 s-1)
D IC u p ta k e ( µ g C L -1 h -1) Sep-03 Oct-03 Dec-03 Feb-04 Mar-04 May-04 Oct-04 station 230 0 100 200 300 400 0 5 10 15 20 25 30 Incubation Time (h) D IC u p ta k e ( µ g C L -1) Sep-03 Oct-03 Dec-03 May-04 Oct-04
Figure 16. DIC uptake rates under variable light conditions (top) and as a function of time (bottom) at station 230.
NS1 0.0 0.5 1.0 1.5 2.0
Sep-03 Dec-03 Feb-04 Mar-04 May-04 Oct-04
P P ( g C m -2 d -1) 0 2 4 6 8 C h lo ro p h y ll a ( µ g l -1) PP Chl a NS2 0.0 0.5 1.0 1.5 2.0
Sep-03 Oct-03 Dec-03 Feb-04 Mar-04 May-04 Oct-04
P P ( g C m -2 d -1) 0 2 4 6 8 C h lo ro p h y ll a ( µ g l -1) TB 0.0 0.5 1.0 1.5 2.0
Sep-03 Oct-03 Dec-03 Feb-04 Mar-04 May-04 Oct-04
P P ( g C m -2 d -1) 0 2 4 6 8 C h lo ro p h y ll a ( µ g l -1) 230 0.0 0.5 1.0 1.5 2.0
Sep-03 Oct-03 Dec-03 Feb-04 Mar-04 May-04 Oct-04
P P ( g C m -2 d -1) 0 2 4 6 8 C h lo ro p h y ll a ( µ g l -1) CH2 0.0 0.5 1.0 1.5 2.0
Sep-03 Oct-03 Feb-04 Mar-04 May-04 Oct-04
P P ( g C m -2 d -1) 0 2 4 6 8 C h lo ro p h y ll a ( µ g l -1)
Figure 17. Depth integrated potential primary production (PP) and chlorophyll a concentrations (taken from van der Zee et al. a, subm.)
Primary production varied between 0.1 to 1.7 gC m-2 d-1. The temporal evolution was the same at stations NS2, TB, 230 and CH2: it decreased from September 2003 until December or February, after which it increased to reach a maximal value in May 2003 and declined again in October 2004 (Fig. 17). At station NS1, it was highest in September 2003. Primary production rates were of similar magnitude for the 5 stations.
4.4.2. Inorganic N uptake and regeneration processes in the water column of the SBNS
In the water column, DIN is taken up by microorganisms to produce organic material (OM) and, conversely, organic matter is mineralized by heteretrophic microorganism to recycle DIN.
Figure 18 illustrates the characteristic seasonal distributions of ammonium (UNH4) and
nitrate (UNO3) uptake rates at the 5 process stations in the SBNS.
Station 230 0.00 0.02 0.04 0.06 0.08 0.10 S e p -0 3 O c t-0 3 N o v -0 3 D e c -0 3 J a n -0 4 F e b -0 4 M a r-0 4 A p r-0 4 M a y -0 4 J u n -0 4 Station NS1 0.00 0.04 0.08 0.12 0.16 0.20 S e p -0 3 O c t-0 3 N o v -0 3 D e c -0 3 J a n -0 4 F e b -0 4 M a r-0 4 A p r-0 4 M a y -0 4 J u n -0 4 UNH4 UNO3(µM l -1) Station NS2 0.00 0.02 0.04 0.06 0.08 0.10 S e p -0 3 O c t-0 3 N o v -0 3 D e c -0 3 J a n -0 4 F e b -0 4 M a r-0 4 A p r-0 4 M a y -0 4 J u n -0 4 Station TB 0.00 0.02 0.04 0.06 0.08 0.10 S e p -0 3 O c t-0 3 N o v -0 3 D e c -0 3 J a n -0 4 F e b -0 4 M a r-0 4 A p r-0 4 M a y -0 4 J u n -0 4 Station CH2 0.00 0.02 0.04 0.06 0.08 0.10 S e p -0 3 O c t-0 3 N o v -0 3 D e c -0 3 J a n -0 4 F e b -0 4 M a r-0 4 A p r-0 4 M a y -0 4 J u n -0 4
Figure 18: Ammonium (UNH4) and nitrate (UNO3) uptake rates (µM h-1) at the 5 process
stations in the SBNS for 5 cruises.
Between September 2003 and May 2004, UNH4 and UNO3 co-varied at all stations,
except at stations 230 in May 2004, TB in September 2003 and May 2004 and CH2 in September 2003. Generally, UNH4 varied from 0.001 and 0.16 µM h-1, with
maximum values recorded at the end of spring (all stations) and summer (stations CH2 and TB) phytoplankton blooms. Similarly, UNO3 ranged from 0 and 0.11 µM h-1,
with peak values measured during the spring bloom (all stations, except station TB). At station NS2, UNO3 maintained very low year round. In general the uptake of nitrate
0 20 40 60 80 100 A u g -0 3 S e p -0 3 O c t-0 3 N o v -0 3 D e c -0 3 J a n -0 4 F e b -0 4 M a r-0 4 A p r-0 4 M a y -0 4 J u n -0 4 U N O 3 /U D IN ( %
Figure 19: Contribution of nitrate to the total DIN uptake. Median (dots), percentile 10% and 90% (dotted line) values for the 5 incubation stations in the SBNS for 5 cruises.
Station 230 0.00 0.05 0.10 0.15 0.20 0.25 0.30 0.35 S e p -0 3 O c t-0 3 N o v -0 3 D e c -0 3 J a n -0 4 F e b -0 4 M a r-0 4 A p r-0 4 M a y -0 4 J u n -0 4 R N H 4 ( µ M h -1) Station NS1 0.00 0.05 0.10 0.15 0.20 0.25 0.30 0.35 S e p -0 3 O c t-0 3 N o v -0 3 D e c -0 3 J a n -0 4 F e b -0 4 M a r-0 4 A p r-0 4 M a y -0 4 J u n -0 4 Station NS2 0.00 0.05 0.10 0.15 0.20 0.25 0.30 0.35 S e p -0 3 O c t-0 3 N o v -0 3 D e c -0 3 J a n -0 4 F e b -0 4 M a r-0 4 A p r-0 4 M a y -0 4 J u n -0 4 Station TB 0.00 0.05 0.10 0.15 0.20 0.25 0.30 0.35 S e p -0 3 O c t-0 3 N o v -0 3 D e c -0 3 J a n -0 4 F e b -0 4 M a r-0 4 A p r-0 4 M a y -0 4 J u n -0 4 R N H 4 ( µ M /h ) Station CH2 0.00 0.05 0.10 0.15 0.20 0.25 0.30 0.35 S e p -0 3 O c t-0 3 N o v -0 3 D e c -0 3 J a n -0 4 F e b -0 4 M a r-0 4 A p r-0 4 M a y -0 4 J u n -0 4
Figure 20: Ammonium regeneration rates (µM h-1) measured at the 5 incubation
stations in the SBNS, during the 5 cruises
Generally, at all stations, ammonium regeneration rates (RNH4) varied between 0 and
0.30 µM h-1 (Fig. 20). At stations 230, NS1 and NS2, RNH4 maintained at low levels (<
0.1 µM h-1) between September 2003 and February 2004 (except one high value at station NS1 in February), but attained maximum values during the spring phytoplankton bloom (in April 2004 for stations NS1, NS2 and May 2004 for station 230). At station NS2, following the peak value recorded at the onset of the spring bloom (April 2004), RNH4 dropped to its minimum in late May 2004. Throughout the
sampling period (September 2003-May 2004), station TB showed no significant seasonal differences in the means of RNH4, which maintained low year round. At
station CH2, the minimum RNH4 recorded in late September 2003 was followed by a
spring bloom period, RNH4 dropped significantly, attaining again a minimum in late
May 2004.
We can define the net pelagic DIN cycling regime (R-U) as RNH4-UDIN, where UDIN =
UNO3 + UNH4. In this view, the water column of the SBNS can be considered as an
U-dominant system (DIN-Uptake processes U-dominant) when (U) < 0 and as a R-dominant system (DIN-Regenerating processes R-dominant) when (R-U) > 0, respectively. Figure 21 illustrates the time course of the R-U at each of the sampling stations. It is noted that those stations for which |R-U| < 0.05 µM h-1 were considered close to balance (R ≅ U).
Station NS1 -0.10 0.00 0.10 0.20 0.30 S e p -0 3 O c t-0 3 N o v -0 3 D e c -0 3 J a n -0 4 F e b -0 4 M a r-0 4 A p r-0 4 M a y -0 4 J u n -0 4 Station NS2 -0.10 0.00 0.10 0.20 0.30 S e p -0 3 O c t-0 3 N o v -0 3 D e c -0 3 J a n -0 4 F e b -0 4 M a r-0 4 A p r-0 4 M a y -0 4 J u n -0 4 Station TB -0.10 0.00 0.10 0.20 0.30 S e p -0 3 O c t-0 3 N o v -0 3 D e c -0 3 J a n -0 4 F e b -0 4 M a r-0 4 A p r-0 4 M a y -0 4 J u n -0 4 R -U ( µ M h -1) Station CH2 -0.10 0.00 0.10 0.20 0.30 S e p -0 3 O c t-0 3 N o v -0 3 D e c -0 3 J a n -0 4 F e b -0 4 M a r-0 4 A p r-0 4 M a y -0 4 J u n -0 4 Station 230 -0.10 0.00 0.10 0.20 0.30 S e p -0 3 O c t-0 3 N o v -0 3 D e c -0 3 J a n -0 4 F e b -0 4 M a r-0 4 A p r-0 4 M a y -0 4 J u n -0 4 R -U ( µ M h -1)
Figure 21: The DIN cycling regime in the water column of the SBNS (SBNS as U or R-dominant system).
At the stations located in the central area (northern part) of the SBNS (stations NS1 and NS2), the R-U values recorded during late summer (September 2003) were close to 0. Consequently, this pelagic system was close to balance. In winter, both station displayed positive R-U with a slightly regenerating pelagic system until February 2004 for station NS2 and a highly R-dominant pelagic system at station NS1 in February. During the spring phytoplankton bloom, this system varied from highly R-dominant in March 2004 (both stations) to slightly U-dominant (station NS1) and balanced (station NS2), respectively, in May 2004.
In the more southern part of the SBNS, close to the English coast (station TB), R-U was close to zero throughout the end of summer-fall period (September- October 2003) and attained a peak value (0.1 µM h-1) at the end of winter (February 2004). Consequently, during this period, the pelagic system changed from balanced to highly R-dominant. During the spring phytoplankton bloom (April- May 2004), the R-U
values maintained close to zero and, thus, the SBNS system was in a balanced state. During late summer-winter period, the R-U measured at the station located in the English Channel (station CH2) varied from slightly U-dominant in September 2003 to R-dominant in February 2004. However, a peak R-U value was observed in late October 2003, when the pelagic system became highly regenerating. During the spring phytoplankton bloom, the system varied from balanced in April 2004 to slightly U-dominant in May 2004.
During late summer-winter period (September 2003-February 2004), the pelagic Scheldt plume system (station 230) was close to balance, except in October 2003 when it became slightly U-dominant. Also, the onset of the spring phytoplankton bloom (April 2004) was characterized close to balance (R ≅ U). This situation changed as the bloom progressed towards May 2004, when the water column of the Scheldt plume system turned into a highly R-dominant system (April-May 2004)
In general, the U dominance or R dominance of the pelagic system can be linked to the development of the phytoplankton population. Indeed, we can see that for stations NS1, NS2, CH2 and TB, R-U is related to the Chl-a concentrations (Fig. 22) : when chl-a > 2 µg/l, then R-U is negative and the system is net U dominant, while when the Chla < 2 µg/l, the system is clearly R dominant and the lower the Chla, the higher (R-U). The same relation was not found at station 230 possibly because this station, located in the Scheldt river plume, has important allochtonous organic material inputs enhancing regeneration processes even during phytoplankton blooms. -0.20 -0.10 0.00 0.10 0.20 0.30 0.40 0 2 4 6 8 10 Chl-a (µg/l) R -U ( µ M /h ) NS2 TB CH2 NS1 -0.10 0.00 0.10 0.20 0.30 0.40 0 2 4 6 8 10 Chl-a (µg/l) R -U ( µ M /h ) st230
Figure 22 The net pelagic DIN cycling regime (R-U) as a function of the Chla concentration for the 5 stations in the SBNS
To summarize, the surface waters of the central parts of the SBNS are slightly U-dominant (~autotrophic) or close to balance during periods of phytoplankton blooms, and clearly R-dominant (~heterotrophic) during periods of low phytoplankton biomass. The surface waters of the Scheldt plume are in general close to balance for most periods of the year except in May 2004 which was clearly U-dominant.
4.4.3. P processes
Regeneration supplies most of the P to the primary producers in the sea. In the SBNS, the oceanic/riverine inflow rates of PO4 are insufficient to support their
seasonal cycle and internal recycling is required (Prandle et al. 1997; van der Zee et al. a, subm.). The P metabolism is particularly dependent on the rapid regeneration of PO4 as there is no biological P uptake process analogous to N2 fixation. Enzymes
such as AP or 5PN can cleave DOP compounds in order to liberate the -PO4 moiety,
which can subsequently be taken up by the cell.
The enzyme 5PN is very substrate specific as it recognizes the nucleotide moiety of the substrate (Ammerman & Azam 1985). The 5PN activity in the dissolved fraction (< 0.2 µm) and the killed control samples was similar and very low, suggesting no net “free” enzyme activity (data not shown). The hydrolytic 5PN activity in the particulate fractions did not exhibit a seasonal variation similar to the AP activity, except at station 230 (Fig. 23).
The highest rates were found in September 2003 and May 2004 at this station. 5PN activity is generally contributed to bacteria (Ammerman & Azam 1985, 1991a & b, Nausch et al. 2004). Figure 23 shows the 5PN activity in the particulate size fractions < 2 µm and > 2 µm and in the total particulate size fraction. Both bacteria (< 2 µm) and algae (> 2 µm) contributed to the overall 5PN activity at all stations visited in the SBNS, but the extent varied from station to station and from campaign to campaign. The ATP hydrolysis rate ranged from 0 to 8.9 % h-1 in the fraction < 2 µm, from 0.2 to 14 % h-1 in the fraction > 2 µm and from 1.1 to 17.9 % h-1 in the total particulate fraction.
The hydrolytic activity of 5PN may supply growing bacteria with nucleosides. For the regeneration of PO4 is it important to know how much of the liberated PO4 is
assimilated by the algal or bacterial cell.
Figure 24 shows the percent uptake of 32PO4 liberated by 5PN. It was usually larger
in the fraction >2 µm, up to 96%, than in the smaller fraction, up to 42%. The coupled uptake in the larger size fraction also showed a clear temporal variation with the highest percentage uptake in May 2004, except for station NS2. Thus, phytoplankton did indeed use 5PN to provide the cell with PO4, when the ambient concentrations
were low in the SBNS. The smaller size fraction did not show this seasonal trend at stations NS1, NS2 and TB, whereas it did at station 230 and CH2. This indicates that bacteria utilized 5PN to a lesser extent to obtain PO4 than the algae. The percentage
NS1
0 5 10 15
Sep-03 Oct-03 Dec-03 Feb-04 Mar-04 May-04 Oct-04
5 P N a c tiv ity ( % h -1) NS2 0 5 10 15 20
Sep-03 Oct-03 Dec-03 Feb-04 Mar-04 May-04 Oct-04
5 P N a c tiv ity ( % h -1) TB 0 5 10 15 20
Sep-03 Oct-03 Dec-03 Feb-04 Mar-04 May-04 Oct-04
5 P N a c tiv ity ( % h -1) 230 0 5 10 15 20
Sep-03 Oct-03 Dec-03 Feb-04 Mar-04 May-04 Oct-04
5 P N a c tiv ity ( % h -1) CH2 0 5 10 15 20
Sep-03 Oct-03 Dec-03 Feb-04 Mar-04 May-04 Oct-04
5 P N a c tiv ity ( % h -1)
Figure 23 5PN activity in the < 2 µm, > 2 µm and the total particulate fraction (Taken from van der Zee et al.b, subm.)
0 20 40 60 80 100
Sep-03 Oct-03 Dec-03 Feb-04 Mar-04 May-04 Oct-04
P O4 u p ta k e ( % ) NS2 0 20 40 60 80 100
Sep-03 Oct-03 Dec-03 Feb-04 Mar-04 May-04 Oct-04
P O4 u p ta k e ( % ) TB 0 20 40 60 80 100
Sep-03 Oct-03 Dec-03 Feb-04 Mar-04 May-04 Oct-04
P O4 u p ta k e ( % ) CH2 0 20 40 60 80 100
Sep-03 Oct-03 Dec-03 Feb-04 Mar-04 May-04 Oct-04
P O4 u p ta k e ( % ) <2µm >2µm TP NS1 0 20 40 60 80 100
Sep-03 Oct-03 Dec-03 Feb-04 Mar-04 May-04 Oct-04
P O4 u p ta k e ( % ) 230
Figure 24 Percent coupled 32PO4 uptake following 32P-ATP hydrolysis
(Taken from van der Zee et al. b, subm.).
AP activity is commonly found in bacteria, phytoplankton as well as zooplankton both in the freshwater and the marine environment and hydrolyses a wide variety of organic P compounds due to its low specificity for the organic moiety (Jansson et al. 1988, Hoppe 2003). Figure 25 shows the AP activity at the 5 stations during the 7 campaigns. No AP activity was detected in the months October and December 2003 and February. The AP activity was very low in March 2004 and increased to maximum values in May 2004 Somewhat lower values were measured in September 2003 and October 2004. The maximal AP activity recorded using a substrate