Study of a 2024 aluminium rod produced by rotary forging
A.M. Habrakena, C. Bouffiouxa, M. Cartonb, J. Lecomte-Beckersb
a Architecture, Geology, Environment & Constructions Department (ARGENCO), University of Liège, 1, Chemin des Chevreuils, 4000 Liège, Belgium
b Aerospace and Mechanical Engineering Department (A&M), University of Liège, 1, Chemin des Chevreuils, 4000 Liège, Belgium
Abstract
An investigation of the rotary forging process of a 2024 aluminium rod is summarised. Some dispersion in mechanical properties and chemical composition of the base material is permitted. Samples of two material batches were selected: one just stays near the upper limit of tolerance and the other has mean properties. Tensile and compression tests confirm the different mechanical behaviours and allow the identification of constitutive laws parameters. Optical metallography after T3 and T10 thermal treatments and differential thermal analysis provide the grain size and precipitation characteristics of each material batch, which explain their different mechanical behaviours. The industrial rod studied is usually forged in two operations: a first forging process, then a T10 thermal treatment followed by a second forging step. Industrial practise shows that manufacturing the rod with one forging step fails. FEM simulations of the process coupled with a fracture criterion confirm the advantage of a two-step process compared to a single forging step.
Keywords: Aluminium alloy; Micro-macro link; Rotary forging process; FEM simulations; Precipitation; Crack
1. Introduction
Rods for aeronautical applications require different shapes at their ends to provide easy connections. The rotary forging process allows reaching this shape. After rod machining, several forging steps with systematic
intermediate thermal treatments lead to the final shape. However, when the decrease in diameter is large, one must know if the first round-round step can be performed in a single operation or if two successive forging steps with an intermediate thermal treatment are necessary. The present research attempts to answer this question for a specific 2024 aluminium rod (see Fig. 1). The initial material is in T3 state (T3 treatment consists of a solution heat treated, cold worked and naturally aged to a substantially stable condition), and T10 thermal treatment (consisting of a cooling from an elevated temperature shaping process, a cold work and an artificially aging) is applied before each forging operation [1]. This treatment, imposed by aeronautical specifications, releases the residual stresses and recovers mechanical properties. Industry has observed that for this specific rod, trying to perform the diameter reduction in one round-round forging step yields cracks, while two forging steps separated by T10 treatment allow forging with no problem. As this additional forging step costs time and money, it is interesting to better understand its necessity.
Another point requiring investigation is the effect of the material dispersion of the as-received 2024 rods. The industry imposes a tensile strength greater than 440 MPa. Two material batches are selected with low and high tensile strength: 444 MPa (material 3654) and 475 MPa (material 3653).
Section 2 describes the forging process; an initial simple model is used to define the strain and strain rate fields. Section 3 presents the material characterisation: tensile and compression mechanical properties, optical
metallography to characterise grain size and precipitate dispersion, differential thermal analysis to identify the precipitation kinetics. Microstructure and mechanical properties are clearly linked. FEM simulations of the process are summarised in Section 4. Results are then discussed.
2. Rotary forging process
Fig. 2 describes the rotary forging machine used. In a round-round forging step, a different rotation speed is imposed on the rod and on the hammer system, so the hammers forge a different place at each hit, which preserves the axisymmetric shape. One stroke is defined by the simultaneous displacement of two hammers that
hit the rod and apply a diametral deformation, as shown in Fig. 3. Displacement 1 defines the forging operation, displacement 2 is an unloading step and displacement 3 corresponds to the axial movement performed by the operator pushing the rod into the rotary machine. The amplitude of displacements 1 and 2 is quite small, i.e. maximum 1 mm, as can be observed in Fig. 2. So numerous strokes are necessary to decrease the external diameter from 25.4 to 15.3 mm. The axial speed is around 1.667 mm/s and the rotation speed, 165 rpm. A complete rotation comprises twelve strokes, in which loading and unloading (displacements 1 and 2) operations take place.
Fig. 1: Required geometry after the round-round forging step (mm).
Fig. 2: The rotary forging machine; arrows define the displacements.
Each movement takes 0.0034 s and the time between two strokes is 0.0235 s. At the start of this research, mechanical properties of 2024 aluminium in T10 state were unknown and the following characteristics
(describing this material in T3 state) were used for the first FEM model: Young modulus 72.4 GPa, Poisson ratio 0.33, initial yield limit 414 MPa, hardening slope 142.11 MPa. The Coulomb friction model between the hammer and the rod is assumed, with a friction coefficient of 0.2. These data on materials were estimated from [2,3]. The rotary forging process had already been analysed previously [4]. In this earlier study, different implicit 2D axisymmetric mechanical simulation strategies and 3D simulations were compared. The results showed that replacing the actual displacements by a single, large axisymmetric hammer displacement, with an amplitude directly defined by the decrease in diameter, already provides a good approximation of the process.
Implementing all these hypotheses, the computed maximum plastic strain reaches 0.056 at the end of forging. This information gives an idea of the maximum strain rate. Assuming that such a strain could occur during a single displacement of type 1 (see Fig. 3), one computes a maximum strain rate of 16.5 s-1.
3. Material description
3.1. Mechanical behaviour 3.1.1. Tensile tests
In order to identify the mechanical properties of the 2024 aluminium in T10 state, non-standard tensile samples have been cut from the rod (see Fig. 4a). This sample geometry requires specific grips adapted to the curvature, which are available only in an electromagnetic press that limits the strain rate to 1 s-1 (maximum velocity of the plate 500 mm/s). As shown in Fig. 4b, the tests include acoustic detection [5] to check if rupture could be predicted by progressive damage identified by acoustic events. However, only very few acoustic events related either to yield limit or to rupture were detected for this material. The stress-strain curves are drawn in Fig. 4c. A test at a velocity of 2 mm/min (300 mm/min) provides a strain rate at the test start of 1.67 x 10⁻³ s-1 (2.5 x 10⁻¹ s-1). One can notice a difference of about 30 MPa between the two batches (3653 and 3654), but no strain rate effect. Table 1 summarises the results.
Fig. 3: Rod section and hammer shapes for two-step forging. (1,2 and 3) Hammer displacements; (A) first
hammer; (B) second hammer; (a) initial section; (b) intermediate section; (c) final shape.
Fig. 4: (a) Tensile specimen; (b) tensile grip and acoustic receptor; (c) tensile stress-strain curves, two tests per
velocity and per batch.
Table 1: Results of tensile tests
3653 3654
2 mm/min 300 mm/min 2 mm/min 300 mm/min
Rupture strain (%) 18.6 15.9 16.9 14.9
3.1.2. Compression tests
To identify T10 2024 aluminium behaviour in the strain rate field occurring in the rotary forging process, compression tests on rod slices 11 mm in height, 25.4 mm external diameter and 1.65 mm thick are performed (see Fig. 5). The hydraulic press applies a constant height reduction rate of 5 and 10 s-1. The load versus the logarithm of height reduction is shown in Fig. 6a. Like in the tensile tests, the strain rate seems to have no effect, and the 3653 batch has higher stiffness. As the strain rate effect can be ignored, the classical Hollomon law is chosen:
to describe the material behaviour. Elastic parameters from Section 2 are used. The experimental compression test is simulated and the well-known inverse method [6] using Levenberg-Marquard approach is applied to identify the parameters C and n. These parameters are automatically optimised until the FEM compression simulations provide shape (Fig. 5) and load curves (Fig. 6a) identical to the measurements. Table 2 gives the identified material parameters C and n, and Fig. 6b shows the close agreement between the Hollomon law curves identified by the compression tests and the mean stress-strain curves provided by the tensile tests.
Fig. 5: Compressed rod after 40% of height reduction, 3653 material batch.
Table 2: Material parameters: C and n of Hollomon law
3653 3654
C 398.5 371.7
n 0.192 0.233
Fig. 6: (a) Force-height reduction logarithm curves during compression tests, two tests per strain rate and per
Fig. 7: Microstructure of 3653 and 3654 alloys; (a) and (b) with HF etching: (a) after heat treatments T3 and T3
+ T10; (b) after forging; (c) and (d) with Keller's reagent: (c) after heat treatments T3 and T3 + T10 in direction 1 ; (d) after forging.
3.2. Metallurgical analysis 3.2.1. Optical microscopy
3.2.1.1. Preparation/or microscopic examination.
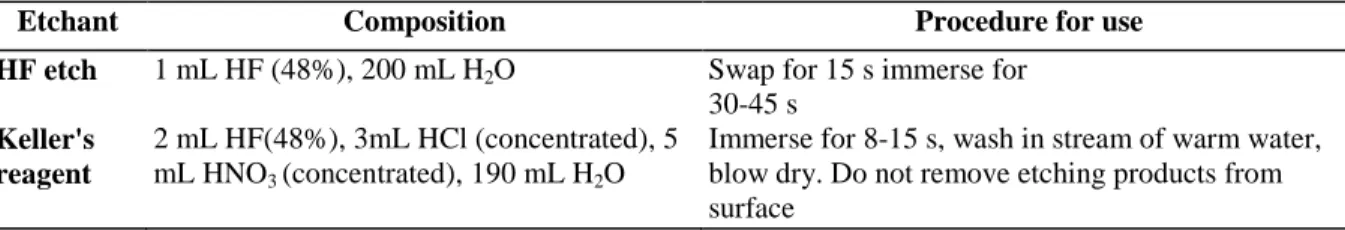
For the metallurgical analysis of aluminium alloys 3653 and 3654, two etchings were used. The HF etching provides information on precipitates and the Keller's reagent shows grain size. According to [7], features of these two etchings are shown in Table 3.
The microstructure of the aluminium alloys 3653 and 3654 was studied at different steps: after heat treatment T3, after heat treatment T3 + T10, after forging and after compression tests.
For each case, the structure was observed by both HF etching and Keller's reagent. Direction 1 corresponds to the extrusion direction and direction 2 to the transverse direction.
3.2.1.2. Observations after HF etching.
The microstructures obtained after HF etching are shown in Fig. 7a and b. As no difference in structure was noticed between 3653 and 3654 alloys, only one figure is presented for each state. Moreover, the microstructure of both alloys is similar after T3 and after T3 + T10. This microstructure presented in Fig. 7a shows some large precipitates and smaller ones distributed in the matrix.
In view of the chemical composition, the nature of these precipitates can correspond to CuMgAl2, Cu2MnAl20, Cu2FeAl7. We also note that the microstructure is identical in both directions 1 and 2.
During processing, the rods are forged after heat treatment T10. The microstructure obtained is shown in Fig. 7b: an important difference is observed compared to Fig. 7a. The precipitates that were uniformly distributed in the matrix after T3 and T3 + T10, are, after forging, differently dispersed at grain boundaries and inside the matrix. This precipitates distribution allows the observation of the grain shape. Some depleted areas around the grain boundaries are noticed (see Fig. 7b). These remarks are valid for both directions studied.
Table 3: Etchants used in microscopic examination of aluminium alloys 3653 and 3654
Etchant Composition Procedure for use
HF etch 1 mL HF (48%), 200 mL H2O Swap for 15 s immerse for
30-45 s
Keller's reagent
2 mL HF(48%), 3mL HCl (concentrated), 5 mL HNO3 (concentrated), 190 mL H2O
Immerse for 8-15 s, wash in stream of warm water, blow dry. Do not remove etching products from surface
3.2.1.3. Keller's reagent results.
The goal of this second study is to characterise grain size and shape, which could explain the difference in mechanical behaviour between 3653 and 3654 alloys observed during tensile and compression tests. Like for HF etching, both directions were studied. The obtained microstructures are shown in Fig. 7c and d.
Fig. 7c shows the microstructure of 3654 alloy (in direction 1) after T3. Grains can now be easily observed. The same kind of microstructure is obtained for 3653 alloy, but in this case the grains are smaller. The study in direction 2 also confirms the grain size difference between the two alloys, but here the grains have an elongated shape, following the axial rod direction. Microstructure investigations on rods after heat treatment T10 give exactly the same results as after T3.
Table 4: Average grain size of 3653 and 3654 alloys
Alloy Length (µm) Wide (µm)
3653 100 25
3654 220 60
Table 4 shows the measured grain size. It is likely that the differences observed in mechanical tensile tests results are due to this difference in grain size.
After forging, Keller's reagent analysis does not show any difference between the two alloys. Some large precipitates are observed in the matrix, and other smaller precipitates are present at grain boundaries, delimiting the grain itself. The typical microstructure obtained for both 3653 and 3654 alloys is shown in Fig. 7d.
Forging significantly modifies the structure. The grains are not so easily etched than those before forging. It is the presence of small precipitates at the grain boundaries that allows the grain size and shape observation. After forging (Fig. 7b and d), grains appear uniformly grey, whereas they were more or less dark with Keller's reagent before forging (Fig. 7c).
As already described in Section 3.1.2, some rods were compressed with a strain rate equal to 10 s-1 and a strain equal to 0.4. Some samples were taken from these compressed rods and analysed by optical microscopy. The goal was to determine whether their microstructure after compression was similar to the one obtained after forging. Results are shown in Fig. 8a and b. In this case, grains can be observed, meaning that the structure after compression is different from that after forging, even if precipitate features are similar in both cases.
After forging, the structure is not different between the two alloys. But after compression, like after heat treatment T10, a difference in grain size is again observed between the two alloys.
The grain size and the elastic stress limit check the Hall-Petch law. Grain sizes are given in Table 4, and elastic stress limits were determined by the intersection between the Hooke line and the σ-ε curves of both alloys (Fig. 6b).
The values are as follows:
• For 3653 alloy: σ1 = 115.8 N/mm2 and d1 = 100 µm. • For 3654 alloy: σ2 = 74.9 N/mm2 and d2 = 220 µm.
With the relations the ratio K1/K2 is computed equal to 1.04. This calculation confirms the coherence between the grain size and the σ-ε curves identification.
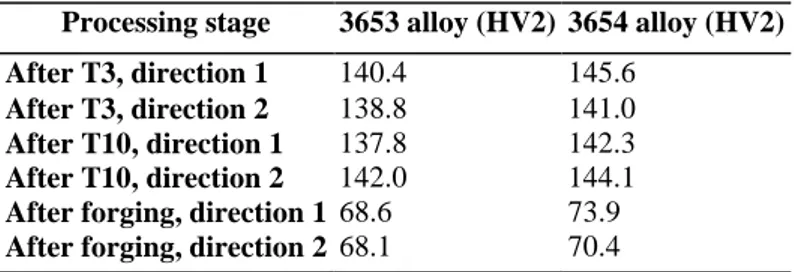
Table 5: Vickers hardness of 3653 and 3654 alloys
Processing stage 3653 alloy (HV2) 3654 alloy (HV2)
After T3, direction 1 140.4 145.6
After T3, direction 2 138.8 141.0
After T10, direction 1 137.8 142.3
After T10, direction 2 142.0 144.1
After forging, direction 1 68.6 73.9
After forging, direction 2 68.1 70.4
3.2.2. Hardness
The measurements were carried out on samples taken from rods after heat treatment T3, after T3 + T10 and after forging. Results are shown in Table 5.
The hardness is quite similar before and after T10. At each processing stage, 3653 alloy has a lower hardness which could be explained by a different level of precipitation. This effect has not been measured but is confirmed by DTA analysis (Section 3.2.3). A decrease in hardness is observed after forging, due to the microstructure changes occurring during this last processing stage.
3.2.3. Differential thermal analysis
Both alloys were studied by differential thermal analysis (DTA) after heat treatment T10. DTA measurement is a technique by which the difference in heat flow between a sample and a reference is monitored as a function of temperature or time, while the sample is subjected to a controlled temperature program. The imposed
temperature cycle is heating from room temperature to 700 °C and cooling to room temperature, at a rate of 5 °C/min in both cases.
The DTA signal obtained during heating is shown in Fig. 9a and b for 3653 and 3654 alloys, respectively. The DTA signal is quite flat until 500 °C, meaning that there is no transformation in this temperature range. But at 510, 565 and 580°C, small peaks, named 1, 2 and 3 show different precipitates dissolution. The presence of these three distinct peaks means that at least three kinds of precipitates are present in the matrix after heat treatment T10. The amplitude of the three peaks is larger for the 3654 alloy, showing that each kind of precipitate is in larger quantity in the matrix. This fact, in addition to grain size, can explain the difference between the σ-ε curves. The largest peak, appearing between 510 and 675°C, corresponds to the matrix melting.
After heating and melting, the sample was cooled down. The solidification and precipitation curves are shown in Fig. 10a for 3653 alloy and in Fig. 10b for 3654 alloy.
Besides the large peak corresponding to matrix solidification, peaks corresponding to precipitations were also observed. The DTA signal of the 3653 alloy shows that four types of precipitates appeared during cooling, whereas only three peaks were observed for the 3654 alloy. These two different batches 3654 and 3653 have small composition difference leading to different precipitation.
Fig. 8: Microstructure after compression (Keller's reagent) of (a) 3653 and (b) 3654 alloy.
Fig. 9: DTA signal of (a) 3653 and (b) 3654 alloy during heating.
Fig. 10: DTA signal of (a) 3653 and (b) 3654 alloy during cooling.
3.2.4. Conclusions
For both alloys, precipitates features and microstructures are similar after T3 and after T3 + T10. But an important difference in grain size was observed between 3653 and 3654 alloys using Keller's reagent directly after T3, T3 + T10 and after compression tests. DTA measurements show that both alloys have different precipitations due to different compositions. Forging generates a microstructure transformation. However, Keller's reagent was not able to clearly characterise grain size and shape. So a comparison between the two alloys after forging is difficult.
Hardness before and after T10 is identical, due to a similar structure. But the larger precipitation of 3654 alloy results in a higher hardness. Due to a microstructure modification, a decrease in hardness is noticed after forging.
4. FEM model
4.1. Simulation strategy
Using the material parameters of Table 2, the round-round forging process to reduce the external diameter from 25.4 to 15.3 mm for the studied rod (Fig. 1) in one or two operations has been simulated by the Lagamine code [8]. The three displacements identified in Fig. 3 have been successively applied. So except for the axisymmetric assumption, simulations are closer to the real process than the simplified approach used in Section 2. Due to wear, the accurate value for types 1 and 2 hammer displacements is unknown and 0.5 mm was chosen. The maximum axial displacement compatible with the geometry (0.5/tan(6°) = 4.757 mm) is assumed.
Fig. 3 shows, for two-step forging, the initial, intermediate and final sections of the rod, the initial hammers' positions and the boundary conditions (intermediate diameter: 17 mm and final reduced diameter: 15.3 mm). In order to begin the second step, the geometrical results of the end of the first step are taken. The stress field and hardening variables are set to zero because of T10 thermal treatment.
For all simulations, the final rod length, with a reduced section, is 16 mm (see Fig. 1). 4.2. Validation
As can be seen in Fig. 11, mechanical characteristics dispersion has no effect on the final shape (identical thickening and final length for 3653 and 3654 materials). In contrast, the number of forging operations has an important impact on the final geometry. This point allows validation of the simulations. The maximum thickening is located at approximately 20 mm from the rod end. Industry has in the past measured a thickness increase of about 10% in the case of one-step forging process. For the rod studied here, a thickness increase of 9.7% is computed (1.066 mm for one-step forging instead of 0.972 mm for two-step forging).
4.3. Rupture criterion
As the goal of this research is to understand why a second forging step with intermediate thermal treatment is required, the process is coupled with different fracture criteria and the Freudenthal criterion is chosen:
among six criteria already implemented in Lagamine [9], as it locates the fracture at the right position according to industrial observations. The value of this criterion computed by FEM simulations at the end of each forging operation is analysed for the different cases: two different materials (3653 and 3654) and two processes (one- or two-step forging with intermediate treatment). All results identify the same critical zone (see Fig. 12). This point is in agreement with industrial observations. For both materials, a unique forging operation induces a higher value of the parameter Cf and implies a higher fracture risk. The critical value of Cf leading to crack should be identified for each material.
Tensile tests are examined here because they reach rupture, while compression tests do not, because of bending. For each material, four tests were performed at two different strain rates. As no viscosity effect was observed, the mean final equivalent strain is considered for each alloy (3653: = 0.173 and 3654: = 0.159) to identify the critical value of Cf (Eq. (2)) from the law: σ = Cεn and the material parameters C and n (see Table 2):
The following levels were obtained for 3653: Cf = 41.3 MPa and for 3654: Cf = 31.2 MPa. Simulations using such critical values of Cf parameter predict fracture too early. They do not lead to rupture in one-step forging and no rupture in two-step forging.
Fig. 11: Thickening of the rod.
Fig. 12: Maximum value of rupture criterion at the end of forging steps.
5. Discussion
Stresses versus time are analysed in the critical zone for all considered cases. The radial and shear stresses are very low compared to axial and circumferential stresses. The stress levels are similar for the single forging operation and for the first forging operation in the case of a two-step process. As shown in Fig. 13a, for 3653 material and for two-step forging, the stresses are released during unloading due to hammer displacement (see Fig. 3 displacements 2 and 3) and during thermal treatment. The forging operation induces large biaxial compression stresses, while Section 4.3 identifies Cf from uniaxial, tensile stresses. This difference can explain the gap between industrial observation and simulations.
Simple criterion like the Freudenthal one must be identified in equivalent loading conditions than those applied during the process. This well-known rule is again checked in this study. Let us notice that more complex damage models [10-13] could provide better predictions but their identification also requires more experiments then the available tensile stress-strain curves. Of course, a set of data for such models could be found by inverse
modelling based on the industrial process and the available tensile tests, however, the prediction aspect is lost. A serious scientific damage model approach has to rely either on some different loading experiments or on additional data such as initial void volume fraction, Young modulus decrease during loading, etc. Notice that such a model has already been proposed for the studied rotary process, another rod and another material [14]. For each material batch, this parameter identification should be repeated, which is quite heavy.
Fig. 13: Results in critical zone for 3653 material (a) evolution of stresses—case of two-step forging and (b)
evolution of Freudenthal criterion.
Fig. 13b shows the Freudenthal fracture criterion versus time in the critical zone for one- and for two-step forging. Like for stresses, this diagram shows similar evolution of the rupture criterion levels for the two cases examined, but a higher final value for the one-step process. Comparing industrial observations (cracks for one- and no crack for two-step forging with intermediate thermal treatment T10) and the FEM results (a higher stress level for one-step than for two-step forging and a higher rupture risk in the same zone as in the industrial process), this Freudenthal fracture criterion can be validated and it establishes the importance of the intermediate thermal treatment to avoid final cracks. However, the available tensile test do not provide the right Cf limit. The residual stress values confirm the necessity of the final T10 heat treatment (for 3653: maximum residual stress ≈92MPa, yield stress = 115.8 MPa, for 3654: maximum residual stress ≈61 MPa, yield stress = 74.9 MPa).
6. Conclusions
In this study, two batches of material were analysed and it has been shown that their different mechanical properties relate to different composition and microstructure. A better understanding of the material behaviour has been reached through metallurgical analysis. The process has been simulated by FEM analysis coupled with Freudenthal criterion. This model is partially validated by industrial observations. It locates the critical zone and shows that one-step forging is more critical than a two-step process, confirming the necessity of an intermediate thermal treatment.
However, to develop a quantitative model for crack prediction, the Freudenthal criterion identified by tensile tests is not representative of the process. One could either develop an experimental test with a compressive biaxial stress field or use another FEM damage model [10,11,14]. However, the identification of any damage model would require additional tests.
Acknowledgements
A.M. Habraken is a Senior Research Associate of National Fund for Scientific Research (Belgium), and thanks this research fund (FNRS) for support. The Région Wallonne provides financial support (project RW 981/3793) and TAC actively collaborates in the research. The authors thank them both.
References
[1] G.E. Dieter, S.D. Henry, S.T. Lampman, Metals Handbook, vol. 2, 9th ed. Properties and Selection: Nonferrous Alloys and Pure Metals. USA, 1979, p. 27.
[2] E.A. Brandes, G.B. Brook, Smithells Metals Reference Book, 7th ed., Butterworth-Heinemann, Great Britain, 1992.
[3] T. Altan, S. Oh, H. Gegel, Metal Forming: Fundamentals and Applications, A.S.M., USA, 1983.
[4] X.C. Wang, A.M. Habraken, S. Cescotto, in: S.F. Shen, P. Dawson (Eds.), Simulation of Materials Processing: Theory Methods and Applications, Balkema, Rotterdam, 1995, pp. 899-905.
[5] Vallen Systeme GmbH, The Acoustic Emission Company, AMSY4—User Manual, 1999.
[6] P.-P Jeunechamps, P. Duysinx, J. Walmag, V. Mathonet, E. Delhez, P. Tossings, A.M. Habraken, J.-P. Ponthot, Steel grips suppl, Met. Forming 2 (2004) 527-534.
[7] K. Mills, J.R. Davis, J.D. Destefani, ASM Handbook, vol. 9, Metallography and Microstructure, USA, 1998, p. 354.
[8] A.M. Habraken, S. Cescotto, Int. J. Numer. Methods Eng. 30 (1990) 1503-1525.
[9] Y.Y. Zhu, S. Cescotto, A.M. Habraken, J. Mater. Process. Technol. 32 (1992) 197-204.
[10] J. Lemaître, J.L. Chaboche, Mécanique des Matériaux Solides, Dunod, Paris, 1985.
[11] A.L. Gurson, Continuum theory of ductile rupture by void nucleation and growth, J. Eng. Mater. Technol. 99 (1977) 2-15.
[12] M. Gologanu, J.B. Leblond, J. Devaux, Approximate models for ductile metals containing non-spherical voids—case of axisymmetric prolate ellipsoidal cavities, J. Mech. Phys. Solids 41 (11) (1993) 1723-1754.
[13] A. Benzerga, J. Besson, A. Pineau, Coalescence-controlled anisotropic ductile fracture, J. Eng. Mater. Technol. 121 (1999) 221-229.
[14] A.M. Habraken, L.H. Zhang, X.C. Wang, S. Cescotto, in: A. Benallal (Ed.), Continuous Damage and Fracture, Elsevier, France, 2000, pp. 341-352.