Ten years of Martian nitric oxide nightglow
1
observations
2
Arnaud Stiepen1, Jean-Claude G´erard1, Marie-`Eve Gagn´e2, Franck Montmessin3 and Jean-Loup Bertaux3
Corresponding author: Arnaud Stiepen, Laboratoire de Physique Atmosph´erique et Plan´etaire (LPAP) Universit´e de Li`ege, Li`ege, Belgium (arnaud.stiepen@ulg.ac.be)
1Laboratoire de Physique Atmosph´erique
et Plan´etaire (LPAP) Universit´e de Li`ege, Li`ege, Belgium
2Canadian Centre for Climate Modelling
and Analysis (CCCma) University of Victoria, Canada
3 Laboratoire Atmosph`eres, Milieux,
Observations Spatiales (LATMOS), Universit´e de Versailles Saint-Quentin en Yvelines, France
We present ten years of Martian NO nightglow SPICAM observations in 3
limb and stellar occultation modes. 4
The NO nightglow is used as a tracer of the summer-to-winter hemispher-5
ical circulation in the upper atmosphere of Mars. Its distribution roughly fol-6
lows the curve latitude = -80 sin(solar longitude), with deviations. We find 7
that the peak brightness is 5 ± 4.5 kR, situated at 72 ±10.4 km. It ranges 8
from 0.23 to 18.51 kR and from 42 to 97 km. These values are consistent with 9
previous studies. We also present maps of the brightness of the NO emission 10
peak and its variability, an important factor that can reach up to 50% of the 11
emission and is not reproduced by average brightness model maps. The char-12
acteristics and factors that may control the emission are investigated. In par-13
ticular, we show that the solar activity exerts a positive influence on the num-14
ber of detections. It does not influence, on the contrary, the brightness or 15
altitude of the peak of the NO nightglow emission. 16
Results presented in this study lead to future comparisons with global Mar-17
tian atmospheric models and observational targets for the IUVS-MAVEN. 18
1. Introduction
The upper atmosphere of Mars dynamics, energy balance, structure and composition 19
depend on its multiple interactions with the lower atmosphere and the ionosphere. Its 20
study enhances our understanding of the atmosphere and its coupling with the solar 21
forcing. The upper atmosphere is the major target of present and future Martian 22
missions as the NASA Mars Atmosphere and Volatile Evolution (MAVEN) spacecraft. 23
The study of planetary airglow provides valuable information concerning the atmosphere 24
where it is produced as these emission remotely probe the composition, temperature and 25
dynamics of an atmosphere. 26
In the dayside thermosphere of Mars, the extreme ultraviolet solar radiations photodis-27
sociate CO2and N2 molecules. O(3P) and N(4S) atoms are then carried by the summer-to-28
winter hemispheric transport. They recombine to form NO(C2Π) excited molecules that 29
directly emit the UV δ and γ bands (the δ bands are emissions of the C2Π state, while 30
the γ bands are emissions of the A2Σ state, which has been populated by cascading from 31
the C2Π state): these emissions are indicators of the N and O atom fluxes transported by 32
the summer-to-winter dayside to nightside Hadley cell. 33
The first detection of the nitric oxide UV airglow on Mars nightside was reported by 34
Bertaux et al. (2005) using the SPICAM (Spectroscopy for Investigation of Characteristics 35
of the Atmosphere of Mars) spectrograph on board Mars Express (MEx). They observed 36
an emission peak reaching 2.2 kR located at 70 km. The limiting factor for this emission is 37
the nitrogen atom flux descending towards the atmospheric layer where N atoms recombine 38
with O to produce NO*. They estimated this downward flux to be 2.5 x 10⁸ atoms cm−2 39
s−1, about a third of the production of N atoms by EUV photodissociation of N2 molecules 40
on the dayside. 41
Cox et al. (2008) looked for correlations between the emission peak brightness and 42
altitude with several factors that may affect the emission rates, such as: latitude, local 43
time, magnetic field and solar activity. They noticed that none of these factors seems to 44
control the emission, which exhibit large variations. The dataset used by Cox et al. (2008) 45
included 21 airglow detections between August 2004 and May 2006. The characteristics 46
(brightness and altitude) of the NO emission peak from the study of Cox et al. (2008) 47
are summarized in Table 1. Cox et al. (2008) compared observational emission profiles 48
with the results of a one-dimensional chemical-diffusive model in which the continuity 49
equations for O(3P) and N(4S) and NO are used to determine the eddy diffusion, oxygen 50
and nitrogen density profiles and the vertical downward nitrogen flux. 51
Gagn´e et al. (2013) used 2275 SPICAM stellar occultations accumulated between June 52
2004 and September 2009 to analyze 128 detections of the NO nightglow. They noticed 53
an interannual variability of the number of detection of the emission, linked to changes 54
in the solar flux during that time period . The number of detections increases with the 55
solar flux, in agreement with the paradigm of production of N(4S) on the dayside. They 56
analyzed the peak intensity and altitude of the NO emission see Table 1. They explained 57
that the mean brightness they observed is higher than the value found by Cox et al. (2008) 58
as the result of two factors: the dataset they used is larger than the dataset of Cox et al. 59
(2008) and it contains observations in various seasons covering three Martian years. The 60
observations they analyzed were obtained in large part at higher solar activity. Gagn´e 61
et al. (2013) also noticed that the peak altitude is statistically lower in the southern 62
hemisphere. This hemispheric asymmetry was not reproduced by the LMD (Laboratoire 63
de M´et´eorologie Dynamique) model described by Gonzal`ez-Galindo et al. (2009) and 64
Lopez-Valverde et al. (2011). No correlation was found between the altitude and the 65
brightness of the peak. They explained that this is caused by the fact that the emission is 66
localized in regions where downward fluxes of N and O atoms are important. In agreement 67
with the LMD results, the detections of the NO δ and γ bands are roughly located along 68
the curve latitude = -80 sin(Ls), with outliers (detections away from the curve) and 69
non-detections along the curve. The LMD model also predicts a brightness at the winter 70
poles exceeding 100 kR, which was never detected Finally, Gagn´e et al. (2013) pointed 71
out another discrepancy between the data and the model: the large variability for the 72
altitude of the peak is not reproduced by the LMD model. 73
We here use detections and non-detections of the NO δ and γ bands by SPICAM to 74
investigate the dynamics of the nightside upper atmosphere of Mars. The dataset used 75
in this study covers the years 2003-2013, almost a full solar cycle. Results shown in 76
this study will provide comparative information useful for the future observations of the 77
Martian UV nightglow by the Imaging UltraViolet Sprectrograph (IUVS) on board the 78
MAVEN spacecraft and useful information for future improvements of GCMs. 79
2. Observations
The Mars Express spacecraft travels along a nearly polar eccentric orbit with a period 80
of 6.72 hour, a periapsis of about 300 km and an apoapsis of 10,100 km. The SPICAM 81
instrument on board Mars Express is composed of both an UV and an infrared spectrom-82
eter. The UV spectrometer covers the range from 118 to 320 nm, which includes the 83
totality of the NO δ and γ bands, from 190 to 300 nm. 84
We use measurements from the UV spectrometer SPICAM in limb profile mode, de-85
scribed by Bertaux et al. (2006) and Cox et al. (2008). A typical observation lasts ∼20 86
minutes with one spectrum recorded every second in each of the 5 spatial bins (adjacent 87
segments of the CCD) of the instrument. A spectrum can be collected after photons travel 88
through either a small (50 µm) or a wide (500 µm) slit, providing a spectral resolution of 89
1.5 and 6 nm respectively. The spatial vertical resolution depends on the distance between 90
the spacecraft and the atmosphere of Mars, and may be as small as a few kilometers when 91
the spacecraft is close to the planet. The field of view of a single SPICAM pixel is 40x40 92
arcsec. 93
This study also includes the SPICAM observations performed in stellar occultation 94
mode, as described by Bertaux et al. (2006) and Gagn´e et al. (2013). During a stellar 95
occultation observation, the spacecraft pointer is directed to a star, hence providing an 96
absolute calibration of the emission by subtracting the known star brightness. The tech-97
nique used to retrieve the NO emissions from stellar occultations was described by Royer 98
et al. (2010) and developed to study the nitric oxide emissions in the upper nightside 99
atmosphere of Venus. 100
These two techniques provide a large dataset of 5000 observations among which more 101
than 200 present identifiable NO emissions. In the limb viewing mode, 700 observations 102
are contaminated by photons from the bright dayside, which is orders of magnitude 103
brighter than the nitric oxide emission. These 700 observations have therefore been ignored 104
in the data analysis. 111 observations do not allow defining the peak brightness and 105
altitude because of very low emissions, which are typically under 0.2 kR. 1789 observations 106
show no detectable NO emission. 107
3. Results
We here analyze correlations between the peak brightness and altitude and factors 108
such as geographical location and solar flux influence. A large inhomogeneity appears in 109
the detection of the nitric oxide δ and γ bands. Figure 1 shows the distribution of the 110
observations (panel a) and ratio of the number of positive detections by the number of 111
observations (panel b) performed by SPICAM in the limb viewing mode for different F10.7 112
indices encountered during the 2003-2013 period. We present two sets of F10.7 values. 113
The upper axis shows the value of the F10.7 index recorded at the time of the observation 114
at Earth. The lower axis shows the F10.7 solar flux corrected for the distance between 115
the Sun and Mars and the solar longitude of Mars during the observations with respect to 116
the solar longitude of the Earth. The latter values also take into account the eccentricity 117
of the Martian orbit. Gagn´e et al. (2013) showed that the number of detections increases 118
with the solar flux. This result was reproduced by the LMD simulations. We statistically 119
confirm this long term variability. Figure 1 panel a shows a decrease in the number of 120
observations as the solar flux increases. We show in Figure 1b the ratio between the 121
number of positive detections of the NO airglow and the total number of detections, for 122
increasing solar fluxes. This is an indicator of more numerous positive detections for higher 123
solar activity conditions. No relation between the solar activity and the peak brightness 124
was however found. The analysis of this unexpected result is beyond the scope of this 125
paper and is a potential topic for future work. 126
Cox et al. (2008) showed the lack of correlation between the peak altitude and bright-127
ness. This result was then confirmed by Gagn´e et al. (2013). Cox et al. (2008) found a 128
mean peak brightness and altitude of the NO emission of 1.2 ± 1.5 kR at 73 ±8.2 km. 129
Gagn´e et al. (2013) found 4 ± 3.5 kR at 83 ± 24 km. Here, we find an average peak 130
for the nitric oxide δ and γ bands of 5 ±4.5 kR located at 72 ± 10.4 km (see Table 1). 131
We find identical results when using the same dataset as Cox et al. (2008). Our results 132
are consistent with those from the study led by Gagn´e et al. (2013). The altitude of the 133
peak is consistent in the three studies. The peak brightness and altitudes range from 0.23 134
to 18.51 kR and from 42 to 97 km. The emission layer (from 40 to 100 km) is larger 135
than the one (from 60 to 80 km) predicted by the LMD model (Gonzal`ez-Galindo et al. 136
(2009)), but in good agreement with the results obtained from stellar occultations. One 137
preliminary result found by Cox et al. (2008) is not reproduced in this extensive study: 138
the altitude of the emission peak does not seem to be controlled by the planetocentric lat-139
itudinal position of the emission (Stiepen, 2014). Finally, peaks in the emission profiles 140
close to the winter poles are brighter than those near the equator. 141
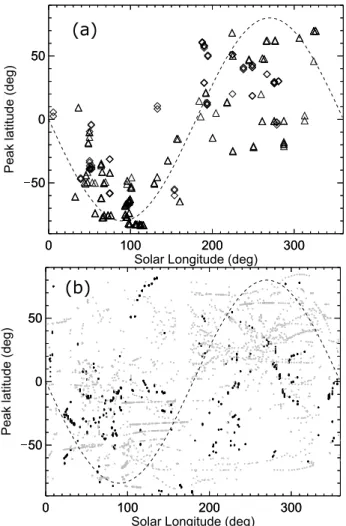
Both SPICAM stellar occultations and limb viewing observations are represented in a 142
latitude/solar longitude map in Figure 2. In panel 2a, triangles represent the detections 143
in stellar occultation mode while diamonds are detections in limb viewing mode. In panel 144
2b, grey dots show the locations of the non-detections in stellar occultation mode and 145
black dots refer to non-detections in limb viewing mode. 146
The analysis of the brightness at different latitudes and seasons is presented in Figure 147
3. In figure 3, all observations are combined to construct an extensive dataset of ∼200 148
detections. Panel a shows the mean brightness in each 5◦ latitude/ 10◦ solar longitude 149
bin, panel b shows the 1-σ variability of the brightness in each bin, and panel c shows the 150
number of observations in each bin. 151
Figures 2 and 3 summarize all observations and compare with the outputs from the 152
LMD model (see figure 5 from Gagn´e et al., 2013). The model roughly reproduces the 153
location where the NO nightglow is detected. There are however many non-detections 154
within regions where the NO airglow is predicted to be bright and detections have been 155
made in the equatorial region. Figure 3 shows an analysis of the variability of the emission. 156
The LMD model reproduces well the mean brightness of the emission (Figure 3, panel 157
a). The mean number of observations in each bin is ∼10, as shown in Figure 3 panel c. 158
The standard deviation of the mean brightness illustrates the variability of the emission 159
for similar conditions (Figure 3 panel b). The variability can reach 8 kR, slightly less 160
than 50% of the peak brightness of the brightest profiles. This variability cannot be 161
reproduced in averaged simulations. The causes of this variability is unknown. Potential 162
candidates to explain this variability include Eddy diffusion, wave drag and changes in 163
the global circulation. This variability is an important constraint for future developments 164
of atmospheric models. 165
4. Conclusions
The SPICAM instrument on board Mars Express spacecraft has observed the nitric 166
oxide emission in two different viewing modes: tangential limb and stellar occultations. 167
We merged the two datasets to carry out an extensive survey of the nitric oxide δ and γ 168
bands nightglow for almost a full solar cycle (2003-2013). The nitric oxide nightglow is a 169
tracer of the dynamics of the upper atmosphere of Mars, useful to constrain the summer-170
to-winter hemispherical transport. We show that the number of detections increases with 171
the solar activity, despite a lack of correlation between the F10.7 index and the brightness 172
of the NO nightglow. The detection rate is also higher in specific regions: they are more 173
frequent closer to the winter pole. The detections seem to be roughly distributed along a 174
latitude = -80 sin(Ls) curve, in agreement with LMD simulations. The characteristics of 175
the emission peak are analyzed and no correlation with geographical or solar flux related 176
factors is found, in contradiction with conclusions from Cox et al. (2008). We find the 177
peak of the nitric oxide δ and γ bands vertical profiles of 5 ± 4.5 kR situated at 72 ± 10.4 178
km. The peak brightness and altitudes range from 0.23 to 18.51 kR and from 42 to 97 km. 179
We have constructed maps of the brightness of the nitric oxide emission and its variability, 180
which show that the emission is highly variable, even for similar conditions, with variations 181
that may reach 50% of the brightest profiles. This in an indicator of variations in 182
the N fluxes at time scales shorter than a Martian year. Similarly, discrepancies in the 183
regions of the detections between the data and the model are indicators of short-term 184
variations of the N flux or the circulation pattern likely caused by changes in the Eddy 185
diffusion, the wave drag and the global circulation. These questions will be investigated 186
in future comparisons between the data and the model. This study may also define future 187
investigations using the IUVS-MAVEN measurements of the nitric oxide nightglow. 188
Acknowledgments. The authors thank the SPICAM and the Mars Express teams 189
for the excellent quality of their work. A. Stiepen was supported by the PRODEX 190
program of the European Space Agency (ESA) managed with the help of the Belgian 191
Space Policy Office (BELSPO), Belgian American Education Foundation and Rotary 192
District 1630. Data used in this study are available from ESA planetary science archives 193
(http://www.rssd.esa.int/index.php?project=MARSEXPRESS&page=file tracker&reversed=on). 194
The authors would also like to thank Jane Fox for her useful comments. 195
References
Bertaux, J.-L. et al., 2005. Nightglow in the upper atmosphere of Mars and implications 196
for atmospheric transport. Science, 307, 566-569. 197
Bertaux, J.L. et al., 2006. SPICAM on Mars Express: Observing modes and overview of 198
UV spectrometer data and scientific results. J. Geophys. Res. 111, 10. 199
Cox, C., Saglam, A., G´erard, J.-C., Bertaux, J.-L., Gonzal`ez-Galindo, F., Leblanc, F., 200
Reberac, A., 2008. Distribution of the ultraviolet nitric oxide martian airglow: Obser-201
vations from Mars Express and comparisons with a one-dimensional model. J. Geophys. 202
Res. 113, E08012. 203
Gagn´e, M.-E., Bertaux, J.-L., Gonzal`ez-Galindo, F., Melo, S., Montmessin, F. and Strong, 204
K., 2013. New nitric oxide (NO) nightglow measurements with SPICAM/MEx as a 205
tracer of Mars upper atmosphere circulation and comparison with LMD-MGCM model 206
prediction: Evidence for asymmetric hemispheres. J. Geophys. Res., 118. 2172-2179, 207
doi: 10.1002/jgre.20165. 208
Gonzal`ez-Galindo, F., Forget, F., Lopez-Valverde, M.A., Angelats I Coll, M. and Millour, 209
E., 2009. A ground-to-exosphere Martian general circulation model: 1. Seasonal, diurnal 210
and solar cycle variations of thermospheric temperature. J. Geophys. Res., 114, E04001, 211
doi:10.1029/2008JE003246. 212
Gonzal`ez-Galindo, F., Maatanen, A., Forget, F., Spiga, A., 2011. The Martian mesosphere 213
as revealed by CO2 cloud observations and General Circulation Modeling. Icarus, 216, 214
10-22, doi:10.1016/j.icarus.2011.08.006. 215
Lopez-Valverde, M.A., Sinnabend, G., Sornig, M., Kroetz, P., 2011. Modelling the atmo-216
spheric CO2 10 µm non-thermal emission in Mars and Venus at high spectral resolution. 217
Planet. Space Sci. 59, 10, 999-1009, doi:10.1016/j.pss.2010.11.011. 218
Royer, E., Montmessin, F., Bertaux, J.L., 2010. NO emissions as observed by SPICAV 219
during stellar occultations. Planet. Space Sci. 58, 1314?1326. 220
Stiepen, A., 2014. Dynamics and composition of Mars and Venus upper atmospheres ob-221
served by the ultraviolet spectrographs on board Mars Express and Venus Express. PhD 222
thesis. Laboratory for Planetary and Atmospheric Physics, University of Li`ege, Belgium. 223
http://bictel.ulg.ac.be/ETD-db/collection/available/ULgetd-03192014-163601/ 224
10 20 30 40 50 60 70 Solar activity at Mars (F10.7 index) 0 100 200 300 400 500 600 Occurences
40 Solar activity at Earth (F10.7 index)60 80 100 120 140
(a) 25 30 35 40 45 50 55 60 0.0 0.2 0.4 0.6 25 30 35 40 45 50 55 60 F10.7 at Mars 0.0 0.2 0.4 0.6 Ratio detections/observations (b)
Figure 1. Distribution of the NO δ and γ bands detections as a function of solar activity. The distribution SPICAM observations is shown on panel a. Panel b shows the ratio between the positive detections of the NO emission and all SPICAM observations. Solar activity is represented by the F10.7 index values at Earth and at Mars.
Table 1. NO nightglow peak characteristics
Cox et al. (2008) Gagn´e et al. (2013) This study
Mean peak brightness (kR) 1.2 4 5
Standard deviation (kR) 1.5 3.5 4.5
Peak brightness range (kR) 0.2 - 10.5 0.5 - 10 0.23 - 18.51
Mean peak altitude (km) 73 83 72
Standard deviation (km) 8.2 24 10.4
0 100 200 300 50
0 50
0 100 200 300
Solar Longitude (deg) 50
0 50
Peak latitude (deg)
(a) 0 100 200 300 50 0 50 0 100 200 300
Solar Longitude (deg) 50
0 50
Peak latitude (deg)
(b)
Figure 2. Mapping of the nitric oxide detections. A latitude/solar longitude map of the NO observations performed in limb scan and stellar occultation modes is presented. Panel a shows the detections of the NO nightglow. Triangles are detections performed in stellar occultation mode and diamonds show the detection made in limb viewing mode. Panel b shows the non-detections. Grey dots refer to the stellar occultation mode and black dots show the non-detections in limb viewing mode. In both panels, the line represents the curve latitude = -80 sin(Ls). Less than 5% of the observations led to detection of NO nightglow.
Figure 3. Mapping of the nitric oxide intensity and variability. Panel a shows the brightness of the peak averaged in 5◦ latitude and 10◦ solar longitude bins. The one-sigma standard deviation of these mean values is showed in panel b. In panel a and panel b, the color bar indicates the intensity in kR. Panel c shows the number of observations within