HAL Id: hal-00724569
https://hal.archives-ouvertes.fr/hal-00724569
Submitted on 21 Aug 2012
HAL is a multi-disciplinary open access
archive for the deposit and dissemination of
sci-entific research documents, whether they are
pub-lished or not. The documents may come from
teaching and research institutions in France or
abroad, or from public or private research centers.
L’archive ouverte pluridisciplinaire HAL, est
destinée au dépôt et à la diffusion de documents
scientifiques de niveau recherche, publiés ou non,
émanant des établissements d’enseignement et de
recherche français ou étrangers, des laboratoires
publics ou privés.
A subjective and objective evaluation of a realistic 3D
IPTV transmission chain
Pierre Lebreton, Alexander Raake, Ulf Wustenhagen, Thomas Buchholz,
Marcus Barkowsky, Patrick Le Callet
To cite this version:
Pierre Lebreton, Alexander Raake, Ulf Wustenhagen, Thomas Buchholz, Marcus Barkowsky, et
al..
A subjective and objective evaluation of a realistic 3D IPTV transmission chain.
19th
International Packet Video Workshop (PV), May 2012, Munich, Germany.
pp.
179 - 183,
A subjective and objective evaluation of a realistic
3D IPTV transmission chain
Pierre Lebreton
1,3, Alexander Raake
1 1Assessment of IP-Based Applications Telekom Innovation Laboratories, TU Berlin
Ernst-Reuter-Platz 7 10587 Berlin, Germany
Ulf W¨ustenhagen
2, Thomas Buchholz
22
Deutsche Telekom AG Telekom Innovation Laboratories
Winterfeldtstrae 21 10781, Berlin, Germany
Marcus Barkowsky
3, Patrick Le Callet
33
LUNAM Universit´e, Universit´e de Nantes IRCCyN UMR CNRS 6597, Polytech Nantes
Rue Christian Pauc BP 50609 44306 Nantes Cedex 3, France
Abstract—In 3D transmissions, often a large perceptual quality gain can be achieved by slightly increasing the bitrate. However, at a certain bitrate, a saturation effect is noted and further increasing the bitrate does not lead to significant improvements of Quality of Experience (QoE). This bitrate will be called quality saturation bitrate. The purpose of this paper is to investigate a subjective and objective method to determine the quality saturation bitrate. An evaluation is presented which uses a wide spread of content types and a realistic transmission chain that includes a hardware encoder and commercial Set-Top-Boxes. A subjective assessment for various bitrates is performed using the SAMVIQ methodology and the results are also compared to objective measurements with VQM and VQUAD.
I. INTRODUCTION
3DTV is the next step for television. However, to ensure high acceptance of a 3DTV service it is necessary to transmit high quality videos even though the additional bit rate required is high. Quality monitoring of 3DTV is then required to ensure that the quality matches to the expectations of the consumers. This quality monitoring can be done at several steps in the transmission chain [1]. In this paper it has been decided to study the transmission of 3D contents. At this stage, a lot of work has already been done to evaluate the quality of 2D sequences using full reference metrics [2], [3], [4]. Some work has also been done in the case of 3D video signals [5] but the question of 3DTV Quality of Experience (QoE) is still not solved. Many questions are still remaining for evaluating the multidimensionality of 3D: picture quality, depth perception and visual discomfort. It has yet to be proven that observers re-ally take into account all these dimensions during a subjective QoE test and furthermore it seems that they most likely con-sider only the 2D QoE [5]. Since 2D QoE quality seems then to drive the subjective scores, 2D video quality metrics can most probably be used for monitoring 3D quality dimensions [5]. In the case of video broadcasting the frame compatible Side-by-side format is frequently used. Several studies have shown that in comparison to other currently employed existing standard, this format already provides good quality while saving a
substantial amount of bitrate compared to other solutions [6] [7]. Questions are nevertheless remaining regarding the required bitrate for insuring high quality services. This is the question addressed in this paper. Using a specific value of bitrate has a cost, moreover the increase of bitrate does not provide a constant increase of quality: from a specific value of bitrate, increasing the bandwith will only results in small quality improvement since the bitrate is high enough to encode the sequence without visible distortion. This threshold value is the saturation point. It is then important for achieving a high quality service at a reasonable cost to evaluate the trade-off between the allocated bandwidth and its impact on the service quality. Determining the saturation point is a first step to this characterization since it specifies the maximum amount of bandwidth which should be considered, since only few observers will see a gain in quality at higher bitrate. However determining the saturation point is not an easy task, a precise measurement of the required bitrate calls for a comparison between many sequences which may have very similar quality which makes the task difficult to the observers. This paper addresses a methodology question: how to succeed this type of evaluation. Two methods are considered: subjective testing and objective metrics using two standardized full reference model: VQM [2] and VQuad [4]. Section 2 of this paper is going to present the generation process of the video signal. Section 3 describes the experiment setup; section 4 provides an analysis of the subjective data and illustrates the difficulty to answer the first question: Determining at which bitrate a quality saturation is reached given a specific set of parameters (profile, structure of group of picture (GOP), motion estimation algorithm...). Section 5 describes the use of objective 2D metrics for the evaluation of 3D video sequences. And finally, section 6 discusses the limits of both approaches.
II. GENERATION OFPVS
The idea is to emulate the real signal chain in a 3DTV broadcasting solution. Therefore the test design consisted of a
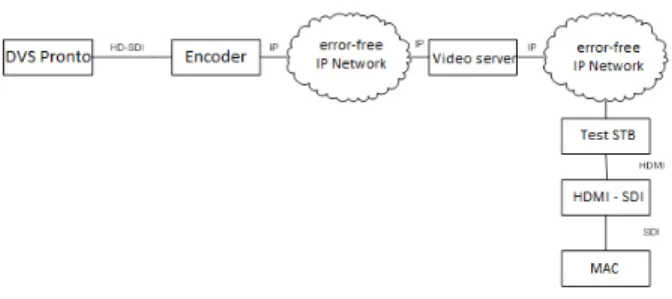
Figure 1. Processing chain for the creation of PVSs
Content Name Description
Bear Sequence from animation movie. Complex motion:
lots of particles, and strong movement; Lots of high frequency texture. 3D with pop-out effect.
Fans Soccer fans with many small details. Complex
mo-tion: fans are moving, shaking flags.
Horse Sequence with strong texture and limited motion:
horse standing and starting running.
Interview Sequence with two persons interviewed. The
back-ground is composed of trees moving in the wind. Limited motion. Some pop-out effect is visible: the arm of the persons comes out the screen.
Match Football match, lots of high frequency texture on the
grass. Fast motion.
Piano Sequence with low spatial and temporal complexity.
Piano player sitting in front of the piano and standing up.
Sea Sequence with sea water during storm. Lots of high
frequency textures. Complex but slow motion. TABLE I
3DVIDEO CONTENT CHARACTERISTICS
live hardware encoder which was fed by a hardware playout server. The encoder’s output was sent to an IPTV server and finally the signals were streamed to a test set top box. The HDMI output of that set top box was captured and recorded on a MacPro equipped with a video acquisition interface card. The sequences were then stored using the Apple ProRes 422 (hq) codec at a bit rate of around 180 mbit/s. The setup of the recording can be seen in Figure 1.
Afterwards the sequences were edited by means of Final Cut Pro without changing the format of the recorded clips to extract the video sequences selected for evaluation after stabi-lization of the encoder. The experimental condition consisted of using the hardware encoder at ten different bit rate values (5, 7.5, 10, 12, 14, 16, 18, 20, 22, 24Mbps) and a software encoder at one bit rate value (7.5Mbps). Seven different source signals were chosen, the sequences had different spatial, temporal and depth complexity. A short description of the sequences is provided in Table I
III. SUBJECTIVE TEST METHOD
The subjective test methodology SAMVIQ was chosen [8]. This methodology consists of presenting several set of video sequences to the observers. In each set, several sequences are presented. These sequences contain the same source signal but with different processing. The observers can choose a video from the proposed sequences within the set, watch it
Figure 2. Subjective experiment interface used for the evaluation of the video sequences
Figure 3. Setup of the laboratory environment
and rate it. One of the sequences is clearly identified as the reference, and one is a hidden reference. The observers can repeatedly watch each sequence and adjust the respective rating. After having watched and graded all videos of one set he can continue to the next one. The choice of SAMVIQ was motivated by the fact that this methodology gives the ability to compare different video signals to an explicit reference which helps the observers to evaluate the quality of a specific sequence. The eventual repetitions provide the ability to adjust the rating which is useful in the case of this study since many conditions had similar high quality. Providing an explicit reference and a way to adjust a given score could help the subject to evaluate the different sequences. This is confirmed in previous studies which shows that SAMVIQ can be more stable as ACR if the observer uses the re-play feature [9].
The test condition was set in accordance to the ITU-R Recommendation BT.500-12 [10]. The viewing distance was 3 times the height of the screen (3H). The playback computer was a Pentium Core i7 PC with a graphic card which had an HDMI output. The Stereoscopic Player [11] which was used for playback of all videos was running in full screen mode on the secondary display. The 3D sequences were displayed on a commercial Sony 52” TV screen using shutter glasses, the interface for the subjective testing was presented on another PC display connected to the same computer (see in Figure 3). The test subjects were people which are involved in research and development, but no professionals who are working on a daily basis on i.e. TV editing or production. 19 subjects were participating. The task was demanding: finding small differences in steps of 2 mbits/s between 10 and 24 mbit/s.
! " # $% &# !& #& '& (& && )*+, )-.,+.* / 0+ 1-. 2 ! " # $% &# !& #& '& (& && 3+45 )-.,+.* / 0+ 1-. 2 ! " # $% &# !& #& '& (& && 67,5* )-.,+.* / 0+ 1-. 2 ! " # $% &# !& #& '& (& && 84.*,9-*: )-.,+.* / 0+ 1-. 2 ! " # $% &# !& #& '& (& && ;+.<= )-.,+.* / 0+ 1-. 2 ! " # $% &# !& #& '& (& && >-+47 )-.,+.* / 0+ 1-. 2 ! " # $% &# !& #& '& (& && ?*+ )-.,+.* / 0+ 1-. 2 6+,@:+,*%A4<7@*, 6-@@*4%B*C*,*4<* ?7C.:+,*%*4<7@*,
Figure 4. Subjective quality score per content as a function of the bitrate in
kbps
IV. SUBJECTIVE RESULTS
The subjective scores for each source sequence are depicted in Figure 4. As a first outcome it is visible that with the same set of parameters and at same bitrate the hardware encoder performs better than the software encoder. The differences are statistically significant on a 95% confidence level using the student-t test for three out of the seven contents (Fans, Match, Sea).
As depicted in Figure 4, the confidence intervals are quite large. This is most likely due to the difficulty of the task asked to the observers: many conditions had high quality and it was therefore difficult for the observers to be able to give accurate absolute quality ratings. However since the SAMVIQ methodology was employed, observers had the opportunity to compare each sequence to another one. Comparing the sequences gave them the ability to reveal their preference of one sequence compared to another one: on a compression artefact scale. Even though it was hard for them to give absolute subjective scores, in most cases they were able to provide relative ratings. The Spearman Rank Order Correlation of each individual observer is depicted in Table II. To build this matrix the coding conditions with the hardware encoder have been considered, and it is believed that increasing the bitrate will decrease the value of the quantification parameters and therefore increase the quality. Subjective scores should then follow this evolution. If there would have always been a clear improvement of the quality with increasing bitrate, the observers might have obtained a Spearman Rank Order Correlation of 1. But since the task was demanding, the observers did not provide that accuracy. Based on this analysis three different observers appear to be outliers and their results were removed for the analysis in the remainder of this paper (They are the observers 5, 8 and 11, visible in Table II).
!"# $"% &'#(! )%*!#+,!- ."*/0 1,"%' 2!" 3+45675
89(!#+!#:6; <5=> <5?< <5;? ;5<< @<5<; <5?A @<5<; <5AB
89(!#+!#:6? <5C< <5D> <5;> <5?> <5BD @<5<E @<5?E <5?C
89(!#+!#:6A <5=A <5?B <5A; <5?> <5CA <5<E <5BD <5BB
89(!#+!#:6B <5C< <5E> <5;A <5D; <5;D @<5A; @<5?E <5?E
89(!#+!#:6D <5A= @<5<D @<5<E <5?? <5E> @<5?D @<5;> <5;;
89(!#+!#:6E <5>D @<5?E <5=D <5<A <5>A <5B? <5A? <5B<
89(!#+!#:6> <5>D <5C< <5AA <5DD <5;D <5BB <5<> <5BD
89(!#+!#:6= <5;D @<5EB <5<> <5AB @<5;E @<5;> @<5?D @<5<C
89(!#+!#:6C <5CE <5=D <5A? <5;D @<5;> @<5?E <5DE <5AB
89(!#+!#:6;< <5== <5EE @<5<D <5ED @<5;E <5;< <5?B <5AA
89(!#+!#:6;; @<5A; <5<? @<5;> @<5;C @<5?= @<5;= @<5<; @<5;E
89(!#+!#:6;? <5=< <5>; <5;? <5=D @<5A< <5>B <5=E <5DB
89(!#+!#:6;A <5>C <5<C <5;> <5=D @<5?C <5EC <5;= <5AE
89(!#+!#:6;B <5?C <5C< <5A; @<5;B <5DC @<5>< <5?C <5??
89(!#+!#:6;D <5=E <5<> <5?; <5=> @<5;C @<5;E <5B< <5?C
89(!#+!#:6;E <5?D <5B< <5E; <5?B <5DB <5AB @<5<E <5AA
89(!#+!#:6;> <5CB <5DD <5;D <5=A <5>D @<5<? <5DD <5DB
89(!#+!#:6;= <5DB @<5D> <5BE <5AB <5<D <5?B <5?C <5;C
89(!#+!#:6;C <5>D <5DE <5DD @<5;; <5<C <5;> <5=B <5B;
3+45689(5 <5ED <5A; <5?B <5B< <5;C <5<> <5?;
TABLE II
SPEARMAN RANK CORRELATION OF EACH INDIVIDUAL OBSERVER !"# $"% &'#(! )%*!#+,!- ."*/0 1,"%' 2!" 34(56 67 68 69 :;$ <=> <=> 6? 34(57 68 6@ 67 67 6@ 6@ 69 34(5A 68 67 <=> 67 7@ 6@ 67 34(59 67 67 6@ 67 69 <=> 6@ 34(58 68 6@ 68 68 67 6@ 69 34(5< 69 69 6@ 69 67 67 6@ 34(5B 79 7@ 6@ 6@ 69 <=> 69 34(56@ <=> 68 67 67 6@ 67 6@ 34(567 <=> 67 67 7@ 6@ <=> 69 34(56A 67 6@ 67 <=> 69 67 6@ 34(569 67 6? 68 67 69 6@ 68 34(56> 67 67 <=> 68 69 6@ 7@ 34(568 6@ 69 69 68 6@ 69 69 34(56< 7@ 68 :;$ 67 69 6@ <=> 34(56? 69 6@ 6@ 67 67 67 67 34(56B 7@ 67 <=> 69 6@ 6@ 69 C+D= 69=@8 6A=A? 66=A< 6A=6< 67=A9 6@=6A 6A=@B
TABLE III
BITRATE THRESHOLD FOR PERCEIVED QUALITY DIFFERENCE IN MBPS
One of the objectives of the paper is to determine the bitrate value from which an increase of bitrate will not provide an increase of quality perceivable by the observers. Considering the size of the confidence intervals, it is proposed to use the fact that using SAMVIQ, even though observers had diffi-culties to agree on an absolute quality value for a sequences they were at least able to order the sequences. Then, it is possible to check the monotony of the quality score; this should be in accordance with the increase of bitrate. The point from which this agreement is broken, should be then assumed to be the point were observers were not able anymore to see the difference between the quality of the sequences. The bitrate threshold is then obtained at this specific value. Table III provides for each observer and for each content the bitrate threshold determined as proposed previously. It is then proposed for each content to take the average value of the bitrate value obtained for each observer as the expected threshold.
V. OBJECTIVEEVALUATION
To evaluate the quality of broadcasted IPTV another typical approach could be the use of objective metrics. It is pro-posed to evaluate the accuracy of two standardized models
!" !# !$ !% !& !' !( " # $ % & ' ( ) * " +,-./010234.-5604 7 89 :0 ;< =>0 .-? 7 @032 A31B C52B0 D1<02>=0E -3<;F G=315 703
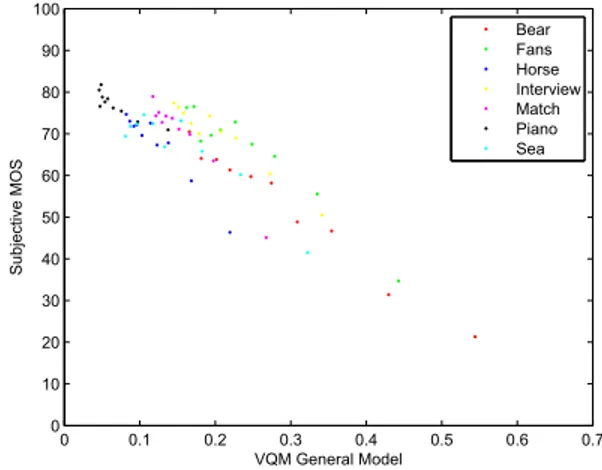
Figure 5. Results of the VQM general model
in evaluating the quality of 3D video sequences: VQM and VQuad. The models were run on video sequences with the side-by-side representation. Figure 5 depicts the performance of VQM on the previously presented database. The model achieves good performance with a Pearson correlation of 0.8947 and a RMSE of 5.4 (after a linear mapping to a 0-100 scale: MOSe = -119.6 * VQM + 86.92). It should be noted that the subjective scores of the video sequences are mainly between 50 and 80 which may result in a high value of Pearson correlation. Figure 6 depicts the performance of VQuad on the proposed database. This second model achieves lower performance on the studied database: it shows a person correlation of 0.7586 and a RMSE of 8.2 (after a linear mapping to a 100 scale: MOSe = 17.49 * VQuad + 4.628). It should be taken into account that the VQuad model is able to handle video sequences with packet losses which VQM does not. Therefore we can argue this may have an influence on the performance when only high quality sequences are considered VQM is more appropriate to evaluates the quality of encoded sequences before transmission, VQuad would be more suited for the evaluation of video sequences at the end of the transmission chain. Indeed VQuad was designed to evaluate the quality of video sequences with both compression and transmission impairment. Since transmission impairments is a dominant artefact compared to coding, the development of VQuad does not seems to have been too much focused on transmission-error-free sequence. And then, the accuracy is lower for the specific scope of our study. VQM seems then more suited for this transmission-error-free test.
Considering the performance of the VQM model, a second aspect of this study is to attempt to determine the bitrate corresponding to the quality saturation using an objective method. Figure 7 depicts for each content the subjective and objective quality evaluation as a function of the logarithm of the bitrate. It can be noticed that some sequences may still increase their quality outside of the evaluation interval (strongly for Bear, Fan; less for Interview and Sea, and only slightly for Horse, Match and Piano).
! " # $ % & ! " # $ % & ' ( ) ! *+,-. / ,0 12 34 562 789 / :2-; <-=> ?@;>2 A=42;652B 8-43C D5-=@
Figure 6. Results of the VQuad model
In the following evaluation, a different method to identify the quality saturation bitrate is proposed. The VQM algorithm have only been used as an example of an objective metric. The idea is based on from the observation that at very high bitrates the quality of the video tends to converge and once a certain quality level is reached an increase of bitrate does not provide significant increases of visual quality. In the specific instantiation of this study, according to the fitting, the maximum visual quality is reached at 89.5 MOS (but could de however different in another experiment). It may be anticipated that the subjects are not capable of appreciating the quality gain related to a video that is above a certain threshold, for example 95% of this maximum quality. In that case, a certain bitrate can be saved by identifying with the VQM algorithm which bitrate corresponds to 95% of the maximum quality. In this evaluation, the value for 24Mbps has been used as the maximum quality prediction. A linear fitting has been performed on the log-bitrate/quality scale and the 95% as well as the 90% quality points have been extracted. The results are presented in Table IV. The equivalency of these results in subjective score is given in Table V
These results provide a range of bitrates which matches to the subjective bitrate threshold determined in the previous section. This may provide an instrumental method to estimate a range of bitrates around the saturation point.
It should be noted that for the piano sequence, most ob-servers inverted their preference already at very low bitrate, mostly at the second or third bitrate step. The objective method provides in this case a value which is even lower than the smallest possible value obtained from the subjective experiment (7.5Mbps). Considering the subjective experiment method, the objective metric might even provide a better estimation in this particular case.
VI. CONCLUSION
In this paper a subjective evaluation of a realistic trans-mission chain has been presented. The subjective experiment targeted the evaluation of the bitrate value from which an
!" # #!" $% &% '% (% % $%% )*+, !" # #!" $% &% '% (% % $%% -+./ !" # #!" $% &% '% (% % $%% 01,/* !" # #!" $% &% '% (% % $%% 2.3*,45*6 !" # #!" $% &% '% (% % $%% 7+389 !" # #!" $% &% '% (% % $%% :5+.1 !" # #!" $% &% '% (% % $%% ;*+ <1=>)53,+3*?>@AB/CC D E+ F53 G HD7 ;EAI*8354*?J*/3
Figure 7. Objective and subjective video quality as a function of the logarithm of the bitrate
Content Name 95% Max Quality 90% Max Quality
Bear 17.3Mbps 16.3Mbps Fans 18Mbps 14.4Mbps Horse 14.6Mbps 8.6Mbps Interview 16.5Mbps 11.7Mbps Match 12.3Mbps 8.8Mbps Piano 5.9Mbps 5.2Mbps Sea 16.7Mbps 12.3Mbps TABLE IV
BITRATE VALUE FROM WHICH90%AND95%OF THE MAXIMUM OBJECTIVE QUALITY IS ACHIEVED
increase of bitrate does not provide a visible increase of quality when evaluated by expert viewers. A possible application may be to tune a commercial service such a way that an optimal trade-off between amount of bandwidth and service quality is reached. Determining the saturation point was then a first step to the characterization of what bitrate value should be used for transmitting a specific sequence. The difficulty of performing a subjective experiment requiring the comparison of many similar high quality sequences was illustrated. It has then been proposed to use the ranking obtained by the SAMVIQ methodology to determine this threshold. As a
Content Name 95% Max Quality 90% Max Quality Subj. threshold
Bear 66.96 63.43 58.20 Fans 72.49 68.67 73.74 Horse 70.92 67.19 67.45 Interview 73.49 69.61 72.69 Match 73.48 69.61 71.55 Piano 76.48 72.45 75.45 Sea 65.95 62.47 69.71 TABLE V
SUBJECTIVE VALUES CORRESPONDING TO90%AND95%OF THE MAXIMUM OBJECTIVE QUALITY IS ACHIEVED AND SUBJECTIVE SCORE CORRESPONDING TO THE BITRATE THRESHOLD DEFINED SUBJECTIVELY
second result, two standardized objective metric (VQM and VQuad) have been used to estimate the quality of the 3D video sequences. The VQM model has shown good performance on the proposed database and seems to be appropriate for tuning the settings of an encoder. As a last result the paper describes a way to determine an interval of bitrate around the quality saturation point using an objective measurement method.
REFERENCES
[1] A. Takahashi, D. Hands, and V. Barriac, “Standardization activities in the ITU for a QoE assessment of IPTV,” Communications Magazine, IEEE, vol. 46, no. 2, pp. 78 – 84, February 2008.
[2] ITU-T Recommendation J.144, “Objective perceptual video quality measurement techniques for digital cable television in the presence of a full reference,” 2004.
[3] ITU-T Recommendation J.247, “Objective perceptual multimedia video quality measurement in the presence of a full reference,” 2008. [4] ITU-T Recommendation J.341, “Objective perceptual multimedia video
quality measurement of hdtv for digital cable television in the presence of a full reference,” 2011.
[5] A. Benoit, P. L. Callet, P. Campisi, and R. Cousseau, “Quality assess-ment of stereoscopic images,” in IEEE International Conference on Image Processing , ICIP, San Diego, California, USA, 2008, pp. 1231– 1234.
[6] P. Lebreton, A. Raake, M. Barkowsky, and P. L. Callet, “A subjective evaluation of 3D IPTV broadcasting implementations considering coding and transmission degradation,” in IEEE International Workshop on Multimedia Quality of Experience, MQoE11, Dana Point, CA, USA, 2011.
[7] K. Wanga, M. Barkowsky, R. Cousseau, K. Brunnstr¨om, R. Olsson, P. L. Callet, and M. Sj¨ostr¨om, “Subjective evaluation of HDTV stereoscopic videos in IPTV scenarios using absolute category rating,” in Electronic Imaging, 2011.
[8] F. Kozamernik, V. Steinmann, P. Sunna, and E. Wyckens, “SAMVIQ-A New EBU Methodology for Video Quality Evaluations in Multimedia,” SMPTE Mot. Imag., pp. 152–160, April 2005.
[9] Q. Huynh-Thu, M. Brotherton, D. Hands, and K. Brunnstrm, “Exam-ination of the SAMVIQ subjective assessment methodology,” in Third Inter. Workshop on Video Processing and Quality Metrics for Consumer Electronics, Scottsdale, AZ, USA, 2007.
[10] ITU-R Recommendation BT.500-12, “Methodology for the subjective assessment of the quality of television pictures,” 2009.