HAL Id: in2p3-00020105
http://hal.in2p3.fr/in2p3-00020105
Submitted on 7 Oct 2003
HAL is a multi-disciplinary open access
archive for the deposit and dissemination of sci-entific research documents, whether they are pub-lished or not. The documents may come from teaching and research institutions in France or abroad, or from public or private research centers.
L’archive ouverte pluridisciplinaire HAL, est destinée au dépôt et à la diffusion de documents scientifiques de niveau recherche, publiés ou non, émanant des établissements d’enseignement et de recherche français ou étrangers, des laboratoires publics ou privés.
The Virgo data acquisition system
F. Acernese, P. Amico, N. Arnaud, C. Arnault, D. Babusci, G. Ballardin, F.
Barone, M. Barsuglia, F. Bellachia, J.L. Beney, et al.
To cite this version:
F. Acernese, P. Amico, N. Arnaud, C. Arnault, D. Babusci, et al.. The Virgo data acquisition system. IEEE NPSS Real Time Conference 13, May 2003, Montreal, Canada. �in2p3-00020105�
LAPP-EXP-2003-12
September 2003
The VIRGO data acquisition system
Presented by
A. MASSEROT
for VIRGO Collaboration
LAPP-IN2P3-CNRS
9 chemin de Bellevue - BP. 110
F-74941 Annecy-le-Vieux Cedex
Presented at the 13
thIEEE NPSS Real Time Conference
Montreal, Canada, May 18-23, 2003
Manuscript received May 20, 2003.
1 Laboratoire d'Vieux de Physique des Particules,
Annecy-le-Vieux, France.
2 European Gravitational Observatory, Cascina, Italy.
3 INFN sez. Firenze, Università di Firenze and Università di Urbino,
Firenze/Urbino, Italy.
4 Laboratori Nazionali INFN di Frascati, Frascati, Italy. 5 Institut de Physique Nucléaire de Lyon, Lyon, France
6 INFN sez. Napoli, Università di Napoli “Federico II” and Università di
Salerno, Napoli, Italy.
7 Observatoire de la Côte d'Azur, Nice, France. 8 Laboratoire de l'Accélérateur Linéaire, Orsay, France.
9 Ecole Supérieure de Physique et de Chimie Industrielles, Paris, France. 10 INFN sez. Perugia and Università di Perugia, Perugia, Italy. 11 INFN sez. Pisa and Università di Pisa, Pisa, Italy.
12 INFN sez. Roma1 and Università di Roma “La Sapienza”,Roma, Italy ♦ Corresponding author, Chemin de Bellevue, BP110, 74941
Annecy-Le-Vieux (e-mail: [email protected]).
Abstract-- The experimental environment of the Virgo project
is briefly described. We present the current hardware and software architecture of the data acquisition system. Particular emphasis will be given to the timing system used to synchronize the various readouts and controls around the interferometer and to the distributed data collection scheme: its flexibility, modularity and processing capabilities.
I. INTRODUCTION
The VIRGO experiment [1],[2], aims at the detection of gravitational wave signals from cosmic sources like supernovae, pulsars and binary coalescences by measuring the phase difference between laser beams propagating through a large suspended Michelson interferometer (3 km arm length). The main optical scheme of the Virgo interferometer is shown in Fig. 1. All the optical components, mirrors and benches, are seismically isolated by means of complex chains of pendulum acting on the six degrees of freedom called superattenuator [3],[4]. The whole interferometer is placed under ultra high vacuum.
To achieve a maximal sensitivity, all optical cavities have to be resonant and the interferometer locked on the dark fringe. Therefore the optical components are steered in
The Virgo Data Acquisition System
Virgo collaboration
F. Acernese6, P. Amico10, N. Arnaud8, C. Arnault8, D. Babusci4, G. Ballardin2, F. Barone6, M. Barsuglia8, F. Bellachia1,J.L. Beney8, R. Bilhaut8, M.A. Bizouard8, R. Bizzarri12, C. Boccara9, D. Boget1,F. Bondu7, C. Bourgoin2, A. Bozzi2, L. Bracci3, S. Braccini11,
C. Bradaschia11, A. Brillet7, V. Brisson8, L. Brocco12, D. Buskulic1, J. Cachenaut7, G. Calamai3, E. Calloni6, P. Canitrot8, C. Cattuto10, F. Cavalier8, S. Cavaliere6, R. Cavalieri11,
R. Cecchi11, G. Cella11, E. Chassande-Mottin7, R. Chiche8, F. Chollet1, F. Cleva7, T. Cokelaer7, G. Conforto3, S. Cortese2, J.P. Coulon7, E. Cuoco3, S. Cuzon8, V. Dattilo11,
P.Y. David1, M. Davier8, M. De Rosa6, R. De Rosa6, M. Dehamme8, L. Di Fiore6, A. Di Virgilio11, P. Dominici3, D. Dufournaud1, C. Eder8, E. Edward8, A. Eleuteri6, D. Enard2, G. Evangelista6, L. Fabbroni3, I. Ferrante11, F. Fidecaro11, R. Flaminio1,, D. Forest5, J.D. Fournier7, L. Fournier1, S. Frasca12, F. Frasconi11, L. Gammaitoni10, P. Ganau5, M. Gaspard8, G. Gennaro11, L. Giacobone1, A. Giazotto11, G. Giordano4, C. Girard1, G. Guidi3, H. Heitmann7, P. Hello8, R. Hermel1, P. Heusse8, L. Holloway11,
F. Honglie4, M. Iannarelli4, J.M. Innocent7, E. Jules8, A. Kaczmarska1, R. Kassi1, B. Lagrange5, P. La Penna2, M. Leliboux9, B. Lieunard1, O. Lodygensky8, T. Lomtadze11,
V. Loriette9, G. Losurdo3, M. Loupias2, J.M. Mackowski5, E. Majorana11, C.N. Man7, B. Mansoux8, F. Marchesoni10, P. Marin8, F. Marion1, J.C. Marrucho8, F. Martelli3, A. Masserot1,♦, L. Massonnet1, S. Mataguez2,M. Mazzoni3, M. Mencik8, C. Michel5, L. Milano6, J.L. Montorio5, F. Moreau1, N. Morgado5, F. Mornet7, B. Mours1, P. Mugnier1,
F. Nenci11, L. Nicolosi11, J. Pacheco7, A.Pai7, C. Palomba12, F. Paoletti11, A. Paoli2, A. Pasqualetti2, R. Passaquieti11, D. Passuello11, M. Perciballi12, L. Pinard5, R. Poggiani11, P. Popolizio2, E. Porter8, M. Punturo10, P. Puppo12, K. Qipiani6, J. Ramonet1, P. Rapagnani12,
A. Reboux8, T. Regimbau7, V. Reita9, A. Remillieux5, F. Ricci12, F. Richard2, M.Ripepe3, P. Rivoirard8, J.P. Roger9, G. Russo6, J.P. Scheidecker7, S. Solimeno6, R. Stanga3, R. Taddei2, M. Taurina8, J.M. Teuler2, E. Tournefier1, P. Tourrenc7, H. Trinquet7, E. Turri4,
M. Varvella6, D. Verkindt1, F. Vetrano3, O. Veziant1, A. Viceré3, S. Vilalte1, J.Y. Vinet7, H. Vocca10, M. Yvert1, Z. Zhang2
position and orientation by several real-time local and global controls with a typical bandwidth of 10kHz.
Fig. 1. The Virgo optical scheme.
The possibility to study the coherence between any control and monitoring channels is a key feature for the understanding and improvement of the detector. The input error signals, the control algorithm results and the output excitation signals are also permanently collected to monitor the control loops.
The data acquisition system (DAQ) collects the main interferometer output (dark fringe signal) at 20kHz, the data generated by the various interferometer control systems (mirror positions, injection system, detection system[5]) and the environmental noise data (seismometers, microphones, power supply voltages, temperatures, pressures…). The amount of data gives a sustained data flow of 10 MB/s. Thanks to loss-less data compression, this continuous data flow is reduced to about 4 MB/s.
The Virgo detector, located at Cascina near Pisa (Italy), has been built by a French-Italian collaboration. Most of the system described in this paper has been extensively used from February 2001 to July 2002 during the commissioning of the central part of the Virgo[6].
II. THE TIMING SYSTEM
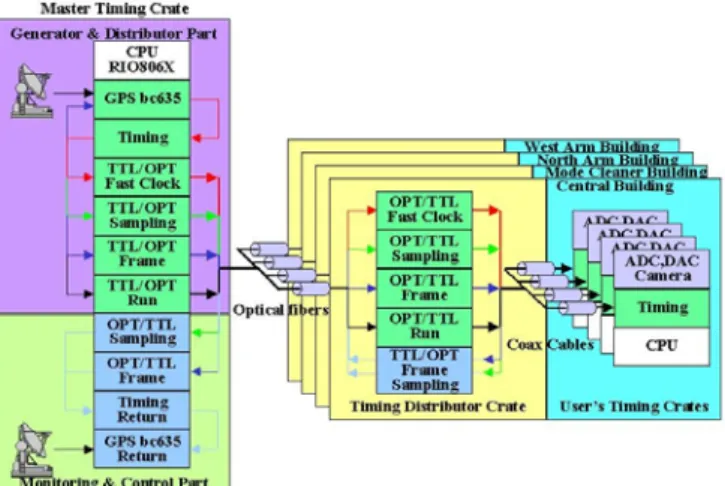
A timing system is required to pace coherently all servo loops and provide an unique time stamp information to each data provider all over the interferometer. The timing system, shown on Fig. 2, is a centralized system with hardwired distribution to local VME Timing boards [7].
Furthermore, to allow coherent data exchange between gravitational waves detectors, the timing system is driven by the Global Positioning System (GPS).
A. Hardware implementation
Derived from the GPS clock, 4 signals are sent to the buildings where the data providers are located. The 4 signals are a common fast clock (2.5MHz) and 3 signals related to DAQ functionalities. The 3 DAQ signals are sampling (20kHz), frame (1Hz) and run. The sampling and frame signals provide the time stamp information and the run signal is used to synchronize it.
Fig. 2. The Timing Architecture.
The bc635/637 VME Time and frequency processor [8] provides a GPS clock (5MHz) to the timing board in the master timing crate, which generates the 4 signals. These 4 signals are translated from TTL to optical and sent using optical fibers to each building: central building, mode cleaner building, north and west end arm buildings. In each building, a distributor crate translates and fans out the optical signals to TTL signals. For each crate involved in control or readout, a timing board receives as input these 4 TTL signals. The programmable VME Timing board allows each data provider to build its own signals by dividing the input fast clock triggered by the input frame. These signals can be used to drive dedicated boards or to enable VME interrupts.
The time stamp information is available on the VME Timing board through two 16bit counters driven respectively by the frame and sampling input signals.
Fig. 3. The Timing delay compensation. The dotted line represents the optical fibers added to have the same propagation time between all buildings.
The frame and sampling signals are sent back from each distributor crate to the master timing crate to monitor the system and measure the propagation time. To compensate the propagation time delay through the two 3km arms, additional fibers have been installed between the central building and mode cleaner distributor crates and the timing master crates, shown in Fig. 3. Fsinally the propagation times have been adjusted with delay lines available on the optical to TTL translator boards [5].
B. Timing Software
A software library has been developed to drive the timing board and ensure the coherence between all Virgo Timing signals. The most often used signals are the detection sampling signal (20kHz), the locking servo-loop signal (10kHz), the alignment servo-loop signal (500Hz) and the camera readout signal (50Hz).
A server, called TiServer and running on a RIO8061 CPU [9], initializes and monitors the timing system. It reads the GPS status information and provides GPS time stamps to the DAQ system at the frame frequency with an accuracy of 1µs.
III. DATA COLLECTION
The data acquisition system collects the environment monitoring data and the digitized information produced by the various active parts of the detector: the laser system, the detection bench, the suspensions and all the equipment intended for control purposes. It deals with signals in a frequency range from a few mHz up to 20kHz.
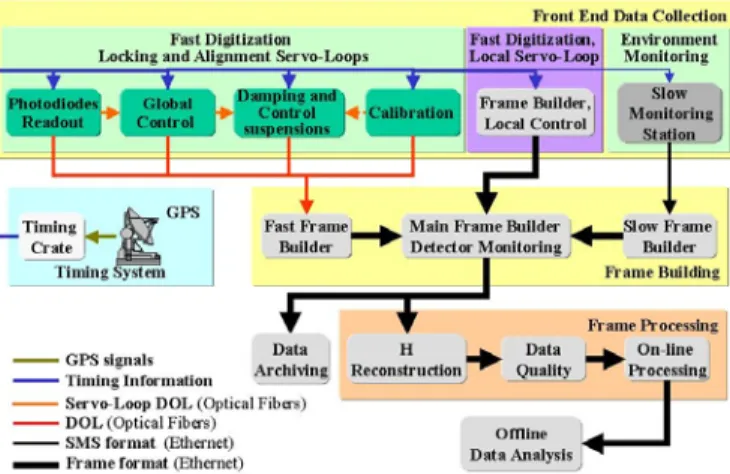
Fig. 4. The Online Architecture
The online architecture, shown in Fig. 4, is structured in three stages: the front-end data collection, the frame builder and the frame processing. The front-end part collects, time stamps the data and send them to the frame building stage. The frame building stage formats all the data related to the same time period as frame[10], merges these frames and tags the merged frames with the GPS time stamp. The frames are then sent to the data archiving system and to the frame processing stage.
All Ethernet network communications are handled by TCP/IP encapsulated by the Cm protocol [11].
A. Front End Data Collection
According to the data provider functionality and the signal sampling frequencies, the channels are collected by the slow monitoring data collection, the digital optical link data collection or directly by a readout frame provider.
1) The slow monitoring data collection
All channels with a sampling frequency less or equal to 1Hz are collected as slow monitoring channels. Only sampling frequencies sub-multiple of 1Hz are available. The vacuum sub-system, the environment sub-system, the laser, detection and suspension slow controls provide the slow
monitoring channels. The slow monitoring data collection is performed through the Ethernet network. Each sub-system has one or more servers, called slow monitoring stations (SMS) that acquire all the data. As the SMS servers do not manage a VME Timing board, they receive a Cm request including the asking GPS time. On reception, each SMS server formats the data as a text string, builds a Cm message that includes the received GPS time stamp and the text string and sends this Cm message to the requester.
2) The digital optical link data collection
Given the required complexity of the feedback loops, the sub-system involved in the locking (10kHz) and alignment (500Hz) control loops, have not the time to build and send their data as frames. The main control loops components are the photodiode readout[5], the global control[12] and the suspension control. The data are sent to the front-end frame builder stage through a VME Digital Optical Link board (DOL)[13].
To allow an online modification of the data channel configuration, a protocol (FbfFormat) has been implemented between the DOL data providers (DOLDP) and the front-end frame builders. The DOL data provider sends a dictionary defining all channel characteristics (name, sampling frequency, bias, offset) and descriptors for the data channel sequences. Each descriptor has a unique identifier. At the loop frequency, a packet is sent through the DOL. Each packet contains the descriptor identifier, the frame and sampling counter values and the data related to this time stamp.
3) The readout frame provider(RFP)
All servers involved in local control use a VME Timing board to pace their loops. Most of these servers run with RIO8062 CPU and have enough time to perform their control algorithm, to format the data as frame ADC channels [10], to compress and send the frames to the frame building stage.
B. Frame Building
The frame building is based on switched Ethernet with fast and Gigabits Ethernet connections. The front-end frame building is performed on VME crates with RIO8062 CPU with a fast Ethernet interface. It collects data from DOLs or directly from specific ADC boards driven by a VME Timing board and builds the frames. When a frame is complete, it is compressed and pushed to the main frame building stage through the Ethernet network as a Cm message. The main frame building is performed on a cluster of XP1000 alpha workstations connected through Gigabits Ethernet.
1) The slow frame builder
The slow frame builder server (FBS) collects the slow monitoring station data. A FBS server does not need specific hardware to ensure its functionality except an Ethernet network access. At most the frame frequency, the FBS receives a Cm interrupt from TiServer with the GPS time stamp and forwards it to the SMS according to their sampling frequencies. On SMS data reception, the FBS builds a frame and stores all the SMS data as serial channels (SER) [10]. If one SER is shared between different SMS, the FBS merges the SMS data in an unique SER. When the
frame is complete or when the waiting time is expired, the FBS sends the frame to a main frame builder.
2) The fast frame builder
The fast frame builder server (FBF) collects the data coming through several DOL boards from DOL data providers or acquires digitized data on the 16bit VME ADC298 boards [14] driven by a VME Timing board.
With the ADC298 boards, thanks to the flip-flop memories, one memory can be read while the other stores the sampled data. The sampling is done at 20kHz and the memory flips at 50Hz. The flip-flop frequency defines the readout frequency. A VME interrupt is generated at the readout frequency on each board. All channels are sampled at 20kHz and the FBF, if needed, performs decimation at the requested sampling frequency.
With the DOL boards, all the FbfFormat packets sent by the DOL data providers are stored in a FIFO. When the receiving FIFO is half full, a VME interrupt is generated on each board to start the readout operation.
The FBF server is implemented with 3 threads. On interrupt request, the first thread reads the data formatted as FbfFormat packets through the VME using the block transfer access driven by the block mover accelerator facility available on the RIO8062 CPU. The second thread unpacks the packets according to their type (dictionary, descriptor or data), builds a frame for each board by filling the frame ADC channels. It merges all frames related to the same time stamp when they are complete. The third thread performs the frame compression and transmission to a main frame builder.
3) The main frame builder
The main frame builder merges the frames built by the different frame providers. It distributes also the data for display, sub data streams and detector monitoring facilities.
The main frame builder (FBM) is implemented using the standard producer/consumers scheme. The producer receives frames sent by the different frame providers, merges the frames related to the same time and tags them with the corresponding GPS time stamp sent by the TiServer. When one frame is complete or the waiting time elapses, the frame is written into a shared memory and made available for the consumers. The frame consumers take their frames from the shared memory and, according to their functionalities, perform dedicated operations (filtering, reduced frames building with selected channels) before sending them to the archiving system, to the display facilities or to additional frame processing.
C. The Online data visualization
The Virgo online data visualization (DataDisplay) allows the users to perform time view representation, correlation, basic frequency analysis (Fourrier Transforms, coherence) or histograms on frame channels. The DataDisplay can access the frame channels by reading frame files or by connecting on a real-time frame provider.
The DataDisplay is based on the Virgo simulation tools SIESTA[15] for the computation and ROOT[16] for the graphical display.
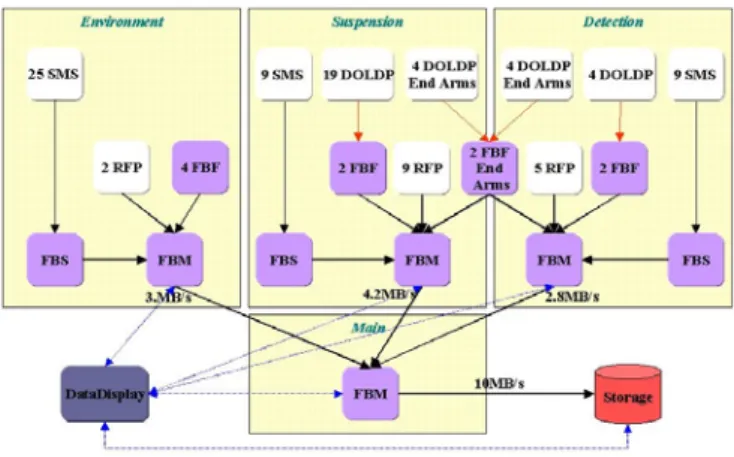
D. The data collection architecture
The data collection architecture used for the commissioning of the Virgo detector is shown in Fig. 5.
During the commissioning of the interferometer, the control strategies require frequent system modifications. Any sub-system data providers can be restarted with a new list of channels and a different data flow without disturbing the work on the other sub-systems. The data should be available with a minimal latency and the real-time visualization tool (DataDisplay) is heavily used.
Given these conditions, the different elements of the data acquisition pipeline are partitioned in three independent lines associated to the main sub-systems plus a main acquisition line. On each data acquisition line, the main frame builder functionality is available with at least 2 consumers. The first consumer sends the frames to the main acquisition level, the second handles online data visualization accesses. On the main acquisition line, at least 3 consumers are running: the first one for the archiving system, the second one for the frame processing and the third one for online data visualization accesses.
For each end arm, the data are digitized locally and sent through fast Ethernet over the 3Km.
Fig. 5. The data collection architecture.
IV. FRAME PROCESSING AND DATA STREAM
A. Frame Processing.
The frame processing stage prepares sub-data streams (data resampled at 50Hz and 1Hz), performs detector monitoring, computes the amplitude of the gravitational physical signal h, qualifies the data and performs a data selection to reduce the data flow. The selected frames are made available for the offline data analysis.
B. Data streams
To monitor and survey the interferometer controls, the 50Hz and trend data streams are added to the main one and built online with low latency using the whole data flow.
1) The main data stream
The daily amount of data collected represents 350GB.The 1-second length frames are written on a 1.7TB disk buffer that keeps the last 2 days of data (to be extended soon to few months). According to the running conditions, like engineering runs, the data are duplicated on a storage farm
based on EIDE disks (6.4TB) and written on tapes by the data archiving system.
2) The 50Hz data stream
To perform efficiently the analysis on low frequency bands, few mHz to 50Hz, the fast channels mainly acquired at 10kHz and 20kHz are resampled at 50Hz after low pass filtering.
Given the number of fast channels, the filtering cannot be done directly on the main data stream. Thanks to the hierarchical frame building and the producer/consumers scheme, on each data acquisition line a specific frame consumer performs in parallel the data filtering and the building of 50Hz frame. The various 50Hz frame consumers send their frames to a dedicated 50Hz main frame builder. This latter, implemented with the standard producer has a specific consumer, which compresses and writes the 50Hz frames. The built frame has a 10-second length to improve the data access on frame files. The daily amount of 50Hz data represents 9GB and is stored on SCSI disks without time limit.
3) The trend data stream
To show quickly and easily the interferometer signal variations over long time periods (week) each channel is summarized by these trend data (minimum, maximum, mean value and rms).
The trend frame builder server receives the whole data stream from a dedicated consumer running on the main acquisition. For each frame ADC channel, it computes the trend data over the frame length (1s), fills new frame ADC channels which cover a time length of 30 minutes. When complete, the frame is compressed and stored on SCSI disks. The daily amount of trend data represents 9.6MB.
The trend frame builder computes also statistical information about the DAQ system, like the number of compressed bytes and channels recorded.
V. DAQCONTROL AND MONITORING
All DAQ servers are integrated with the standard Virgo services: database, error reports and supervision. Dedicated graphical clients drive and display the status of all the servers involved in the data collection and the frame processing. Thanks to the DAQ design, the servers can be started independently.
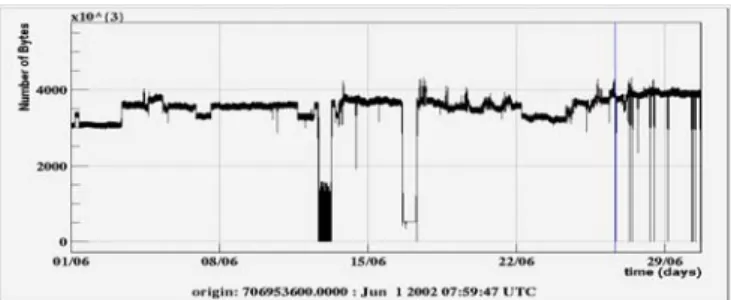
Fig. 6. This plot presents a time view of the number of compressed bytes collected by the DAQ system over June 20O2.
The Fig. 6 shows the number of compressed bytes per frame for June 2002, where the fluctuations due to the detector reconfiguration are clearly visible. The DAQ was
operated 24 hours a day, 7 days a week with an operator present only during working hours. Even though a limited number of segments with zero bytes recorded are also present, the DAQ efficiency can be estimated to 98.6% for June2002.
VI. CONCLUSION
The Virgo DAQ system has been designed to handle the frequent changes in the control systems and requested channels. Thanks to the different components of the data collection, the DOL point-to-point communication and the TCP/IP network facilities, the architecture can easily be modified according to new constraints on any data provider or new frame processing facilities.
The Virgo DAQ system is installed since January 2001 in Cascina and has been extensively used during the commissioning of the central interferometer. Modifications are in progress to increase the DAQ efficiency and to decrease the overall latency. The Virgo interferometer will enter in production phase during 2003 with improved detector monitoring capabilities.
VII. REFERENCES
[1] Virgo Collaboration, Final Design (1995). http://www.virgo.infn.it. [2] F.Marion et al. In Proceeding of the 3rd Edoardo Amaldi Coneference
(S.Meshkov Ed.) AIP Conference Proceeding 523, p. 110, Melville, New York (2000).
[3] A.Giazotto, Phys. Rep 182 6 (1989) 365-425. [4] G.Ballardini at al. Rev. Sci. Instrum. 72 3643 (2001).
[5] L.Derome, ‘Le système de détection de l’expérience Virgo dédiée à la recherche d’ondes gravitationnelles’, Thèse, Université de Savoie, LAPP-T99/02 (1999).
[6] M.Barsuglia, F.Bondu, R.Flaminio, P.La Penna, G.Losurdo, E.Majorama, Central Interferometer commissioning final report, VIR-NOT-LAP-1390-224(2002), Virgo Internal Note
[7] F.Belachia, D.Boget, B.Mours, D.Verkindt, “The VIRGO Timing system ”, VIR-LAP-5200-103 (1997).
[8] Datum bc635/637VME and bc350/357VXI Time and Frequency Processor modules, Datum Inc. .
[9] Creative Electronic Systems: Power-PC based RISC I/O board for VME real-time purposes, running LynxOS http://www.ces.ch
[10] LIGO data group and Virgo data acquisition group: Specification of a Common Data Frame Format for Interferometric Gravitational Waves Detectors, LIGO-T970130-F-E, VIR-SPE-APP-5400-102,
http://wwwlapp.in2p3.fr/virgo/FrameL/.
[11] A multitask communication package, Christian Arnault, Pierre massartal - Orsay, France. [email protected],
[12] F.Cavalier, ‘Le contrôle globale de Virgo’, Thèse d’habilitation à diriger des recherche, Université Paris Sud, LAL 01-69 (2001) [13] F.Bellachia, D.Boget, B.Mours, D.Verkindt, Digital Optical Link,
VIR-SPE-LAP-5200-105 (2000), Virgo Internal Note.
[14] Analog to Digital Converter VME boards mod. 298A are developed by ETEP, 1110 chemin Plantades, 83130 la Garde, France.
[15] SIESTA, a time domain general purpose simulation program for he VIRGO experiment B. Caron et al., Astroparticle Physics 10 (1999) 369-386.