RESEARCH
RESEARCH
RESEARCH
RESEARCH....
University of Science and Technology of Oran
University of Science and Technology of Oran
University of Science and Technology of Oran
University of Science and Technology of Oran
---- Mohamed Boudiaf
Mohamed Boudiaf
Mohamed Boudiaf
Mohamed Boudiaf –
––
–
Faculty of Electrical Engineering
Faculty of Electrical Engineering
Faculty of Electrical Engineering
Faculty of Electrical Engineering
Department of Electrical Engineering
Department of Electrical Engineering
Department of Electrical Engineering
Department of Electrical Engineering
Specialty: Graduate School of Electrical Engineering
Specialty: Graduate School of Electrical Engineering
Specialty: Graduate School of Electrical Engineering
Specialty: Graduate School of Electrical Engineering
Optional: Electric Networks
Optional: Electric Networks
Optional: Electric Networks
Optional: Electric Networks
Magister Thesis
Magister Thesis
Magister Thesis
Magister Thesis::::
Environmental Optimization of the Energy in an Electrical
Environmental Optimization of the Energy in an Electrical
Environmental Optimization of the Energy in an Electrical
Environmental Optimization of the Energy in an Electrical
Network.
Network.
Network.
Network.
Presented by:
Presented by:
Presented by:
Presented by:
Allali Malika
Defended
Defended
Defended
Defended::::
21
21
21
21
STSTSTSTOctober
October 2012
October
October
2012
2012 in
2012
in
in
in front
front
front
front the Jury
the Jury
the Jury
the Jury
P PP
Presidentresidentresidentresident:::: Pr. M. Rahli (USTOM). Reporter:
Reporter:Reporter:
Reporter: Dr. M.TAMALI. (BECHAR University). Examiner
ExaminerExaminer
Examiner 1111:::: Pr. C. Benachaiba. (BECHAR University). Examiner
ExaminerExaminer
Examiner 2222:::: Dr. M. Sellam. (BECHAR University). Examiner 3:
Examiner 3:Examiner 3:
Examiner 3: Dr. A. Allali. (USTOM).
On peut prendre un grand plaisir
simplement en regardant le
monde, mais ce plaisir est accru si
les yeux de
pénétrer à l’intérieure des objets
Energy in an Electrical Network.
Energy in an Electrical Network.
Energy in an Electrical Network.
Energy in an Electrical Network.
On peut prendre un grand plaisir
simplement en regardant le
monde, mais ce plaisir est accru si
les yeux de l’esprit peuvent
pénétrer à l’intérieure des objets
et voir ce qui s’y passe.
P.W. Atkins ;
Energy in an Electrical Network.
Energy in an Electrical Network.
Energy in an Electrical Network.
Energy in an Electrical Network.
Energy in an Electrical Network.
Energy in an Electrical Network.
Energy in an Electrical Network.
Energy in an Electrical Network.
of energy in the electrical supply network (obligation to reduce the emission of CO2).
Indeed, the principal aiming of this research is the integration of the renewable resources (energy independence and the sustainable development) that it pushes us to consider from now on the energy problem not only according to the economic point of view, but also according to an ecological point of view. This with us encouraged to develop our systems of energy on the basis of generation distributed on a large scale including/understanding renewable energy and the high-output solutions energetic.
Keyw KeywKeyw Keywords: ords: ords: ords:
Electrical network, Renewable energy, sustainable development, Emission CO2, Smarts grids, optimization, cost,
Résumé RésuméRésumé Résumé ::::
Cette recherche s’inscrit dans le cadre de la recherche des solutions d’optimisations environnementale de l’énergie dans le réseau électrique (l’obligation de réduire l’émission de CO2).
En effet, la visée principale de cette recherche est l’intégration des ressources renouvelables (l’indépendance énergétique et le développement durable) qu’il nous pousse à considérer désormais le problème énergétique non seulement selon le point de vue économique, mais également selon un point de vue écologique. Ceci à nous encouragé à développer nos systèmes d’énergie sur la base de génération distribuée à grande échelle comprenant les énergies renouvelables et les solutions à haut rendement énergétique.
Mots clés Mots clésMots clés Mots clés :
Réseau Electrique, Energie Renouvelable, Développement Durable, Emission de CO2, Smart Grid, optimisation, le coût
Year 2002 – 2008; more than six years experience in the field of electricity in a private gas and electricity works.
I never lost hope that will come one day and fill up my graduate studies. January 2008 I decided to leave the company and prepare for the competition of post graduation I stayed at home almost a year, 09 months of preparation at the end I succeeded. November 2008 I had a job in the company of Algerienne Des Eaux (ADE) I occupied a position of design engineers responsible for cell energy. Only one year of very hard work, but I am proud of myself because I realized something.
I won the document you are about to read, so we must never lose your hopes.
First of all I would like to thank Allah for blessing me with the ability to complete this work. This work couldn’t be complete without help and support of several people.
First my deep gratitude goes to my advisor, Professor Dr. M .Tamali who has provided me invaluable support, guidance, patience, and encouragement.
Great thanks for my dear professor Pr. Rahli Mostéfa for his honest presidency. I would like to express my appreciation to the examiners:
Pr. Benachaiba Chellali (Bechar University). Dr. Sellam Mabrouk (Bechar University). Dr. Allali Ahmed (USTO).
For their honest and faithful comments.
I would like to thank all my professors in University- of Bechar, and in USTO for their care and encouragement.
My deep appreciations are for my parent, for their support and encouragement. Also I thank my brother Salah and my dear sister Imene for their patience, ultimate support, great generosity, and lovingness. I wish also to thank my dear sisters Amel Menasria, Karima Maazouzi and Mouna chaar for everything.
Thanks to everyone who has contributed to this work directly or indirectly.
Malika Allali. Malika Allali.Malika Allali. Malika Allali.
Abstract Preface………...i Contents………...ii Abbreviation………....x List of figures………..…..xiii List of tables………..xiv INTRODUCTION INTRODUCTIONINTRODUCTION INTRODUCTION………..01 1. Introduction………..…01 2. Economic relations………..…03
2.1. Investment cost CI(t)………...….03
2.2. Energy cost CE(t)………..….04
2.3. Operating cost CO(t)……….……04
3. The PV generator……….……04
4. The installation of a photovoltaic system………..……….04
4.1. Cost and profitability……….04
4.1.1. Influence of the angle of incidence………..…04
4.1.2. Influence of the orientation………..04
4.1.3. Influence of the angle of inclination………....04
5. Electricity Generation from Wind Energy………..……05
5.1. Introduction………..………05
5.2. Wind Farms………..….05
6. Wind generator……….05
7. Wind farm installation……….…06
7.1. Advantages of the wind power………..……06
8. The storage……….06
9. The inverter………...……07
II- Conservation of Energy………...…..09
III-The energy resources of the planet………...……09
III.1. Solar radiation………09
--- The set of hydrologic cycle ……….……09
--- Wind energy……….………09
--- The wave energy………..09
--- Biomass………..…...09
--- Geothermal ……….10
--- The gravitational interactions Earth-Moon-Sun………...10
III.2. Non-renewable energy………10
---Nuclear……….…10
IV. What is a ton of CO2 ………..11
IV.1. What is a ton of CO2 ………..12
IV.2. Smart Grid………...12
IV.2.1. Goals of the Smart Grid………13
IV.2.2. What a smart grid is………..13
IV.2.3. Smart grid functions………..14
IV.2.4. Optimize assets……….…….14
I. RENEWABLE ENERGYRENEWABLE ENERGYRENEWABLE ENERGYRENEWABLE ENERGY………15
I.1. What is ‘Renewable Energy’………15
I.2. Why Renewable Energy………..15
I.3. How is Renewable Energy defined……….16
A. Biomass Energy………17
a) Historical Background………17
b) Biomass and Its Products………19
c) Products of Biomass………...20 d) Chemicals………21 e) Energy………..21 f) Transport Fuel……….22 g) Biomass Conversion………23 h) Biochemical Conversion……….24
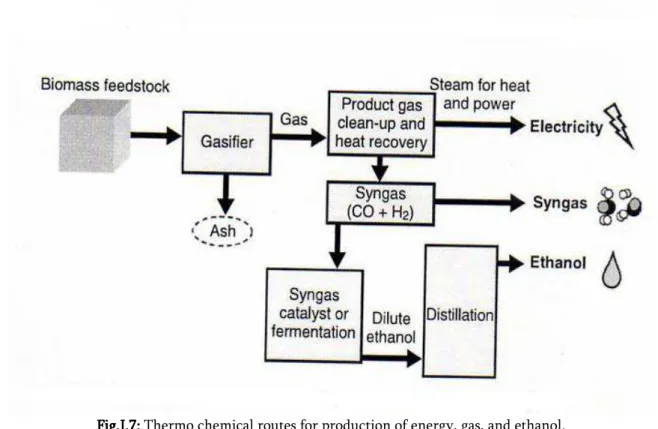
i) Thermo chemical Conversion……….24
j) Combustion………..26
B / 2- How Wind Power Works……….29
C / - Photovoltaic Systems………....31
C / 1- Examples of Communities Using Solar/PV………...31
D / - Geothermal Systems………...32
D / 1- How Geothermal Works………..33
D / 2 - Advantages of Geothermal………...33
E / - Nuclear Energy……….34
E / 1 – Fission………...36
F/ Micro Grids………..38
Introduction……….38
F / 1 - Definition of Micro Grids………39
F / 2 - Reasons for Micro grids………41
F / 3 - Management of Micro grid………..42
II IIII II.... SUSTAINABLE DEVELOPMENTSUSTAINABLE DEVELOPMENTSUSTAINABLE DEVELOPMENTSUSTAINABLE DEVELOPMENT ……….……….43
II. 1 Sustainable development in ecological economics………43
II.2 What is Sustainable Development………43
II.3 Definitions………..44
II.4 Climate Change………..46
II.4.2 Observed Climate Variability and Change………...…46
II.4.3 Carbon in the Atmosphere………...….48
II.4.4 Climate change and climate protection, indicators……….……48
II.4.5 Objectives and indicators………..…49
II.4.6 GHG emission overview………50
II.4.7 CO2 EMISSIONS FROM FUEL COMBUSTION………...52
II.5.Discussion………...…60
III.2. Supplying Electrical Energy of Good Quality……….………62
III.3. Economic Generation and Transmission………..……..………..62
III.4. Environmental Issues……….62
III.5. Structure of the Electrical Power System……….63
III.5.1 Generation………..64
III.5.2 Transmission……….65
III.5.3 Distribution………66
III.5.4 Demand………...66
III.6. Critical Infrastructures………...67
III.7. Grid system IEEE New England 39 nodes………68
Time of starting of the generators………..70
Characteristics of the transformers ………...71
Characteristics of the lines……….71
III.8. Calculation CO2 emissions……….72
III.9. Integration of distributed generation………72
III.9.1. Insertion of production decentralized like factor of reinforcement of means of production of the electric system……….72
III.9.1. 1/ Potential contributions of distributed generation……….72
III.9.2. Integration of distributed generation as a factor of vulnerability of the electrical system……….………..73
III.9.2.1/ Impacts of distributed generation on distribution network………..74
III.9.2.2/ Impacts of distributed generation on the transport network…………....74
III.10. The plan of defense against major incidents - The recovery plan…………...………...74
VI. VI. VI. VI. STUDY OF STUDY OF STUDY OF LOCALSTUDY OF LOCALLOCALLOCAL NETWORKNETWORKNETWORKNETWORK………...………..………..….76
IV. 1. Introduction ……….…...76
IV.2. The Characteristics Of Contracts………..……….…...76
IV.3. The Power Placed at the Disposal (PPD) and the Maximum Power Reached (MPR)……….……….77
IV.4. The electrical supply network (ADE)……….77
IV.5. Consumption of energy in the electrical supply network (ADE)……….78
1- Policy………...………...88
2- Economic………...……….…...89
a) - Revision of the power placed at the disposal (PPD)…..….…89
b) - Stops in the hours points………..……....89
d) - solutions to be proposed ………..……....89
V. V. V. V. CASE STUDYCASE STUDYCASE STUDY………..…………..………..90 CASE STUDY V.1. Introduction……….………..90
V.2. The political solution ……….…….….90
V.3. The Economic solution is……….………….91
V.3.1. Revision of the power placed at the disposal (PPD)……….….………...91
V.3.2. Stops in the peak hours……….……….92
V.3.3. Solutions to be proposed ………..……….93
V.3.3.1. Stops in the peak hours in the year 2010………..….…………..94
V.3.3.2. The installation of a photovoltaic system….…………..……….94
V.3.3.2.a. Estimate the power of photovoltaic panels.……….94
V.3.3.2.b. Technical characteristics……….………..96
V.3.3.2.c. Solar pump………97
Possible uses of this solar pump………..97
•Solar pump submersible LORENTZ PS200 up to 50 m………98
•Solar pump submersible LORENTZ PS600 up to 180 m………..…98
•Solar pump submersible LORENTZ PS1200 up to 240 m………....98
•Solar pump submersible LORENTZ PS1800 up to 250 m (high flow)…99 •Solar Pump of surface Lorentz PS150 BOOST to 120m………..….99
V.4. Some Solutions for reduction of the CO2 emissions in Algeria and in the world …………100
1- Reduction of the CO2 emissions: Algerian researchers develop a new fuel………100
2.4. Wind Farm Projects ……….101
3- First Hybrid Solar/Gas In The World (Hassi R'mel) ………..101
3.1. Structure of the Contract………..…102
4- Peaceful nuclear power ………102
5- DESERTEC Project ………102
a. Description……….….102
b. History……….103
c. Studies………..103
6- Tax CO2 with Brussels………104
7- Mobile phones could be charged by the power of speech ………..…104
8- Carbon Sequestration Storage ………...…105
9- Agriculture and the exploitation of the forests: (Protection of the forests) ………..105
VI VIVI VI.... DISCUSSION AND VALIDATIONDISCUSSION AND VALIDATIONDISCUSSION AND VALIDATIONDISCUSSION AND VALIDATION ………..106
VI.1. Systems and System Models………..106
VI.2. Optimization ………..106
VI.3. Results and Discussion………...107
VI.3.1. Calculation of CO2 emissions (ADE) by the software………..107
VI.3.2. Carbon offsetting (Carbon compensation) ………...107
VI.3.3. Integration of renewable resources ………..…108
VI.3.3.1.The political solution ………..109
VI.3.3.1.a/ The Economic solution ………...…...109
1.1. Revision of the power placed at the disposal (PPD)………….109
1.2. Stops in the peak hours………...109
VI.3.4.2. Building integration for 10% losses……….…113
VI.3.4.3. Free standing for 20% losses……….117
VI.3.4.4. Building integration for 20% losses………..121
VI.3.5. Interpretation of results………..125
VI.3.6. Conclusion………...126
V VV VIIIII. I. I. I. CONCLUSIONS AND FUTURE WORKCONCLUSIONS AND FUTURE WORKCONCLUSIONS AND FUTURE WORKCONCLUSIONS AND FUTURE WORK……….127
Conclusions ………127
EU EUEU
EU European Union CIS
CISCIS
CIS Commonwealth Of Independent States GHG
GHG GHG
GHG Green House Gas UN
UNUN
UNFCCCFCCCFCCCFCCC United Nations Framework Convention on Climate Change EU ETS
EU ETS EU ETS
EU ETS EU Emission Trading System DH
DH DH
DH District Heating OPEC
OPEC OPEC
OPEC Organization of Arab Petroleum Exporting Countries IGCC
IGCCIGCC
IGCC Integrated Gasification Combined Cycle CO
COCO
CO2 2 2 2 Carbon Dioxide CH CHCH CH4444 Methanol H HH H2222 Hydrogen C CC C3333 Glycerol C CC C4444 Fumaric Acid C CC C5555 Xylitol C CC C6666 Glucaric Acid Ar ArAr Ar Gallic Acid AHFH AHFHAHFH
AHFH Army Hawaii Family Housing MHPI
MHPIMHPI
MHPI Military Housing Privatization Initiative RTGs
RTGsRTGs
RTGs Radioisotope Thermal Generators EIA
EIA EIA
EIA Energy Information Administration MG
MGMG
MG Micro Grid PCC
PCC PCC
PCC Point Of Common Coupling PV PVPV PV Photovoltaic WT WTWT WT Wind Turbine FC FCFC FC Fuel Cell MT MTMT MT Micro Turbine DG DGDG DG Diesel Generator SD SDSD SD Static Switch LC LCLC LC Local Controller AVR AVRAVR
AVR Automatic Voltage Regulator EE EEEE EE EEEEcological EEEEconomics SD SDSD SD SSSSustainable DDDDevelopment CSR CSRCSR
CSR CCCorporate SC SSSocial RRRResponsibility GDP
GDPGDP
GDP Gross Domestic Product
OECD OECDOECD
OECD Organization for Economic Co-Operation and Development
TPES TPESTPES
TPES TTTTotal PPPPrimary EEEnergy SE SSSupply PV PVPV PV Photovoltaic DG DG DG DG Distributed Generation C.D.E.G.W C.D.E.G.W C.D.E.G.W
C.D.E.G.W Company of Distribution of Electricity and Gas of the West (SONELGAZ). ADE
ADEADE
ADE Algerienne Des Eaux PPD
PPD PPD
PPD Power Placed at the Disposal MPR
MPR MPR
MPR Maximum Power Reached OPH
OPHOPH
OPH Off-Peak Hours HP HPHP HP Peaks Hour’s FH FHFH FH Full Hours
IAT IATIAT
IAT All Inclusive of Tax P
PP
Pconsuconsuconsuconsu(t)(t)(t): (t): : : Power Consumption P PP PPVPVPVPV (t) (t) (t) (t) Solar Power P PP PWWWW (t)(t)(t)(t):::: Wind Power G GG GPVPVPVPV (t) (t) (t) (t) Sunning G GG GWWWW (t)(t)(t)(t) Wind Speed T TT
Taaaa (t) Ambient Temperature P
PP
Ppppp____PV PV PV PV Production Capacity For The Solar P
PP
Pp_W p_W p_W p_W Production Capacity For Wind C
CC
CIIII(t): (t): (t): (t): Investment Cost C
CC
CEEEE(t): (t): (t): (t): Energy Cost C
CC
COOOO(t): (t): (t): (t): Operating Cost ADEME
ADEMEADEME
ADEME: : : : Agence De L’environnement Et De La Maitrise De L’énergie HCNG
HCNGHCNG
HCNG : Hydrogen And Compressed Natural Gas CDER:
CDER: CDER:
CDER: Center Of Development Of Renewable Energies NEAL:
NEAL: NEAL:
NEAL: New Energy Algeria DOE:
DOE: DOE:
Fig.1. Fig.1. Fig.1.
Fig.1. Synoptic of the possible energy exchanges. ………03
Fig.1 Fig.1Fig.1
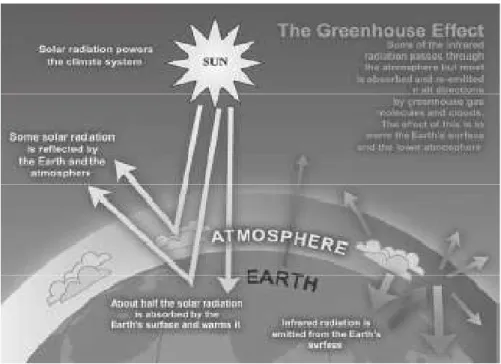
Fig.1:::: The greenhouse effect. Credit: IPCC, 2007……….08 Fig.2
Fig.2Fig.2
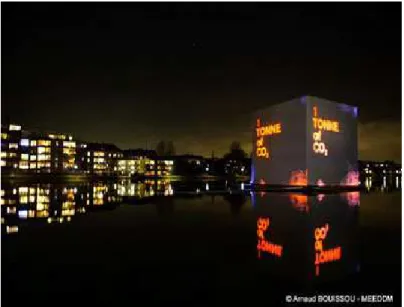
Fig.2:::: View a ton of CO2 ....………...11 Fig.I.1
Fig.I.1Fig.I.1
Fig.I.1:::: Milestones in gasification development………...17 Fig.
Fig.Fig.
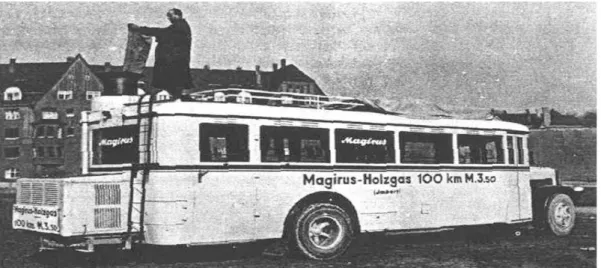
Fig.I.2I.2I.2I.2:::: Bus with an onboard gasifier during the Second World War………...18 Fig.I.3
Fig.I.3Fig.I.3
Fig.I.3:::: Cooking stove using fire logs………21 Fig.I.4
Fig.I.4Fig.I.4
Fig.I.4:::: A biomass fired bubbling fluidized bed in Canada………...22 Fig.I.5
Fig.I.5Fig.I.5
Fig.I.5:::: Two paths, biological and chemical, for conversion of biomass into fuel, gases, or
chemicals………23 Fig.I.6
Fig.I.6Fig.I.6
Fig.I.6:::: Two biochemical routes for production of ethanol from (noncellulosic) sugar (a) and (cellulosic) biomass (b)………..25 Fig.I.7
Fig.I.7Fig.I.7
Fig.I.7:::: Thermo chemical routes for production of energy, gas, and ethanol………26 Fig.I.7
Fig.I.7Fig.I.7
Fig.I.7:::: Types of turbine………29 Fig.I.8
Fig.I.8Fig.I.8
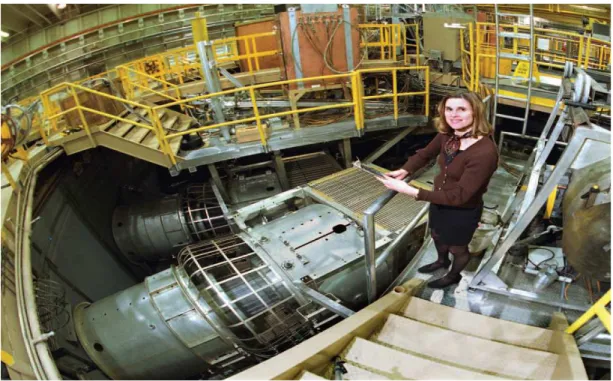
Fig.I.8:::: This photo shows scientist Melissa Douglas and part of the Z machine, an inertial-electrostatic confinement fusion apparatus at Sandia National Laboratories. In the device, giant capacitors discharge through a grid of tungsten wires finer than human hairs, vaporizing them. The tungsten ions implode inward at a million miles an hour. Braking strongly in the grip of a “Z-pinch,” they emit powerful x-rays that compress a deuterium pellet, causing collisions between the deuterium atoms that lead to fusion events………..38 Fig.I.
Fig.I.Fig.I.
Fig.I.9999:::: Micro Grid Architecture………..40 Fig.I.10
Fig.I.10Fig.I.10
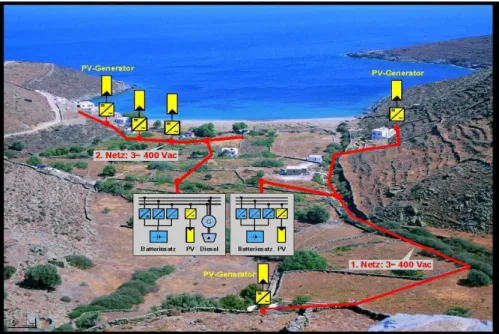
Fig.I.10:::: Example of MG on Kytnos Island (PV MORE and MODE projects.)………...41 F
FF
Figigigig....II.1II.1II.1II.1:::: A representation of sustainability showing how both economy and society are constrained by environmental limits………45 Fig.II.2
Fig.II.2Fig.II.2
Fig.II.2:::: Scheme of sustainable development: at the confluence of three constituent parts………45 Fig.
Fig.Fig.
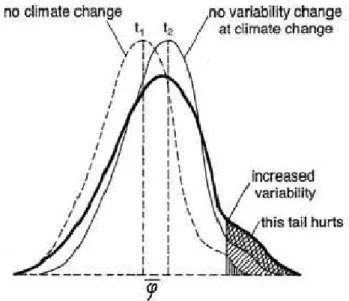
Fig.II.3II.3II.3II.3:::: Schematic frequency distribution of climate parameters both for present climate and changed climate. Also a broadened distribution for a changed climate is shown ………..47 Fig
FigFig
Fig....II.4II.4II.4II.4:::: Global mean near surface air temperature since 1856 (Meteorological Office of the United Kingdom)………...48 Fig.II.5
Fig.II.5Fig.II.5
Fig.II.6 Fig.II.6Fig.II.6
Fig.II.6:::: CO2 emissions by fuel in Africa………..…59 Fig.II.7
Fig.II.7Fig.II.7
Fig.II.7:::: CO2 emissions by fuel in the World………...60 Fig.Fig.Fig.IIIFig.IIIIIIIII....1111:::: Structure of an electrical power system………...64 F
FF
Fig.ig.ig.ig.III.2III.2III.2III.2:::: Grid system IEEE New ENgland 39 nodes………68 Fig.
Fig.Fig.
Fig.IVIVIVIV.1.1.1:::: Power Placed at the Disposal and the Maximum Power Reached for the year 07………77 .1 Figure IV.2
Figure IV.2Figure IV.2
Figure IV.2:::: The electrical supply network (ADE)………..77 Fig.IV.3
Fig.IV.3Fig.IV.3
Fig.IV.3:::: Power Placed at the Disposal and the Maximum Power Reached for the years 07-08-09-10………80 Fig.
Fig.Fig.
Fig.IV.4IV.4IV.4IV.4:::: Consumption of Energy in the Off-Peak Hours per Quarter for the Years 07-08-09-10………81 Fig.
Fig.Fig.
Fig.IV.5IV.5IV.5IV.5:::: Consumption of Energy in the Full Hours per Quarter for the Years 07-08-09-10…....82 Fig.
Fig.Fig.
Fig.IV.6IV.6IV.6IV.6:::: Consumption of energy in the Peaks Hours per Quarter for the Years 07-08-09-10…..83 Fig.IV.7
Fig.IV.7Fig.IV.7
Fig.IV.7: : : : Consumption of Energy Reactivates per Quarter for the Years 07-08-09-10…...………84 Fig.IV.8
Fig.IV.8Fig.IV.8
Fig.IV.8:::: Total Amount with All Inclusive of Tax per Quarter for the Years 07-08-09-10………85 Fig.IV.9
Fig.IV.9Fig.IV.9
Fig.IV.9:::: CO2 emissions of (ADE) per (t) for a real consumption……….…86 Fig.IV.10
Fig.IV.10Fig.IV.10
Fig.IV.10:::: CO2 emissions of (ADE) per (t) for an overall consumption……….…...87 Fig.IV.11
Fig.IV.11Fig.IV.11
Fig.IV.11:::: CO2 emissions of (ADE) per (t) for a real consumption……….…...87 Fig.IV.12
Fig.IV.12Fig.IV.12
Fig.IV.12:::: CO2 emissions of (ADE) per (t) for an overall consumption……….88 Fig.V.1.
Fig.V.1.Fig.V.1.
Fig.V.1. Monocrystalline solar module 130 Wp VICTRON - High efficiency………..95 Fig.V.2.
Fig.V.2.Fig.V.2.
Fig.V.2. LORENTZ PS (200-600-1200-1800) submersible solar pump up to (50-180-240-250)m ………...97 Fig.V.3. Fig.V.3. Fig.V.3. Fig.V.3. PS200………..…..98 Fig.V.4. Fig.V.4. Fig.V.4. Fig.V.4. PS600………..……..98 Fig.V.5. Fig.V.5. Fig.V.5. Fig.V.5. PS1200……….……98 Fig.V.6. Fig.V.6. Fig.V.6. Fig.V.6. PS1800……….99 Fig.V.7. Fig.V.7. Fig.V.7. Fig.V.7. PS150 BOOST……….…99
Fig.V.8. Fig.V.8.Fig.V.8.
Fig.V.8.Hybrid power station of Hassi R' mel……….…..101 Fig.V.9:
Fig.V.9: Fig.V.9:
Fig.V.9: CO2 Capture and Storage………...105
Fig.VI.1. Fig.VI.1.Fig.VI.1.
Fig.VI.1. Monthly energy output from fixed-angle PV system (Free standing for 10% losses)………..112
Fig.VI.2. Fig.VI.2.Fig.VI.2.
Fig.VI.2. Monthly in-plane irradiation for fixed angle (Free standing for 10% losses)………112
Fig.VI.3. Fig.VI.3.Fig.VI.3.
Fig.VI.3. Outline of horizon with sun path for winter and summer solstice (Free standing for 10% losses)……….113
Fig.VI.4. Fig.VI.4.Fig.VI.4.
Fig.VI.4. Monthly energy output from fixed-angle PV system (Building integration for 10% losses)………..116
Fig.VI.5. Fig.VI.5.Fig.VI.5.
Fig.VI.5. Monthly in-plane irradiation for fixed angle (Building integration for 10% losses)………..116
Fig.VI.6. Fig.VI.6.Fig.VI.6.
Fig.VI.6. Outline of horizon with sun path for winter and summer solstice. (Building integration for 10% losses)………117
Fig.VI.7. Fig.VI.7.Fig.VI.7.
Fig.VI.7. Monthly energy output from fixed-angle PV system (Free standing for 20% losses)………..120
Fig.VI.8. Fig.VI.8.Fig.VI.8.
Fig.VI.8. Monthly in-plane irradiation for fixed angle (Free standing for 20% losses)………120
Fig.VI.9. Fig.VI.9.Fig.VI.9.
Fig.VI.9. Outline of horizon with sun path for winter and summer solstice (Free standing for 20% losses)………..121
Fig.VI.10. Fig.VI.10.Fig.VI.10.
Fig.VI.10. Monthly energy output from fixed-angle PV system (Building integration for 20% losses)………..124
Fig.VI.11. Fig.VI.11.Fig.VI.11.
Fig.VI.11. Monthly in-plane irradiation for fixed angle (Building integration for 20% losses)………..124
Fig.VI.12. Fig.VI.12.Fig.VI.12.
Fig.VI.12. Outline of horizon with sun path for winter and summer solstice. (Building integration for 20% losses)………125
Tab. Tab.Tab.
Tab.1111:::: estimating quantities of renewable energy and share exploitable………..10 Tab.2
Tab.2Tab.2
Tab.2:::: ……….10 Tab.I.1
Tab.I.1Tab.I.1
Tab.I.1:::: Sources of Biomass.. ………....19 Tab.I.2
Tab.I.2Tab.I.2
Tab.I.2:::: comparisons of four major thermo chemical conversions processes………26 Tab.I.3
Tab.I.3Tab.I.3
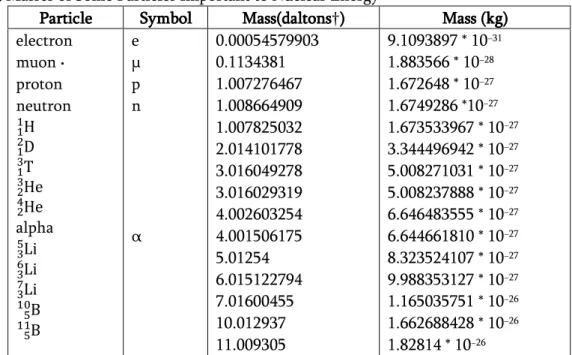
Tab.I.3:::: Masses of Some Particles Important to Nuclear Energy………36 Tab.I.4
Tab.I.4Tab.I.4
Tab.I.4:::: Uranium Isotopes. ………...36 Tab.
Tab.Tab.
Tab.II.1II.1II.1:::: II.1 CO2 emissions: Sectoral Approach. ………..52
Tab. Tab.Tab.
Tab.II.2II.2II.2:::: II.2 CO2 emissions: Sectoral Approach - Coal/peat. ………...52
Tab. Tab.Tab.
Tab.II.3II.3II.3:::: II.3 CO2 emissions: Sectoral Approach – Oil. ……….52
Tab. Tab.Tab.
Tab.II.4II.4II.4:::: II.4 CO2 emissions: Sectoral Approach – Gas. ………53
Tab. Tab.Tab.
Tab.II.5II.5II.5:::: II.5 CO2 emissions: Reference Approach. ………...53
Tab. Tab.Tab.
Tab.II.6II.6II.6:::: II.6 CO2 emissions from international marine bunkers. ………53
Tab. Tab.Tab.
Tab.II.7II.7II.7:::: II.7 CO2 emissions from international aviation bunkers. ………..…53
Tab. Tab.Tab.
Tab.II.8II.8II.8:::: II.8 CO2 emissions by sector in 2008*.……….………54
Tab. Tab.Tab.
Tab.II.9II.9II.9:::: II.9 CO2 emissions with electricity and heat allocated to consuming sectors * in 2008……..54
Tab. Tab.Tab.
Tab.II.10II.10II.10:::: II.10 Total primary energy supply.………..54 Tab
TabTab
Tab....II.11II.11II.11:::: II.11 Total primary energy supply. ……….…55 Tab.
Tab.Tab.
Tab.II.12II.12II.12:::: II.12 GDP using exchange rates. ……….55 Tab
TabTab
Tab....II.13II.13II.13:::: II.13 GDP using purchasing power parities.………55 Tab
TabTab
Tab....II.14II.14II.14:::: II.14 Population………55
Tab. Tab.Tab.
Tab.II.15II.15II.15:::: II.15 CO2 emissions / TPES.………..56
Tab TabTab
Tab....II.16II.16II.16:::: II.16 CO2 emissions / GDP using exchange rates.………...56
Tab TabTab
Tab....II.17II.17II.17:::: II.17 CO2 Emissions / GDP using purchasing power parities. ………..56
Tab TabTab
Tab TabTab
Tab....II.19II.19II.19:::: II.19 CO2 emissions per kWh from electricity and heat generation*……….……57
Tab. Tab.Tab.
Tab.II.20II.20II.20:::: II.20 CO2 emissions per kWh from electricity and heat generation using coal/peat*………..57
Tab. Tab.Tab.
Tab.II.21II.21II.21:::: II.21 CO2 emissions per kWh from electricity and heat generation using oil*……….58
Tab TabTab
Tab....II.22II.22II.22:::: II.22 CO2 emissions per kWh from electricity and heat generation using gas*………58
Tab TabTab
Tab....II.23II.23II.23:::: II.23 CO2 emissions: Sectoral Approach - Coal/peat/ Oil and gas: I n Algeria………...58
Tab TabTab
Tab....II.24II.24II.24:::: COII.24 2 emissions: Sectoral Approach - Coal/peat/ Oil and gas: In Africa………59
Tab TabTab
Tab....II.25II.25II.25:::: COII.25 2 emissions: Sectoral Approach - Coal/peat/ Oil and gas: In the World………60 Tab.
Tab.Tab.
Tab.III.III.III.1III.111:::: State of production and consumption of the grid system……….69 Tab.
Tab.Tab.
Tab.III.III.III.2III.222:::: Characteristics of the generators. ………...70 Tab.
Tab.Tab.
Tab.III.III.III.3III.333:::: Time criticizes restarting of the thermal and nuclear generators………70 Tab.
Tab.Tab.
Tab.III.III.III.4III.444:::: Characteristics of the lines of the grid system. ……….71 Tab.
Tab.Tab.
Tab.IIIIV.1V.1V.1:::: Subscription Contract. ………76 V.1 Tab
TabTab
Tab....IIIIV.V.V.2V.222:::: Consumption of energy in the (off-peak hours, the peaks hour’s, the full hours
and the energy reactivates) for the year 2007. ………...78 Tab.
Tab.Tab.
Tab.IIIIV.V.V.3V.333:::: Consumption of energy in the (off-peak hours, the peaks hour’s, the full hours and the energy reactivates) for the year 2008. ……….78 Tab.
Tab.Tab.
Tab.IIIIV.V.V.4V.444:::: Consumption of energy in the (off-peak hours, the peaks hour’s, the full hours and the energy reactivates) for the year 2009.………..79 Tab.
Tab.Tab.
Tab.IIIIV.V.V.5V.555:::: Consumption of energy in the (off-peak hours, the peaks hour’s, the full hours and the energy reactivates) for the year 2010.………..79 Tab.
Tab.Tab.
Tab.IV.6IV.6IV.6:::: Power placed at the disposal and Maximum power reached for the years 07-08-09-IV.6 10.………...79 Tab.
Tab.Tab.
Tab.IV.7IV.7IV.7:::: The amount net of tax of the (PPD and MPR).………...80 IV.7 Tab.IV.8
Tab.IV.8Tab.IV.8
Tab.IV.8:::: Consumption of Energy (off-peak hours, the peaks hour’s, the full hours and the energy reactivates) per Quarter for the Year 07. ……….80 Tab.IV.9
Tab.IV.9Tab.IV.9
Tab.IV.9:::: Consumption of Energy (off-peak hours, the peaks hour’s, the full hours and the energy reactivates) per Quarter for the Year 08. ……….80
Tab TabTab
Tab.IV.10.IV.10.IV.10.IV.10:::: Consumption of Energy in the (off-peak hours, the peaks hour’s, the full hours and the energy reactivates) per Quarter for the Year 09……….……….81 Tab.IV.11:
Tab.IV.11:Tab.IV.11:
Tab.IV.11: Consumption of Energy in the (off-peak hours, the peaks hour’s, the full hours and the energy reactivates) per Quarter for the Year 09……….……….81 Tab.IV.1
Tab.IV.1Tab.IV.1
Tab.IV.12222:::: Consumption of Energy in the off-peak hours per Quarter for the Years 07- 08 – 09 -10 ………....81 Tab.IV.1
Tab.IV.1Tab.IV.1
Tab.IV.13333:::: Consumption of Energy in the full hours per Quarter for the Years 07-08-09-10.…….82 Tab.IV.1
Tab.IV.1Tab.IV.1
Tab.IV.14444:::: Consumption of Energy in the peaks hour’s, the per Quarter for the Year 07-08-09-10 ………...……….82 Tab.IV.1
Tab.IV.1Tab.IV.1
Tab.IV.15555:::: Consumption of Energy Reactivates per Quarter for the Years 07-08-09-10………...83 Tab.IV.1
Tab.IV.1Tab.IV.1
Tab.IV.16666:::: Total Amount with All Inclusive of Tax per Quarter for the Years 07-08-09-10 ……….………..…….85 Tab.IV.1
Tab.IV.1Tab.IV.1
Tab.IV.17777:::: For a real consumption ……….……….86 Tab.IV.1
Tab.IV.1Tab.IV.1
Tab.IV.18888:::: For an overall consumption ……….……….86 Tab.IV.1
Tab.IV.1Tab.IV.1
Tab.IV.19999:::: For a real consumption ……….……….87 Tab.IV.
Tab.IV.Tab.IV.
Tab.IV.22220:0:0: For an overall consumption ……….……….88 0: Tab.V.2:
Tab.V.2: Tab.V.2:
Tab.V.2: Revision of the (PPD) in the year 2010………...…91 Tab.V.3:
Tab.V.3: Tab.V.3:
Tab.V.3: Gain Realized in the year 2010………92 Tab.V.4:
Tab.V.4: Tab.V.4:
Tab.V.4: Stops in the Peak hours in the year 2010………..…..92 Tab.V.5:
Tab.V.5: Tab.V.5:
Tab.V.5: Consumption of energy in ADE (St.Tr. Djorf Torba. Kenadsa/Bechar)……….93 Tab.V.6:
Tab.V.6: Tab.V.6:
Tab.V.6: Outages during peak hour’s Station de Traitement of Djorf Torba ………94 Table VI.1:
Table VI.1: Table VI.1:
Table VI.1: For a real consumption: ((((CO2 emissions of (ADE) by the software)……..…………107 Table.VI.2:
Table.VI.2: Table.VI.2:
Table.VI.2: For a real consumption: (CO2 emissions According to the Summit of Copenhagen there is 3300 kWh electricity = 1000 kg of CO2)……….107 Table.VI.3:
Table.VI.3: Table.VI.3:
Table.VI.3: Global Warming Potential of gas………..107 Table.VI.4:
Table.VI.4: Table.VI.4:
Table.VI.4: Carbon compensation………...108 Table.VI.
Table.VI.Table.VI.
Table.VI. Table.VI.Table.VI.
Table.VI.6666: : : : Vertical axis tracking system optimal………....110 Table.VI.
Table.VI.Table.VI.
Table.VI.7777: : : : Inclined axis tracking system optimal………...111 Table.VI.
Table.VI.Table.VI.
Table.VI.8888: : : : 2-axis tracking system………111 Table.VI.
Table.VI.Table.VI.
Table.VI.9999 : : : : Fixed system………...114 Table.VI.10
Table.VI.10Table.VI.10
Table.VI.10 : : : : Vertical axis tracking system optimal……….114 Table.VI.11
Table.VI.11Table.VI.11
Table.VI.11 : : : : Inclined axis tracking system optimal………115 Table.VI.12
Table.VI.12Table.VI.12
Table.VI.12 : : : : 2-axis tracking system……….115 Table.VI.13
Table.VI.13Table.VI.13
Table.VI.13 :::: Fixed system……….118 Table.VI.14
Table.VI.14Table.VI.14
Table.VI.14 : : : : Vertical axis tracking system optimal……….118 Table.VI.15
Table.VI.15Table.VI.15
Table.VI.15 : : : : Inclined axis tracking system optimal………119 Table.VI.16
Table.VI.16Table.VI.16
Table.VI.16 : : : : 2-axis tracking system……….119 Table.VI.17
Table.VI.17Table.VI.17
Table.VI.17 :::: Fixed system………121 Table.VI.18
Table.VI.18Table.VI.18
Table.VI.18 :::: Vertical axis tracking system optimal………121 Table.VI.19
Table.VI.19Table.VI.19
Table.VI.19 :::: 2-axis tracking system ………123 Table.VI.20
Table.VI.20Table.VI.20
Table.VI.20 :::: Vertical axis tracking system optimal ………123
I
N
T
R
O
D
U
C
T
I
O
N
I
N
T
R
O
D
U
C
T
I
O
N
I
N
T
R
O
D
U
C
T
I
O
N
I
N
T
R
O
D
U
C
T
I
O
N
Environmental
Environmental
Environmental
Environmental
Optimization of the
Optimization of the
Optimization of the
Optimization of the
Energy in an
Energy in an
Energy in an
Energy in an
Electrical Network.
Electrical Network.
Electrical Network.
Electrical Network.
Environmental
Environmental
Environmental
Environmental
Optimization of the
Optimization of the
Optimization of the
Optimization of the
Energy in an
Energy in an
Energy in an
Energy in an
Electrical Network.
Electrical Network.
Electrical Network.
Electrical Network.
Introduction Introduction Introduction Introduction:::: 1 11
1.... Introduction:Introduction: Introduction:Introduction:
Energy is a thermodynamic quantity equivalent to the capacity of a physical system to produce work or heat. It is essential to life. If we live better than our primitive ancestors, it is because we use more energy to do work, to produce heat, and to move people and goods. Energy can exist in various forms (chemical, Mechanical, electrical, light, etc.). It is in the process of transforming energy from one form to another that we are able to harness part of it for our own use.
Energy is related to a fundamental symmetry of nature: the invariance of the physical laws under translation in time. In simple words this means that any experiment reproduced at a later time under the same conditions should give the same results. This symmetry law leads to the conservation of the physical quantity which is energy. There are also other symmetries which lead to important conservation laws. Space invariance with respect to translation or rotation leads respectively to conservation laws for momentum and angular momentum. This means that if we translate or rotate an experimental arrangement we will get the same experimental results. Conservation of energy, momentum, and angular momentum are of basic importance and govern the processes occurring in the universe. [1]
Energy and information are two elements fundamentals of our modern society, both are produced, transported, processed, stored ...Many similarities exist between energy and information except that our "manipulations" energy can seriously disrupt our environment because our requirements in terms of transport and comfort are growing at a disproportionate rate our energy needs. Since the dawn of humanity, we burn: first wood, then fossil (coal, oil, gas), then uranium. In Just over a century, electricity, modern form of Energy Excellence, took a prominent plan. Its production accounts for one third of the consumption Global energy, mainly in thermo-mechanical machines of poor performance.
The large-scale combustion of fossil fuels leads to massive release of various compounds which one begins to suspect that they alter balances of the planet; moreover, it is likely that we have exhausted their reserves during the century next. Nuclear waste, despite their reprocessing, and pile up, when their producers are unscrupulous, they end up in places not listed. Certainly, nuclear fusion gave a lot of hope but the technological problems it raises are far from being resolved.
Meanwhile, nature provides us, generously and fairly well distributed over the earth, a quantity of energy (renewable) very largely sufficient to meet our needs. It is a multitude of technology solutions for used on a large scale or small, whether for produce heat, mechanical energy or electricity, which in turn can be transformed.
So why energy utilization renewable only develops does not faster? The reasons are both political and economic. In Indeed, the current prices of fossil fuels are very down and hinder the emergence of new technologies inevitably more expensive as they have not reached mass production. Meanwhile, an increasing proportion of the population concerned, often rightly, of the dangers associated with the use of fossil fuels and nuclear fission.
This fraction of the population, on the one hand, and the many industrial lobbies, on the other hand, exert their influences the political level to address the balance of their side but, for now, the latter are still the most powerful.
The trend towards deregulation is becoming increasingly prevalent worldwide. Deregulation allows the gradual privatization in generation and distribution of electric energy. It finally leads to decentralization in the modes of operation of the electrical system and diversity in ways of generating and distributing energy.
On the other hand, in recent decades, a variety of reasons such as:
• The need to reduce the emission of greenhouse gas emissions (Kyoto Protocol in 1997) • The threat of depletion of fossil energy.
• The issue of energy independence. • Sustainable Development.
Now we look to push the energy issue not only by economic standpoint, but also as an ecological standpoint. This has encouraged many countries to develop their energy system based on large-scale distributed generation including renewable energy and energy-efficient solutions.
Distributed Productions have very interesting potential contributions in terms of energy and economy. However, depending on their rate of penetration, these new energy sources could have significant consequences on the operation and security of power systems. To insert a massive Productions Distributed system, these impacts will be found not only in the distribution system, where most Productions distributed connected, but they will affect the whole system in terms of: Uncertainty in the planning of production means.
Increase the vulnerability in the operating result:
Change of the operating reserve margin.
Sensitivity Productions distributed to disruptions in the network. Complexity of coordinating the management of the network.
For these and others we are going to study the “Algerienne des Eaux (ADE)” which is one of the largest consumers of energy in our Bechar city; we will try to propose an integration of a renewable source on the level of consumption, since near the sites of consumption, thusreducing the cost of transport, on-line losses, and the call of reactivates power on the level of the source station;
Fig.1 Fig.1 Fig.1
Fig.1.... Synoptic of the possible energy exchanges.
We want to satisfy the energy demand of the (ADE). We have at our disposal the network, of the systems of ecological, wind and solar production,
• Algerienne Des Eaux (AAAADEDEDEDE) consumption: PPconsuPPconsuconsuconsu(t);(t);(t); (t);
• Producer Solar produces at time t, respectively, a power PPPPVPPVPVPV (t)(t)(t)(t)
• The manufacturer produces wind at time t, respectively, a power PPPPWWWW (t).(t).(t).(t). These ratings depend on:
• Solar and wind fields whose time distribution is given respectively by the functions: G GG GPVPVPVPV (t)(t)(t)(t) (sunning in W/m²) G GG GWWWW (t)(t)(t)(t) (wind speed in m/s); • Ambient temperature TTTaaaa (t) (in ° C); T
• Production capacity in terms of peak power installed. For the solar PPPpPppp____PVPVPV, PV
For wind PPPp_WPp_Wp_Wp_W (watts peak); 2.
2.2.
2. Economic relationsEconomic relationsEconomic relations:::: Economic relations
We define the cost of energy produced or consumed C(C(C(C(t)t)t)t) for a given element, at time "t" (t in hours) as the sum of investment costs, respectively CCCCIIII (purchase and installation), CCCCEEEE energy and use CCOCCOO (operation and maintenance): C(O C(C(C(t) t) = Ct) t) = C= CIIII(t= C(t(t(t) + ) + ) + C) + CECCE(tEE(t(t(t) + ) + ) + ) + CCOCCOOO((((t).t).t).t).
2 22
2.1. .1. .1. Investment cost.1. Investment costInvestment costInvestment cost CCCCIIII(t):(t): (t):(t):
This cost depends on the maximum capacity of the elements :(:(:(P:(PPPp_PVp_PVp_PV, p_PV, , , PPPp_WPp_Wp_W).p_W).). ). Algerien AlgerienAlgerien Algeriennnnneeee Des Eaux Des Eaux Des Eaux Des Eaux Bechar Bechar Bechar Bechar S SS
SONELGAONELGAONELGAONELGAZZZZ Wind Wind Wind Wind PV PV PV PV sys.sys.sys. sys.
2 22
2....22. 22. . . Energy costEnergy costEnergy costEnergy cost CCCCEEEE(t):(t):(t):(t):
This cost depends on the power produced or consumed at time t and the maximum power that can be received or returned by the element.
2 22
2....3333. . . . Operating costOperating costOperating costOperating cost CCCCOOOO(t):(t): (t):(t):
This cost can be decomposed into an annual maintenance cost which depends on the capacity of the installation and maintenance costs associated with wear-dependent production:
3. 3.3.
3. The PV generatorThe PV generatorThe PV generator: The PV generator: : :
The price of a PV system must take into account the actual items. It is split between all the materials conversion, labor and commissioning of the plant. The material here includes:
Photovoltaic panels, mounting brackets, converters and cable connections needed. The total cost of the PV system varies depending on the source, especially as the rapidly expansion is accompanied by a rapid decrease in panel prices and the share of the plant can undergo large dispersions of the difficulties. Converters, still produced in small series, should incur significant cost reductions in the future with a peak watt installed cost of normal descending when the power increases. [2]
Once the system is installed, there is a cost of operation and maintenance. 4
44
4. . . . The installation of a The installation of a The installation of a photovoltaic system:The installation of a photovoltaic system:photovoltaic system: photovoltaic system:
4 44
4.1.1.1.... Cost.1 CostCostCost and profitability:and profitability:and profitability: and profitability:
The outputs of the solar panels vary according to many factors’ which are: 4
44
4....1111....1. 1. 1. Influence of the angle of incidence1. Influence of the angle of incidenceInfluence of the angle of incidence: Influence of the angle of incidence
The angle of incidence, it is the angle formed by the rays of the Sun and the plan of the panel.
4 44
4....1111....2222.... Influence of the orientationInfluence of the orientationInfluence of the orientation: Influence of the orientation
The Sun rises to the East and lie down in the West. Then the orientation would have made according to the situation and or more the rays of the Sun come.
4 44
4....1111....3333.... Influence of the angle of inclinationInfluence of the angle of inclinationInfluence of the angle of inclination: Influence of the angle of inclination
5 55
5. Electricity Generation from Wind Energy: . Electricity Generation from Wind Energy: . Electricity Generation from Wind Energy: . Electricity Generation from Wind Energy:
5 55
5.1. Introduction: .1. Introduction: .1. Introduction: [3].1. Introduction:
There is now general acceptance that the burning of fossil fuels is having a significant influence on the global climate. Effective mitigation of climate change will require deep reductions in greenhouse gas emissions. The electricity system is viewed as being easier to transfer to low-carbon energy sources than more challenging sectors of the economy such as surface and air transport and domestic heating. Hence the use of cost-effective and reliable low-carbon electricity generation sources, in addition to demand-side measures, is becoming an important objective of energy policy in many countries.
Over the past few years, wind energy has shown the fastest rate of growth of any form of electricity generation with its development stimulated by concerns of national policy makers over climate change, energy diversity and security of supply.
5 55
5.2. Wind Farms:.2. Wind Farms:.2. Wind Farms: .2. Wind Farms:
Numerous wind farm projects are being constructed around the globe with both offshore and onshore developments in Europe and primarily large onshore developments in North America. Usually, sites are preselected based on general information of wind speeds provided by a wind atlas, which is then validated with local measurements. The local wind resource is monitored for 1 year, or more, before the project is approved and the wind turbines installed.
Onshore turbine installations are frequently in upland terrain to exploit the higher wind speeds. However, wind farm permitting and sitting onshore can be difficult as high wind-speed sites are often of high visual amenity value and environmentally sensitive.
Offshore development, particularly of larger wind farms, generally takes place more than 5 km from land to reduce environmental impact. The advantages of offshore wind farms include reduced visual intrusion and acoustic noise impact and also lower wind turbulence with higher average wind speeds.
6 66
6.... Wind generator:Wind generator:Wind generator: Wind generator:
It is very difficult to calculate the price of a wind turbine without considering the actual situation. The cost is split between the material, labor, and civil construction and commissioning of the entire system. It can be very variable depending on the implantation site (topographical difficulties, distance between wind turbines and ground installation ...). The material here includes, wind turbines, masts, converters and the necessary cable connections. We see then, for the cost of installation and the total cost of the wind system according to the installed peak power.
7 77
7. Wind farm installation:. Wind farm installation:. Wind farm installation: . Wind farm installation:
For the wind farm installation it is necessary to see many factors: (future work)
The first stage consists in making sure that the site of establishment considered is appropriate for a project of Wind Park.
It must in particular:
To be sufficiently been windy. In the ideal, the winds must be regular and sufficiently forts, without too much turbulence, throughout the year. Studies of the winds on the site are essential;
• To be easy to connect to the electrical supply high or Medium Average network; • To be easy access;
• Not to be subjected to certain constraints (aeronautical, radars, etc.)
• To take into account the natural inheritance and in particular the avifauna, to avoid the zones protected not to take seat in architectural or landscape sectors significant
(remarkable sites emblematic, landscapes, registered or classified sites, etc.) • To be of a sufficient size to accommodate the project.
• The wind mills must be located at a distance from the dwellings determined by the acoustic shutter of the impact study which takes into account the regulation «Noise and Vicinity ".
• The distance between wind mills must be 400 m approximately.
• Their influence on the ground (surface overhung by the blades) is approximately 8000 m2. • A wind park of 10 machines covers approximately 10 ha.
7 77
7.1. .1. .1. Advantages of the wind power: .1. Advantages of the wind power: Advantages of the wind power: Advantages of the wind power:
It preserves the hydrous resources;
It is compatible with other uses of the grounds and can be used as stimulus with the development of the rural economy;
It does not produce toxic or radioactive waste;
It creates additional incomes for the farmers whose grounds are rented; It constitutes a tourist attraction for the local communities;
It is entirely renewable, highly reliable and very efficient;
It becomes increasingly economic to produce as economies of scale are carried out and that the price of electricity increases.
8 88
8.... The storage: The storage: The storage: The storage:
This cost includes the electrochemical batteries, cables required for connections, the cabinet or safe containment and commissioning of all.
9 99
9.... The inverterThe inverterThe inverter: The inverter
We consider here only the cost of purchasing and installing the inverter.
The means of energy storage is expensive so the (SONELGAZ)(SONELGAZ)(SONELGAZ) takes it instantly. (SONELGAZ) (Proposition)
10 1010
10.... Outline of the Outline of the Work:Outline of the Outline of the Work:Work: Work:
The work is organized as follows. A Bibliographical study an introduction and Outline of the Work. In Chapter 1111, a background of renewable energy is presented. The main focus in Chapter 2222 is a sustainable development, Climate change and the emission of CO2, Study of a standard network in Chapter 3333. The objective of Chapter 4444 is to study a local network specially study of an electrical supply network which is Algerienne Des Eaux / Bechar, namely minimizing operating costs and emission level. In Chapter 5 a Study of different solutions are proposed; policy and economic which is Revision of the power placed at the disposal (PPDPPDPPDPPD), Stops in the peak hour’s and the integration of renewable sources like installation of a photovoltaic system and/or Wind farm and finally; in Chapter 6666 deals with solving and discussion of results of the same problem as in Chapter 4444 using the software on line PPPhotovoltaic GP GGGeographical IIIInformation SSSSystem (PVGIS) and another for calculate the emission of CO2 from actioncarbone.org (a program of the foundation / GOODPLANET) as an electrical supply network. Finally, conclusions and future considerations are summarized in Chapter 7777.
B
ib
li
o
g
ra
p
h
ic
a
l
st
u
d
y
B
ib
li
o
g
ra
p
h
ic
a
l
st
u
d
y
B
ib
li
o
g
ra
p
h
ic
a
l
st
u
d
y
B
ib
li
o
g
ra
p
h
ic
a
l
st
u
d
y
Environmental
Environmental
Environmental
Environmental
Optimization of the
Optimization of the
Optimization of the
Optimization of the
Energy in an
Energy in an
Energy in an
Energy in an
Electrical Network.
Electrical Network.
Electrical Network.
Electrical Network.
Bibliographical study Bibliographical study Bibliographical study Bibliographical study:::: IIII---- Introduction:Introduction: Introduction:Introduction:
“Anyone who has kids must be . . . concerned about the climate future we’re leaving behind for them. The choices that we make today on the “what to do” about climate change will have long lifetimes . . . Our actions are changing the climate on a global scale. It’s happening now. We can’t pretend it’s not there.”
Climate change is nothing new. About 18 000 years ago, Earth was experiencing the last of many ice ages, from which it only emerged about 10 000 years ago. More recently, between the years 1430–1850 portions of the Earth passed through a little ice age. The role of greenhouse gases, especially water vapor and carbon dioxide (CO2), in warming the Earth is also ancient, and indeed has long served life on Earth well. (FigFigFigFig....1111)shows a representation of this phenomenon. Radiation from the sun reaches and warms the Earth’s surface. In turn, Earth emits radiant heat (infrared radiation) back toward space, part of which is captured by heat trapping water vapor and greenhouse gases. Without the “greenhouse effect” to trap this warmth, the Earth could be colder by 95ºF (35ºC), and not support life as we know it. However, the last century has brought greater warming beyond that which can be accounted for by natural causes, and warming is occurring at a faster rate.
In an 1896 publication, Swedish chemist Svante Arrhenius noted that, “We are evaporating our coal mines into the air.” He stated a novel thought: Earth’s climate would warm as we continued to burn coal, which would increase the level of atmospheric COCOCOCO2222.... An American, P. C. Chamberlain came to similar conclusions also in the 1890s. They believed this because they knew that COCOCO2CO222 absorbs and traps the infrared radiation emitted from the Earth. So, increasing levels of atmospheric COCOCO2CO222 would lead to increasing temperatures. Living in a very cold climate Arrhenius relished the possibility, and believed it might prevent the onset of another ice age. [4]
Fig. Fig.Fig.
II IIII
II---- Conservation of EnergyConservation of Energy:::: Conservation of EnergyConservation of Energy
Energy can be utilized but not consumed. It is a law of nature that energy is conserved. We degrade or randomize energy, just as we randomize mineral resources when we process ores into metal and then discard the product as we do, for example, with used aluminum cans. All energy we use goes into heat and is eventually radiated out into space.
The consumable is not energy; it is the fact that energy has not yet been randomized. The degree of randomization of energy is measured by the entropy of the energy. [5]
III IIIIII
III---- The energy resources of the planetThe energy resources of the planetThe energy resources of the planetThe energy resources of the planet::::
Before you begin, it is advisable to define the terminology. The primary energy is energy directly converted into heat, and electricity from power plants through thermo-mechanical cycles (yields 30-50%) is classified as secondary. In contrast, Hydropower is called primary electricity. The renewable energy (RE)(RE)(RE)(RE) are, in our scale time, those who are exempted by the continuously nature, they are derived from sunlight, Earth’s core and the gravitational interactions moon and sun with the ocean. Non-renewable energy ((((NRENRENRENRE)))) are derived from fossil fuels (coal, oil, natural gas ...) themselves from the action of sun for tens of millions of years, this is a fossilized biomass. The uranium used nuclear fission can also be considered as renewable because its reserves are limited. As for the fusion energy, if we master a day, it can be considered inexhaustible our scale. Perhaps one of its dangers: Excessive energy dissipation at the surface of the land could lead to changes catastrophic. Note that the man consumes today, an energy corresponding to 1 / 8000 th of solar energy that reaches the surface of the earth.
III.1. III.1. III.1.
III.1. Solar radiation:Solar radiation:Solar radiation:Solar radiation:
the energy received at the surface (total 720.1015 kW.h) varies by m² of 1100 kW.h to 2300 kW.h / year, or a power average (distributed over the year, taking into account alternating light-dark and cloudy periods) of 120 to 260 W / m² and a peak power of over 1 kW / m². Much hits the ocean and gives what is commonly called thermal energy sea is about 80 1012 kW.h (in areas Tropical: 20 ° C temperature difference between water surface and 1000 m depth).
---The set of hydrologic cycleThe set of hydrologic cycleThe set of hydrologic cycleThe set of hydrologic cycle converts 360 1015 KW.h. The evaporation of water (mainly Oceans) leads to precipitation channeled then by rivers and streams and also winds. The waves are produced by wind also a source of usable energy. The technically exploitable hydropower worth, estimated between 15 and 25 1012 KW.h.
---Wind energyWind energyWind energyWind energy also been exploited long (sail propulsion, windmills, pumps water), represents a huge resource, 32 1015 kW.h, whose share of usable land is estimated at 50 1012 kW.h / year. Much lies offshore "In fact winds much stronger off and, especially, more regularly.
---The wave The wave The wave The wave energyenergyenergy is estimated to be available 8 10energy 12 kW.h including 90 109 kW.h per year technically usable (power about 50 kW m wave front seems refundable).
---BiomassBiomassBiomassBiomass: This is the product of photosynthesis. The share renewable annually (20%) of biomass energy represents an approximately 800 to 900 1012 KW.h. Is currently 3% food, 0.6% for the timber industry and paper and 1.8% for combustion (heating and cooking). We estimate that the share reached easily exploitable 60 1012 KW.h.
--- GeothermalGeothermalGeothermalGeothermal The earth's molten core releases energy Annual approximately 300 1012 kW.h (heat flow ranging from 0.05 to 1 W / m², which is very low compared to solar radiation). Reserves exploitable are about 40 109 high kW.h energy (150 to 350 ° C, used for production electricity) and 300 109 kW.h low energy (50 to 90 ° C for heating).
--- The gravitational interactions EarthThe gravitational interactions EarthThe gravitational interactions EarthThe gravitational interactions Earth----MoonMoonMoon----SunMoon SunSunSun: the tides are the product of these interactions. The annual tidal energy is about 25.1012kW.h. A small part is used in areas of high tide with a constriction is estimated at 270 to 500,109 kW.h (plant Rance produces: 0,54 109 kW.h).
Table 1: Table 1: Table 1:
Table 1: estimating quantities of renewable energy and share exploitable. Annual resources
Annual resourcesAnnual resources
Annual resources SolarSolarSolarSolar biomassbiomassbiomassbiomass hydrologic cycle hydrologic cyclehydrologic cyclehydrologic cycle GeothermalGeothermalGeothermalGeothermal TidesTidesTidesTides overall estimate
kw.h
700*1015 4.5*1015 360*1015 300*1012 25*1012
Products --- hydro Wind wave H temp Estuary
share exploitable qq 10*1012 60*1012 20*1012 50*1012 90*109 40*109 500*109
III.2. III.2. III.2.
III.2. NonNonNonNon----renewable renewable renewable energy:renewable energy:energy:energy:
These fossil fuels: oil, coal and natural gas, for the most known, there is also, in much greater quantity but less easily exploitable oil shale. Since 1970, we have doubled our consumption of oil. The Oil accounted for 45% of energy consumed while this proportion fell to 38% today and seems to stabilize in the coming years. These energies have the advantage of low cost but the
disadvantage of being clean. However, it is
possible to reduce emissions (filtering in smokestacks, catalytic converters ...) but the price is increased.
Table 2 Table 2Table 2 Table 2::::
fossil energy fossil energyfossil energy
fossil energy oiloiloil oil CoalCoal CoalCoal Natural GasNatural GasNatural GasNatural Gas shaleshale shaleshale exploitable reserves
exploitable reservesexploitable reserves
exploitable reserves 1.8 to 2*1015 8*1015 1.2*1015 2*1015
total estimated reserves total estimated reservestotal estimated reserves
total estimated reserves 4*1015
pace 90s pace 90space 90s
pace 90s 40 years 220 years 60 years ??years
Table 2 gives an idea of reservations known but beware, the time periods indicated are very hypothetical and based on known reserves exploitable as well as the current rate of consumption. Intensive oil exploration reveals, on average each year, the equivalent of what that was consumed ... Nevertheless, we have a very limited period of exploitation of renewable energies that is difficult to assess objectively. It is thus very likely that we have exhausted the fossil fuels during
the twenty-first century. Coal reserves are
still very important (especially in India and China) and operation will probably find a strong growth over the next century. It will then need to seriously clean combustion.
---Nuclear:Nuclear:Nuclear:Nuclear:
Uranium-235 used in the fission reactions Nuclear power is an inexhaustible ore. Reserves are estimated at 580.1012 KW.h. Uranium 238, converted into fissile material in breeder reactors is
much more abundant, it would, if breeder reactors were operating at an industrial scale, a reserve of 80.1015 kW.h or 10 times the reserves known coal. Major drawback of the fission wastes, that are expensive to reprocess and after reprocessing to retain a share of them a high radioactivity to long life. Their storage poses the problem of sustainability and memory sites.
The merger is expected to free ourselves from the problem of waste as it is supposed to be clean. Deuterium and tritium are abundant enough: a liter of Water Sea contains, in deuterium, which provide an MW.h. The tritium must be manufactured, for example from lithium which would provide the land resources 200.10200.10200.10200.1015151515 kW.hkW.h and those oceans kW.h 10kW.hkW.h kW.h 10kW.h 10kW.h 1021212121 (the million years at current rates). But all this is still fiction.
IV. IV. IV.
IV. What is a ton of COWhat is a ton of COWhat is a ton of COWhat is a ton of CO2222????
At the Copenhagen summit, a huge cube of side 8.2 m (equivalent to a three-story building) was installed on a lake in the Danish capital. It represents the volume occupied by one tone of COCOCOCO2222, the normal atmospheric pressure. It is also the amount of COCOCOCO2222 as the average person in an industrialized country emits each month. Every day 80 million tones of COCOCOCO2222 are emitted worldwide. In one year, an American rejects 22.9 tons of COCOCOCO2222,,,, a European 10.6 tons, a sub-Saharan Africa 4.5 tones and India 1.8 tones of COCOCO2CO222.
Fig. Fig.Fig.
Fig.2.2.2. View a ton of CO2. 2.
Another view is offered to us by CO2 logic:
A ball of the Atomium could contain 5 tons of pure CO2. Emissions of CO2 equivalent each year by Belgian content of more than two balls of the Atomium. On the scale of Belgium, the equivalent content of 30 million balls of the Atomium is issued annually. Imagine 30 million balls of the Atomium in the sky...