1 Differential acute impacts of sleeve gastrectomy, Roux-en-Y gastric bypass surgery and matched caloric restriction diet on insulin secretion, insulin effectiveness and non-esterified fatty acid levels among patients with type 2 diabetes
Thomas F, Smith G, Lu J, Babor R, Booth M, Beban G, Chase JG, Murphy R.
Manuscript type: Original Contribution Authors:
Felicity, Thomas, BE(Hons)**
Department of Mechanical Engineering, University of Canterbury,
Private Bag 8140,
Christchurch, New Zealand
felicity.thomas@pg.canterbury.ac.nz Greg C Smith Department of Pharmacology UNSW Australia Kensington, 2033 Sydney, Australia g.smith@unsw.edu.au Jun Lu, PhD
School of Applied Sciences and School of Interprofessional Health Studies Faculty of Health and Environmental Sciences
and Institute of Biomedical Technology Auckland University of Technology Private Bag 92006, Box A-25 Auckland 1142, New Zealand
jun.lu@aut.ac.nz
Richard Babor MBChB, FRACS Department of General Surgery. Middlemore Hospital.
Private Bag 93311 Otahuhu. Auckland 1640
Richard.Babor@middlemore.co.nz
Michael Booth MBChB FRACS Department of General Surgery Waitemata District Hospital Board Shakespeare Rd
Takapuna Auckland
Michael.Booth@waitematadhb.govt.nz
Grant Beban MBChB, FRACS Department of General Surgery Auckland City Hospital
Park Rd Grafton Auckland 1023
2
J, Geoffrey, Chase, PhD
Department of Mechanical Engineering University of Canterbury
Private Bag 8140,
Christchurch, New Zealand
geoff.chase@canterbury.ac.nz
Rinki Murphy, MBChB, FRACP, PhD Department of Medicine
Faculty of Medical and Health Sciences University of Auckland
Private Bag 92019, Auckland, New Zealand
R.Murphy@auckland.ac.nz **Corresponding author
Running Title: Bariatric surgery and dietary impact on glucose metabolism
Financial Support: This study was funded by the A+ research trust and Jens Henrik Jensen fund Acknowledgements: We acknowledge Dr Shelley Yip for her assistance with this study.
Keywords: Roux-en-Y gastric bypass, Sleeve gastrectomy, very low calorie diet, obesity, type 2 diabetes, non-esterified fatty acid, insulin secretion
3 Abstract
Background:
Bariatric surgery is an increasingly common option for control of type 2 diabetes (T2D) and obesity. Mechanisms underlying rapid improvement of T2D after different types of bariatric surgery are not clear. Caloric deprivation and altered levels of non-esterified fatty acid (NEFA) have been proposed. This study examines how sleeve gastrectomy (SG), Roux-en-Y gastric bypass (GBP) or matched hypocaloric diet (DT) achieves improvements in T2D by characterising components of the glucose metabolism and NEFA levels before and 3 days after each intervention.
Methods:
Plasma samples at 5 time points during oral glucose tolerance test (OGTT) from subjects with T2D undergoing GBP (N = 11) or SG (N = 12) were analysed for C-peptide, insulin and glucose before surgery and 3 days post intervention or after DT (N=5). Fasting palmitic, linoleic, oleic and stearic acid were measured. C-peptide measurements were used to model insulin secretion rate (ISR) using deconvolution.
Results:
Subjects who underwent GBP surgery experienced the greatest improvement in glycaemia (median reduction in BG from basal by 29% [IQR -57, -18]) and greatest reduction in all NEFA measured. SG achieved improvement in glycaemia with lower ISR and reduction in all but palmitoleic acid. DT subjects achieved improvement in glycaemia with an increase in ISR, 105% [IQR, 20, 220] and stearic acid.
Conclusions:
GBP, SG and DT each improve glucose metabolism through different effects on pancreatic beta cell function, insulin sensitivity and free fatty acids.
4
Introduction
Bariatric surgery is an increasingly common and effective therapeutic option for control of type 2 diabetes (T2D) and obesity [1, 2]. Rapid improvement of fasting glucose, insulin secretion and insulin resistance has been reported within days of Roux-en-Y gastric bypass (GBP) [3-5] and sleeve gastrectomy (SG) [6, 7]. Hypocaloric dieting has also been shown to restore normal glucose levels [8, 9]. Although the precise mechanisms underlying such early diabetes remission are not known, caloric deprivation and decreased levels of non-esterified fatty acid (NEFA) have been proposed [10].
NEFA levels are commonly elevated in those suffering from obesity and T2D [11, 12] due to increased fat mass and cell size in both subcutaneous and intra-abdominal fat tissues and excessive lipolysis in adipose tissues [13]. Chronically elevated plasma NEFA have been shown to contribute to β-cell dysfunction in T2D [14-16]. Furthermore, studies indicate that elevated plasma NEFA may directly contribute to the advance of insulin resistance both in the periphery and the liver [17, 18].
Among obese patients with T2D, all three treatments: SG, GBP or hypocaloric diet are known to improve glycaemia [8, 9, 19]. Bariatric surgery has also been shown to decrease NEFA concentrations within one week after intervention [10]. This is consistent with the anti-lipolytic effect of insulin that lowers plasma NEFA by inhibiting the release of fatty acid from adipose tissue [20]. However, short term exposure to very low calorie diet has been shown to increase plasma NEFA [9, 21, 22]. The aim of this study was to examine how each treatment (SG, GBP or matched hypocaloric diet) achieves improvements in glycaemia by characterising the different components of glucose metabolism and levels of non-esterified fatty acids (NEFAs) before and 3 days after each intervention. This study investigates the acute effects of surgery and matched surgical diet at 3 days to avoid confounding effects of weight loss and also to avoid difficulties of maintaining such matched surgical diet longer term in patients not having surgery.
5
Methods
Patients
Patients with T2D scheduled for either laparoscopic GBP or SG in three different hospitals in the Auckland region (Auckland City Hospital, North Shore Hospital and Middlemore Hospital) between August 2010 and March 2012 were recruited for the study. Patients on the waiting list for bariatric surgery were recruited to the matched surgical diet (DT) group. Patients with T2D, between 18 and 50 years of age, were eligible for the study if BMI was at least 35 kg/m2. Patients receiving insulin therapy, incretin hormone-based therapy or diet controlled T2D were excluded. Table 1 summarises the subject characteristics. Informed consent was obtained from all individual participants included in the study.
All subjects consented to have a 75 g oral glucose tolerance test (OGTT) the day before and at 3 days after each intervention. All patients had oral glucose lowering medications withheld from the night prior to each baseline OGTT until at least their second OGTT, or longer in those who received surgery. Those in the DT control group were asked to undergo equivalent caloric intake as patients in the surgical group for 3 days of observation, including fasting overnight prior to another 24 h of fasting (sips of water only) followed by free oral fluids and three servings of Optifast® on the second and third days. All participants were asked to keep a diary of their oral intake.
Those who participated in the DT arm of the study were invited to take part again when they were scheduled for either GBP or SG surgery, provided this occurred at least 2 weeks after their DT measurements. This minimum 2-week washout period was to ensure that the caloric-matched control intervention did not increase the optimisation of such surgical patients, beyond the routine pre-surgical optimisation with Optifast® diet for 3 weeks. This study was approved by local ethics committee (Northern X Regional ethics committee), and all patients gave informed written consent.
6 Table 1: Summary of subject characteristic. Data shown as median [IQR] where appropriate.
Matched caloric intake without surgery
(DT)
Sleeve Gastrectomy (SG)
Gastric Bypass Surgery (GBP) N 5 11 11 Age (years) 45 [39 53] 45 [43 49] 41 [38 46] Gender (M/F) 2/3 3/8 1/10 BMI (kg/m2) 47.8 [38 50] 42.2 [40 48] 44.5 [40 49] HbAIc (mmol/mol) 57 [55 67] 45 [45 66] 53 [51 64]
Duration of Diabetes (years) 2 [2 3] 3 [2 4] 4 [1.5 5]
Surgical Protocol
Patients scheduled for either laparoscopic GBP or SG were prescribed a hypocaloric diet with three servings of Optifast® (152 cal) plus vegetables daily during the 3 weeks prior to surgery. All patients fasted from midnight before surgery. The GBP involved a 100 cm antecolic Roux limb with hand sewn pouch-jejunostomy, a 60 cm biliopancreatic limb and a hand sewn small bowel anastomosis. The SG involved a longitudinal resection of the stomach against a 32 French bougie from just lateral to the angle to His to 2 cm proximal to the pylorus. Post-operative intravenous fluids with Plasmalyte® were administered until oral fluid intake was 1 L per day (approximately 48 h). Sips of water occurred on day 1, followed by free oral fluids from day 2 with clear soups, low fat smoothies or Optifast® very low calorie diet.
OGTT and NEFA’s
Plasma samples for glucose, C-peptide and insulin were collected at 0, 30, 60, 90 and 120 min after ingestion of 75 g oral glucose (dissolved in 75 mL water). Glucose was measured by autoanalyzer (Hitachi High Technologies Corporation). Insulin and C-peptide were measured using the Human Metabolic Hormone Panel (Milliplex, Millipore, MA, USA). Five NEFAs in plasma, including Palmitic, Stearic, Oleic, Palmitoleic and Linoleic acid, were measured using an Agilent 6420 triple quadrupole LC-MS/MS system with margaric acid added in the samples as an internal standard. Chromatographic separation was achieve by using a VisionHT C18, 3 µm, 2.1X50 mm column (Grace Davidson, Auckland, NZ) with guard. MS2 single ion monitoring (SIM) was set at 253, 255, 269, 279, 281,283 corresponding
7 to palmitoleic, palmitic, margaric, linoleic, oleic and stearic acid, respectively, to detect and measure the five NEFAs and the internal standard.
Analysis
C-peptide measurements taken every 30mins during the course of the OGTT were used to model subject-specific insulin secretion using deconvolution [23]. Kinetic parameters were based on the subject’s age and population parameters for T2D subjects.
To assess the change in response to the OGTT for each patient, the change in area above basal was calculated for each metric. Area above basal is the area between the measured basal value (t = 0) and the measured blood glucose (BG), measured plasma insulin (PI), and estimated subject-specific insulin secretion rate (ISR) profile over the course of the OGTT. These areas are shown in Figure 1. The percentage change was calculated as the post-intervention area above basal subtracted from the pre-intervention area above basal and divided by the pre-pre-intervention area above basal. Thus, a negative change in the BG area above basal represents a better uptake of the 75g glucose load given in the OGTT. The per-subject percentage change and the median and interquartile range (IQR) was calculated for each intervention type.
8 Figure 1: Example displaying the areas above basal for blood glucose (red), Plasma Insulin (green) and Insulin Secretion (blue) for a subject’s response to an OGTT
Results
The majority of subjects experienced an improvement in their glycaemic response to an OGTT test after the intervention (3/5 DT, 9/11 SG and 9/11 GBP patients showed glycaemic improvement). Overall, subjects who underwent GBP or SG surgery experienced significant improvement in glycaemia with a median reduction of BG above basal of -29% [IQR -57, -18] after GBP and -19% [IQR -41,-7.3] after SG, as seen in Table 2. DT subjects experienced a non-significant BG reduction although all stopped their oral glucose lowering therapy during the acute period of observation. The DT patients achieved a lack of glucose deterioration through an increase in ISR, 105% [IQR, 20, 220] while the SG and GBP subjects displayed no significant change in ISR. SG experienced decreased plasma insulin above basal area while GBP and DT subjects did not have significant change in their plasma insulin.
0 20 40 60 80 100 120 5 10 15 Time (min) B lo o d G lu c o s e (m m o l/ L ) 0 20 40 60 80 100 120 0 10 20 30 40 50 Time (min) P la m a I n s u lin (m U /L ) 0 20 40 60 80 100 120 0 10 20 30 Time (min) In s u lin S e c re ti o n (m U /L m in )
9 Insulin sensitivity estimated by HOMA-IR did not change significantly among any of the 3 groups as show in column 5 of Table 2.
The 5 GBP and 5 SG subjects in quadrant C of Figure 3 improved glycaemia with decreased ISR above basal area, indicating greater insulin sensitivity. The 4 GBP, 4 SG and 3 DT subjects in quadrant A improved glycaemia with an increased ISR indicating improved beta cell function. In contrast, the 2 SG subjects in quadrant D had a worse glycaemic response with decreased ISR indicating decreased beta cell function. Finally, the 2 GBP and 2 DT subjects in quadrant B had a worse glycaemic response despite increased ISR, indicating reduced sensitivity.
In Figure 4 quadrant C, 7 SG, 5 GBP and 2 DT achieved an improvement in glycaemia with a decrease in PI indicating improved uptake of glucose. The 2 SG, 4 GBP and 1 DT in quadrant A had improved glycaemia and increased PI indicating a greater improvement in sensitivity, especially for GBP subjects 29 and 08 who also reduced their ISR above basal area. Quadrant D contains 2 SG and 1 GBP subjects who had reduced PI and worse glycaemic response, indicating increased insulin losses to kidneys and liver for GBP 19 who had increased ISR area above basal. Quadrant B represents those who have increased PI and worse glycaemic response, indicating increased insulin resistance especially as all subjects in this quadrant have increased ISR above basal area.
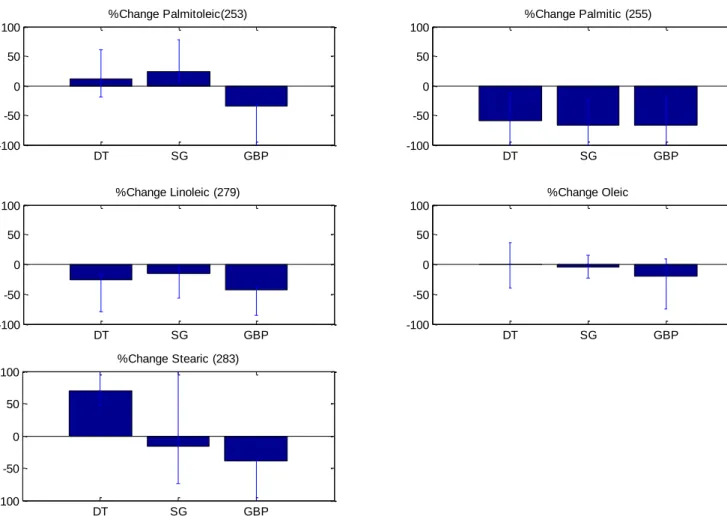
Figure 2 highlights the overall percentage change in the basal NEFA’s measured before and 3 days after each intervention. Subjects in all three intervention groups experienced a significant decrease in palmitic acid. In addition, those who underwent GBP surgery also experienced a significant reduction in linoleic acid.
10 Table 2: Summary per patient of diabetes medications pre-intervention and %change in above basal areas of BG, ISR and PI. Data shown as median [IQR] where appropriate. Significant parameters have been marked with *
Intervention Subject Number Metformin (g/day) Glipizide or Gliclazide (mg/day) %Change in HOMA-IR %Change area above Basal for
BG
%Change area above Basal
for ISR
%Change area above Basal for
PI DT 11 2 -78.49 15.38 197.93 140.70 DT 12 2 115.96 -47.66 16.48 -23.76 DT 16 2 20 -0.26 -25.13 105.25 112.36 DT 17 2 -38.55 46.37 20.82 20.55 DT 20 2 -58.15 -38.07 280.55 -37.00 Median [IQR] 2 [2 2] n/a -38.6 [-68 58] -25.1 [-41 23] 105 [20 220]* 20.5 [-27 120] SG 3 2 -69.08 -42.60 -72.64 -40.54 SG 4 2 10 -55.73 -10.41 87.55 135.52 SG 12 2 63.72 -46.04 14.62 -41.28 SG 23 1.5 10 -54.26 -19.04 14.64 79.64 SG 24 1 -36.33 59.89 -79.37 -16.56 SG 26 0 58.49 -36.79 -3.48 -27.12 SG 27 2.55 10 -77.83 166.83 -46.52 -6.70 SG 30 1.5 126.06 -30.70 -30.49 -26.31 SG 34 0 10 171.98 -47.18 -23.03 -39.38 SG 35 3 -1.13 -6.29 2.27 -26.82 SG 36 3 -29.10 -11.98 -7.46 -27.93 Median [IQR] 2 [ 1.1 2.4] n/a -29.1 [-56 64] 19.0 [41 -7.3]* -7.50 [-43 12] 26.8 [ 37 -9.2]* GBP 2 1 15.62 -47.56 -34.16 -1.05 GBP 8 3 179.05 -63.66 -35.53 24.65 GBP 13 2 5 -74.33 -22.61 107.80 -27.81 GBP 19 1 -80.88 52.63 21.97 -202.30 GBP 21 1 55.68 47.12 30.66 38.76 GBP 29 2.55 417.91 -96.49 -2.65 92.50 GBP 33 2 -39.51 -33.27 6.49 -11.06 GBP 38 3 -81.25 -17.21 -12.64 -44.33 GBP 39 3 29.27 -29.95 70.95 13.30 GBP 40 3 480 10.55 -60.00 72.93 94.82 GBP 41 2 28.47 -21.53 -51.24 -47.34 Median [IQR] 2 [1.3 3] n/a 15.6 [-74 56] 29.4 [57 -18]* 6.49 [-29 61] -1.05 [-40 35]
11 Figure 2: Over all cohort percentage change in basal NEFA's measured pre and 3 day post intervention. Data shown as median [IQR] where appropriate.
DT SG GBP -100 -50 0 50 100 %Change Palmitoleic(253) DT SG GBP -100 -50 0 50 100 %Change Palmitic (255) DT SG GBP -100 -50 0 50 100 %Change Linoleic (279) DT SG GBP -100 -50 0 50 100 %Change Oleic DT SG GBP -100 -50 0 50 100 %Change Stearic (283)
12 Figure 3: % Change in area above basal BG vs. ISR. Quadrants A, B, C and D highlight the different responses of each subject. Those in quadrant C have achieved an improvement in glycaemia with a decrease in ISR indicating greater insulin sensitivity. Quadrant A represents those who have achieved an improvement in glycaemic with an increase in insulin secretion indicating improved beta cell function. D represents those who have reduced their ISR and have had a worse glycaemic response indicating decreased beta cell function. B represents those who have increased ISR and have had a worse glycaemic response indicating reduced sensitivity.
-100 -50 0 50 100 150 -100 -50 0 50 100 150 200 250 02
BG Area Change above Basal (%)
IS A re a C h a n g e a b o v e B a s a l (% ) 03 04 08 11 12 12 13 16 17 19 20 21 23 24 26 27 29 30 33 34 35 36 38 39 40 41 DT SG GBP A B C D IS R
13 Figure 4: % Change in area above basal BG vs. PI. Quadrants A, B, C and D highlight the different responses of each subject. Those in quadrant C have achieved an improvement in glycaemia with a decrease in PI indicating improved uptake of glucose. Quadrant A represents those who have achieved an improvement in glycaemic with an increase in PI indicating an improvement in sensitivity if ISR has reduced. D represents those who have reduced their PI and have had a worse glycaemic response indicating increased insulin losses to kidneys and liver if ISR has increased. B represents those who have increased PI and have had a worse glycaemic response indicating increased resistance.
Discussion
The two surgical treatments (SG and GBP), but not matched DT, provided significant improvements in glycaemia among patients with T2D controlled with oral agents. Greater extent of glycaemic improvement was seen after GBP than after SG. DT patients achieved lack of glucose deterioration despite stopping their oral glucose lowering therapy by increasing ISR. ISR was unchanged after SG and GBP, but patients following SG had significantly decreased plasma insulin.
Increasing insulin secretion rate is not thought to be the most sustainable method for achieving glycaemic control due to beta-cell exhaustion, and combined with the fact that it is difficult to sustain such dramatic caloric restriction for a prolonged length of time. However, reducing NEFA levels is likely
-100 -50 0 50 100 150 -200 -150 -100 -50 0 50 100 02
BG Area Change above Basal (%)
P I A re a C h a n g e a b o v e B a s a l (% ) 03 04 08 11 12 12 13 16 17 19 20 21 23 24 26 27 29 30 33 34 36 35 38 39 40 41 DT SG GBP A B C D
14 to be a more sustainable method for achieving glycaemic control as chronically elevated plasma NEFA have been shown to contribute to β-cell dysfunction in T2D [14-16]. Furthermore, studies indicate that elevated plasma NEFA may directly contribute to the advance of insulin resistance both in the periphery and the liver [17, 18] . These reasons are likely why long term diabetes remission after diet (and to a less extent after SG [24, 25]) is less than that achieved by GBP.
Assessing beta-cell function is problematic because insulin secretion by beta-cells is adaptive to chronic stimuli, such as weight changes and acute challenges such as fasting and feeding. The secretory indexes that reflect long-term adaptation from those that result from the dynamic behaviour of the beta cell are basal insulin secretion and total insulin output versus beta-cell glucose sensitivity (the slope of the insulin secretion/plasma glucose dose response relationship) which is the ability to control glycaemia by promptly releasing sufficient insulin. This key function is what we have captured in the %Change area above Basal for ISR derived from OGTT as we capture the total insulin secretion in response to a glucose challenge and its change acutely after the intervention before the long-term weight loss related effects have taken place. %Change above basal refers to the additional amount of insulin secreted in response to the oral glucose load beyond the basal level.
Other studies reporting changes in beta cell function with bariatric surgery show that fasting insulin concentrations or secretion rates and total insulin output in response to oral glucose are all found to decrease after most types of bariatric surgery [26-29]. This change is attributed to reduced adipose mass and improved insulin sensitivity. AIR and insulinogenic index after GBP have been shown to progressively improve over time, paralleling ongoing weight loss. What the results from this study add, is the comparative change in insulin secretion leading to better glycaemic response as early as 3 days after GBP, SG and matched caloric restriction, when there has been little change in adipose mass.
Bariatric surgery is reported to improve the insulin sensitivity in obese patients with T2D by up to 50% in the first 6 weeks when only a small reduction in BMI has occurred, of around 10% [30]. Subsequently, after four months, when BMI has dropped by around 30%, insulin sensitivity does not
15 improve by much more. This has been attributed to the fact that early after surgery, caloric restriction plays a major role in improving insulin sensitivity. Months to years after surgery, once weight loss has stabilised, then a quantitative relationship between the changes in BMI and insulin sensitivity is evident. It is not clear whether there is a greater insulin sensitising power of GBP than SG, although biliopancreatic diversions have been shown to be the most effective in this regard [30]. While HOMA-IR did not significantly alter acutely after any of the three interventions, this may have been masked by the withdrawal of metformin therapy, an insulin sensitising medication.
An explanation for those not seeing improvement, quadrants B and D in Figure 2 and 3, can be found in the trade-off between plasma insulin, insulin secretory rate and BG. Subjects who increase their ISR may also increase their plasma insulin proportionally – highlighting that while more is being secreted it is failing to be used in the uptake of glucose to cells. DT subjects 11 and 17, and GBP subject 21, all display this reduced uptake of glucose and increase in glycaemic response. In addition, all but two subjects were on metformin and several were also using sulfonylureas pre-operatively (SG 26 and 34). These drugs were not removed from the participants until midnight before the first OGTT test. Thus, those patients who have not improved (quadrants B and D of Figures 2 and 3) have not been able to achieve the same level of glycaemic control as with their medications, not that they do not possibly have some small improvement from the glycaemic response they would achieve without medication or intervention.
Limitations
The main limitation of this study is the low cohort numbers especially within the DT group. It is difficult to obtain significant trends in a small data set. However, this initial proof of concept investigation has shown that it is worth pursuing this avenue of investigation. A larger cohort study is the next step to proving that the patterns underlying improvement in glycaemia are specific to each type of intervention and assessing the variability in mechanisms involved. Whether this will be able to assist in determining the most appropriate therapy and/or the risk of failure to respond for patients with different underlying glucose abnormalities is yet to be demonstrated.
16 One of the difficulties with defining the best treatment for different patients, is the lack of accurate phenotyping of patients with T2D. Even duration of diabetes is dependent on the screening practice for T2D and degree of patient concern around presentation with minor osmotic symptoms, leading to variable delays in diagnosis. While triglycerides and total cholesterol, HDL and LDL cholesterol are measured as part of cardiovascular risk profiling, NEFAs are currently not measured in routine clinical practice. Fasting insulin, C-peptide and OGTTs are also not frequent in routine clinical practice.
Another limitation is the fact that patients were on their diabetes medication up until midnight before the first OGTT results. This makes it difficult to gauge the improvement of those non-responsive patients. It is unknown what residual metformin effects are acting on each individual and it is likely that two patients with the same levels of metformin will have different outcome effects on glucose metabolism. However, the trends found are still valid as long as one considers no improvement a success as the subject is able to respond without the aid of medication in the same way as when using medication.
The third limitation is the infrequent sampling interval of C-peptide. Sampling every 30 minutes provides a good indication using Van Cauter et al. [23] deconvolution method of the insulin secreted but more frequent sampling ~15mins would provide a much more accurate approximation of the insulin secretion levels.
Finally, the short interval of three days post-surgery was selected to avoid confounding effects of weight loss and also to avoid difficulties of maintaining such matched surgical diet longer term in patients not having surgery. Following the acute stress response to surgery, these patients may not have recovered to steady-state, however, continuous glucose measurements of these patients taken preoperatively, indicate return of glycaemic fluctuations to pre-operative levels from 24 hours after surgery [31].
17
Conclusion
GBP achieves the largest improvement in glycaemia which may be linked to its success in reducing both linoleic and palmitic NEFA concentrations. SG achieves significant improvement in glycaemia with lower plasma insulin increasing the effectiveness of the insulin secreted. While DT did not achieve significant improvement in glycaemia, it was associated with a significant increase in ISR. These results indicate that GBP, SG and DT each improve glucose metabolism through different effects on pancreatic beta cell function, insulin sensitivity and free fatty acids. However, it is important to note that C-peptide, insulin and glucose levels measured so soon after SG or GBP surgery do not necessarily indicate the extent of diabetes remission long term.
Conflict of Interest Disclosure Statement: The authors declare that they have no conflict of interest A Statement of Informed Consent: Informed consent was obtained from all individual participants included in the study
References
1. Kashyap, S.R., et al., Bariatric surgery for type 2 diabetes: weighing the impact for obese patients. Cleve Clin J Med, 2010. 77(7): p. 468-76.
2. Buchwald, H., et al., Weight and Type 2 Diabetes after Bariatric Surgery: Systematic Review and Meta-analysis. American Journal of Medicine, 2009. 122(3): p. 248-U81.
3. Pories, W.J., et al., Who Would Have Thought It - an Operation Proves to Be the Most Effective Therapy for Adult-Onset Diabetes-Mellitus. Annals of Surgery, 1995. 222(3): p. 339-352.
4. Isbell, J.M., et al., The Importance of Caloric Restriction in the Early Improvements in Insulin Sensitivity After Roux-en-Y Gastric Bypass Surgery. Diabetes Care, 2010. 33(7): p. 1438-1442. 5. Kashyap, S.R., et al., Acute effects of gastric bypass versus gastric restrictive surgery on
beta-cell function and insulinotropic hormones in severely obese patients with type 2 diabetes. International Journal of Obesity, 2010. 34(3): p. 462-471.
6. Bayham, B.E., et al., Early Resolution of Type 2 Diabetes Seen After Roux-en-Y Gastric Bypass and Vertical Sleeve Gastrectomy. Diabetes Technology & Therapeutics, 2012. 14(1): p. 30-34.
18 7. Ramon, J.M., et al., Effect of Roux-en-Y Gastric Bypass vs Sleeve Gastrectomy on Glucose and
Gut Hormones: a Prospective Randomised Trial. Journal of Gastrointestinal Surgery, 2012. 16(6): p. 1116-1122.
8. Henry, R.R., L. Scheaffer, and J.M. Olefsky, Glycemic effects of intensive caloric restriction and isocaloric refeeding in noninsulin-dependent diabetes mellitus. J Clin Endocrinol Metab, 1985. 61(5): p. 917-25.
9. Lim, E.L., et al., Reversal of type 2 diabetes: normalisation of beta cell function in association with decreased pancreas and liver triacylglycerol. Diabetologia, 2011. 54(10): p. 2506-14. 10. Salinari, S., et al., Twenty-four hour insulin secretion and beta cell NEFA oxidation in type 2
diabetic, morbidly obese patients before and after bariatric surgery. Diabetologia, 2008. 51(7): p. 1276-84.
11. Reaven, G.M., et al., Measurement of Plasma-Glucose, Free Fatty-Acid, Lactate, and Insulin for 24-H in Patients with Niddm. Diabetes, 1988. 37(8): p. 1020-1024.
12. Yue, K.T., et al., Effect of glucose on plasma concentrations of individual non-esterified fatty acids of non-diabetic and insulin-independent diabetic men. Postgrad Med J, 1981. 57(672): p. 622-6.
13. Schaffer, J.E., Lipotoxicity: when tissues overeat. Curr Opin Lipidol, 2003. 14(3): p. 281-7. 14. Unger, R.H., Lipotoxicity in the Pathogenesis of Obesity-Dependent Niddm - Genetic and
Clinical Implications. Diabetes, 1995. 44(8): p. 863-870.
15. McGarry, J.D. and R.L. Dobbins, Fatty acids, lipotoxicity and insulin secretion. Diabetologia, 1999. 42(2): p. 128-138.
16. Sako, Y. and V.E. Grill, A 48-Hour Lipid Infusion in the Rat Time-Dependently Inhibits Glucose-Induced Insulin-Secretion and B-Cell Oxidation through a Process Likely Coupled to Fatty-Acid Oxidation. Endocrinology, 1990. 127(4): p. 1580-1589.
17. Boden, G., Role of fatty acids in the pathogenesis of insulin resistance and NIDDM. Diabetes, 1997. 46(1): p. 3-10.
18. Shulman, G.I., Cellular mechanisms of insulin resistance. Journal of Clinical Investigation, 2000. 106(2): p. 171-176.
19. Yip, S., L.D. Plank, and R. Murphy, Gastric bypass and sleeve gastrectomy for type 2 diabetes: a systematic review and meta-analysis of outcomes. Obes Surg, 2013. 23(12): p. 1994-2003. 20. Bierman, E.L., I.L. Schwartz, and V.P. Dole, Action of insulin on release of fatty acids from
tissue stores. Am J Physiol, 1957. 191(2): p. 359-62.
21. Hirsch, J. and R.B. Goldrick, Serial Studies on the Metabolism of Human Adipose Tissue. I. Lipogenesis and Free Fatty Acid Uptake and Release in Small Aspirated Samples of Subcutaneous Fat. J Clin Invest, 1964. 43: p. 1776-92.
22. Gray, D.S., et al., Changes in individual plasma free fatty acids in obese females during fasting and refeeding. Int J Obes, 1991. 15(2): p. 163-8.
23. Van Cauter, E., et al., Estimation of insulin secretion rates from C-peptide levels. Comparison of individual and standard kinetic parameters for C-peptide clearance. Diabetes, 1992. 41(3): p. 368-77.
24. Lee, W.J., et al., Gastric bypass vs sleeve gastrectomy for type 2 diabetes mellitus: a randomized controlled trial. Arch Surg, 2011. 146(2): p. 143-8.
25. Schauer, P.R., et al., Bariatric surgery versus intensive medical therapy in obese patients with diabetes. N Engl J Med, 2012. 366(17): p. 1567-76.
26. Dixon, J.B. and P.E. O'Brien, Health outcomes of severely obese type 2 diabetic subjects 1 year after laparoscopic adjustable gastric banding. Diabetes Care, 2002. 25(2): p. 358-63. 27. Ballantyne, G.H., et al., Short-term changes in insulin resistance following weight loss surgery
for morbid obesity: laparoscopic adjustable gastric banding versus laparoscopic Roux-en-Y gastric bypass. Obes Surg, 2006. 16(9): p. 1189-97.
28. Camastra, S., et al., Beta-cell function in severely obese type 2 diabetic patients: long-term effects of bariatric surgery. Diabetes Care, 2007. 30(4): p. 1002-4.
19 29. Mari, A., et al., Restoration of normal glucose tolerance in severely obese patients after
bilio-pancreatic diversion: role of insulin sensitivity and beta cell function. Diabetologia, 2006. 49(9): p. 2136-43.
30. Ferrannini, E. and G. Mingrone, Impact of different bariatric surgical procedures on insulin action and beta-cell function in type 2 diabetes. Diabetes Care, 2009. 32(3): p. 514-20. 31. Yip, S., et al., Lower glycemic fluctuations early after bariatric surgery partially explained by
caloric restriction. Obes Surg, 2014. 24(1): p. 62-70.
Figure Legend
Figure 5: Example displaying the areas above basal for blood glucose (red), Plasma Insulin (green) and Insulin Secretion (blue) for a subject’s response to an OGTT
Figure 6: Over all cohort percentage change in basal NEFA's measured pre and 3 day post intervention. Data shown as median [IQR] where appropriate.
Figure 7: % Change in area above basal BG vs. ISR. Quadrants A, B, C and D highlight the different responses of each subject. Those in quadrant C have achieved an improvement in glycaemia with a decrease in ISR indicating greater insulin sensitivity. Quadrant A represents those who have achieved an improvement in glycaemic with an increase in insulin secretion indicating improved beta cell function. D represents those who have reduced their ISR and have had a worse glycaemic response indicating decreased beta cell function. B represents those who have increased ISR and have had a worse glycaemic response indicating reduced sensitivity.
Figure 8: % Change in area above basal BG vs. PI. Quadrants A, B, C and D highlight the different responses of each subject. Those in quadrant C have achieved an improvement in glycaemia with a decrease in PI indicating improved uptake of glucose. Quadrant A represents those who have achieved an improvement in glycaemic with an increase in PI indicating an improvement in sensitivity if ISR has reduced. D represents those who have reduced their PI and have had a worse glycaemic response indicating increased insulin losses to kidneys and liver if ISR has increased. B represents those who have increased PI and have had a worse glycaemic response indicating increased resistance
20 Table List
Table 3: Summary of subject characteristic. Data shown as median [IQR] where appropriate. Matched caloric
intake without surgery (DT)
Sleeve Gastrectomy (SG)
Gastric Bypass Surgery (GBP) N 5 11 11 Age (years) 45 [39 53] 45 [43 49] 41 [38 46] Gender (M/F) 2/3 3/8 1/10 BMI (kg/m2) 47.8 [38 50] 42.2 [40 48] 44.5 [40 49] HbAIc (mmol/mol) 57 [55 67] 45 [45 66] 53 [51 64]
21 Table 4: Summary per patient of diabetes medications pre-intervention and %change in above basal areas of BG, ISR and PI. Data shown as median [IQR] where appropriate. Significant parameters have been marked with *
Intervention Subject Number Metformin (g/day) Glipizide or Gliclazide (mg/day) %Change in HOMA-IR %Change area above Basal for
BG
%Change area above Basal
for ISR
%Change area above Basal for
PI DT 11 2 -78.49 15.38 197.93 140.70 DT 12 2 115.96 -47.66 16.48 -23.76 DT 16 2 20 -0.26 -25.13 105.25 112.36 DT 17 2 -38.55 46.37 20.82 20.55 DT 20 2 -58.15 -38.07 280.55 -37.00 Median [IQR] 2 [2 2] n/a -38.6 [-68 58] -25.1 [-41 23] 105 [20 220]* 20.5 [-27 120] SG 3 2 -69.08 -42.60 -72.64 -40.54 SG 4 2 10 -55.73 -10.41 87.55 135.52 SG 12 2 63.72 -46.04 14.62 -41.28 SG 23 1.5 10 -54.26 -19.04 14.64 79.64 SG 24 1 -36.33 59.89 -79.37 -16.56 SG 26 0 58.49 -36.79 -3.48 -27.12 SG 27 2.55 10 -77.83 166.83 -46.52 -6.70 SG 30 1.5 126.06 -30.70 -30.49 -26.31 SG 34 0 10 171.98 -47.18 -23.03 -39.38 SG 35 3 -1.13 -6.29 2.27 -26.82 SG 36 3 -29.10 -11.98 -7.46 -27.93 Median [IQR] 2 [ 1.1 2.4] n/a -29.1 [-56 64] 19.0 [41 -7.3]* -7.50 [-43 12] 26.8 [ 37 -9.2]* GBP 2 1 15.62 -47.56 -34.16 -1.05 GBP 8 3 179.05 -63.66 -35.53 24.65 GBP 13 2 5 -74.33 -22.61 107.80 -27.81 GBP 19 1 -80.88 52.63 21.97 -202.30 GBP 21 1 55.68 47.12 30.66 38.76 GBP 29 2.55 417.91 -96.49 -2.65 92.50 GBP 33 2 -39.51 -33.27 6.49 -11.06 GBP 38 3 -81.25 -17.21 -12.64 -44.33 GBP 39 3 29.27 -29.95 70.95 13.30 GBP 40 3 480 10.55 -60.00 72.93 94.82 GBP 41 2 28.47 -21.53 -51.24 -47.34 Median [IQR] 2 [1.3 3] n/a 15.6 [-74 56] 29.4 [57 -18]* 6.49 [-29 61] -1.05 [-40 35]
![Table 1: Summary of subject characteristic. Data shown as median [IQR] where appropriate](https://thumb-eu.123doks.com/thumbv2/123doknet/6704368.184308/6.892.109.835.137.331/table-summary-subject-characteristic-data-shown-median-appropriate.webp)


![Table 3: Summary of subject characteristic. Data shown as median [IQR] where appropriate](https://thumb-eu.123doks.com/thumbv2/123doknet/6704368.184308/20.892.82.816.204.398/table-summary-subject-characteristic-data-shown-median-appropriate.webp)
