Journal of Agricultural Science; Vol. 8, No. 2; 2016 ISSN 1916-9752 E-ISSN 1916-9760 Published by Canadian Center of Science and Education
Production of New Cotton Interspecific Hybrids with Enhanced Fiber
Fineness
Nacoulima Lalaissa Nafissatou1, Diouf Fatimata Hassedine1, Konan N’guessan Olivier2 & Mergeai Guy1 1 Laboratory of Tropical Agroecology and Horticulture, Gembloux Agro-Biotech, University of Liège, Gembloux, Belgium
2 Université Jean Lorougnon Guédé, Daloa, Côte d’Ivoire
Correspondence: Nacoulima Lalaissa Nafissatou, Laboratory of Tropical Agroecology and Horticulture, Gembloux Agro-Biotech, University of Liège, Passage des Déportés, 2-B-5030 Gembloux, Belgium. E-mail: nacoulima@gmail.com
Received: October 16, 2015 Accepted: December 22, 2015 Online Published: January 15, 2016 doi:10.5539/jas.v8n2p46 URL: http://dx.doi.org/10.5539/jas.v8n2p46
Abstract
To improve cotton fiber fineness, the (Gossypium hirsutum L. × Gossypium longicalyx Hutch. & Lee)² allohexaploid and the [(Gossypium hirsutum L. × Gossypium thurberi Tod.)² × G. longicalyx] allotetraploid were backcrossed to G. hirsutum to produce introgressed genetic stocks. The ribbon width (RW) of 600 swelled fibers produced by the hybrids, their parents, and their backcross progeny were analyzed for each compared genotype using an optical microscope. The RWs varied between 6.41±2.15 µm for G. longicalyx to 17.45±2.98 µm for the
G. hirsutum parent cultivar C2. Fibers produced by the trispecific hybrids and their progeny were finer than the
bispecific hybrid material. For the introgressed stocks, the lowest RWs were observed for the trispecific hybrid (10.79±2.14 µm) and certain backcross progenies (between 11.98±1.27 µm to 12.71±1.61 µm). The allohexaploid RW was 13.58±1.41 µm. One of its tetraploid progeny produced approximately the same value (13.94±2.48 µm). These results show that G. longicalyx is a potential genetic stock for cotton fiber fineness improvement. The genetic stocks produced are valuable materials for improve the fineness of cotton fiber. Keyswords: Gossypium, interspecific hybridization, fiber fineness, RW
1. Introduction
Cotton fiber is an important raw material for the textile industry. The world production of cotton fiber was estimated at 119.7 million bales in 2012/2013 (USDA, 2013). The cotton fiber price is determined based on the fiber quality. The quality is defined by parameters, such as length, strength, fineness, maturity, and color. These parameters are established during fiber development. Among the fiber physical properties, fineness is considered as a major trait that determines the cotton fiber quality. This character influences the spinning limit, yarn strength, yarn uniformity and productivity. The fiber fineness determines the number of fibers required to spin a yarn at a particular thickness. The finer a fiber is, the more significant the quantity of fibers in the yarn cross-section. Spinning finer fibers produces stronger and uniform yarns (May, 1999). Long et al. (2010) found that the strongest yarns were produced from genotypes with the longest and finest fibers.
Cotton fiber fineness is expressed as the perimeter, diameter or RW, cross sectional area, and standard fiber weight (Gordon & Hsieh, 2006). Most cotton breeders and geneticists estimate cotton fiber fineness in terms of linear density (tex) values, which are conventionally determined using a gravimetric fineness method or AFIS, and micronaire values are measured using HVI. More recent methods have been verified for determining fiber fineness. The methods are based on an image analysis system (Huang et al., 2002), electromagnetic scattering using a laser system (Thomasson et al., 2009), light-scattering experiments (Aslan et al., 2003; Adedoyin et al., 2011) and vibroscopic techniques (Delhom et al., 2010). An instrument was recently developed using polarized light microscopy and image analysis, wherein a cottonscope measures the fiber RW, maturity and linear density (Rodgers et al., 2010, 2012).
The cotton genus Gossypium (Malvaceae) contains 45 diploid species (2n = 2x = 26) and five tetraploid species (2n = 4x = 52) (Fryxell et al., 1992). The diploid species are differentiated into eight genome groups designated by the capital letters A, B, C, D, E, F, G and K (Stewart, 1995). The sole F genome species, G.
longicalyx, is separated from the remaining genome groups based on its distinctive geography, morphology
and ecology (Fryxell et al., 1992). All diploid Gossypium genomes contain an exclusive wild species, except for the A genome. The tetraploid species contain two distinct subgenomes related to the A and D diploid genomes (Wendel & Cronn, 2003). The tetraploid species G. hirsutum L., which is cytogenetically known as (AhDh) or (AD)1, is the main cotton cultivated throughout the world; it accounts for 95% of the world lint production. The level of genetic diversity among agriculturally elite types of G. hirsutum is low (Gingle et al., 2006a, 2006b). Diploid species are an important reservoir for alleles of interest that can be exploited to improve cotton fiber qualities (Mergeai, 2006). The results generated thus far in numerous interspecifc breeding projects in different parts of the world show cryptic, beneficial alleles in wild germplasms and that multigenic traits can be introgressed through interspecific breeding using the main cultivated cotton species, irrespective of the donor species performance. According to Demol et al. (1978), cotton fiber fineness can be improved by using the African wild diploid species G. longicalyx Hutch & Lee. To verify this hypothesis, the (Gossypium hirsutum L. x
G. longicalyx)² allohexaploid and [(G. hirsutum × G. thurberi Tod.)² × G. longicalyx] allotetraploid were created
at GemblouxAgro Bio-Tech (University of Liège). The objective of this study was to evaluate the possibility of enhanced fineness through introgression in the backcross progenies of these two interspecific hybrids.
2. Material and Methods
2.1 Plants Material
The basic plant material includes the following:
i). The parents of the (Gossypium hirsutum L. × Gossypium longicalyx)² and [(G. hirsutumx G. thurberi Tod.)² ×
G. longicalyx] interspecific hybrids are the G. hirsutum cultivar C2 (2n = 4x = 52, Ah AhDh Dh) (G 107), RNR, and the two diploid species G. longicalyx (2n = 2x = 26, FlFl) (G 17) and G. thurberi (2n = 2x = 26, D1D1) (G 27). The G numbers correspond to the classification of the accessions and hybrids in the Gembloux Agro Bio-Tech cotton gene bank (Maréchal, 1983).
ii). Selfed progenies of MAALS (Monosomic Alien Addition Lines) obtained by Koto (1983) from the bi-specific hexaploid (G. hirsutumcv. C2 × G. longicalyx)² (G 368) were created in Gembloux using the scheme illustrated in Figure 1. 10 out of 13 possible MAALs of G. longicalyx on G.hirsutum numbered from I to XIII provided by the CIRAD (France) gene bank were used in this study.
iii). The BC1 and BC2 progenies of the tri-specific hybrid HTL {(G. hirsutum × G. thurberi)² × G. longicalyx} were created and backcrossed to the G. hirsutum var RNR variety following the pseudophyletic method (Mergeai, 2006) illustrated in Figure 2.
All plant materials were grown at the same time in Gembloux Agro Bio-tech greenhouses. The seed-cotton was randomly harvested without regard to the boll position.
www.ccsennet.org/jas Doubl Doubl G. hirsutum 2(Ah 2n = 4x ling of chromoso Fertile 2(A 2n Fig Gossypium 2(A 2n = 4 ling of chromoso A 2 Figur Journal of A m L. var C2 hDh) x = 52 Sterile tr 2n = omes by colchici G. hirsutum e Pentaploid AhDh) + F1 n =5x = 65 Alien a 2(AhDh) + 2n gure 1. Schem m hirsutum L. AhDh) 4x = 52 Sterile tr 2n omes by colchici Allohexaploid 2(AhDhD1) 2n = 6x = 78 Trispecif A 2n e 2. Scheme o Agricultural Sci × G. long riploid hybrid AhDhF1 = 3x = 39 ine × Fertile 2 2n × G. hir addition lines + nF1 (0 < n < 1 n = 4x = 52 e of the aphyle × Gossy riploid hybrid AhDhD1 n = 3x = 39 ine × G. lon fic hybrid HT AhDhD1F1 n = 4x = 52 f the pseudoph ience gicalyxHutch F1F1 2n = 2x = 2 d e allohexaploi 2(AhDhF1) n = 6x = 78 rsutum L.var A 13) etic method ypium thuberi D1D1 2n = 2x = 2 d ngicalyxHutch F1F1 2n = 2x = 2 TL hyletic method h. & Lee. 26 id Allen Todaro. 26 h. & Lee. 26 d Vol. 8, No. 2; 2016
2.2 Mitotic Observation
The karyotype of MAALS progenies likely to carry a supernumerary chromosome was determined based on their phenotype using mitotic cells and the method described by D’Hont et al. (1995). Roots were collected from growing seeds germinated in Petri dishes on filter paper at 30 °C for 48 hours. First, the roots were pre-treated in 0.04% Hydroxyquinoline at room temperature for 4 hours in the dark and were fixed at metaphase in Carnoy’s I solution (glacial acetic acid 1: ethanol 3) for 48 hours. Thereafter, the roots were stored in 70% ethanol at 4 °C, the roots tips were digested in an enzyme solution (5% cellulose Onozuka R-10 and 1% pectolyase Y-23 in citrate buffer) at 37 °C for 1 hour, and they were compressed onto slides in a fresh fixative (3:1 ethanol: acetic acid). Chromosome preparations were visualized and counted under a fluorescent light microscope after staining with 4',6-diamidino-2-phenylindole (DAPI)/Vecta-shield.
2.3 Ribbon Width Measurement
RW measurements were performed on fibers produced by three seeds randomly harvested without regard to the boll position and opening date. Certain HTL progenies were quasi sterile and did not produced sufficient seeds; thus, the measurements were performed on 2 seeds. For each seed, the diameters of 200 swollen fibers were measured using the software NIS-Elements BR 2.30 and a Nikon Eclipse E800 microscope equipped with a digital Nikon camera. To perform the measurements, the fibers were straightened and paralleled through combing. The median region of the fibers was used for the observations. Each parallel fiber sample was drawn along a glass slide. The fibers were moistened and swollen in an 18% NaOH solution. The measurements were performed on one side of the slide, and the slide was moved across the field of vision to avoid repeating the measurements on any fiber based on Roehrich’s (1947) recommendations. The fiber RWs were determined by dividing the mean of the measured diameters by the 1.3 Summers coefficient (Roehrich, 1947).
2.4 Statistical Analysis
The mean and standard deviation were calculated. The kurtosis and skewness of the fiber fineness frequency distributions (Pearson, 1895, 1905) were calculated using Minitab 17 Statistical Software 2010. ANOVA was performed to compare the RW means between and within genotypes. The multiple comparisons were examined for significance at P < 0.05 using Tukey’s test, and the output was condensed into letter grouping.
3. Results and Discussion
Monosomic alien addition lines (MAALs) with only one chromosome from G. longicalyx in the genetic background of G. hirsutum and HTL trispecific hybrids containing the two wild diploid species genomes G.
longicalyx and G. thurberi in a G. hirsutum genetic background were used in this study.
Seed setting and seedlings were obtained through backcrossing and selfing the MAALs progenies as well as the HTL trispecific hybrid to G. hirsutum (Table 1). The material morphological traits are also reported in Table 1. The HTL plants presented no phenotypic segregation, and the BC1 plants exhibited segregation based on morphological characters. The leaf shape varied, and the number of lobes per leaf ranged from 1 to 5. The BC1 plant leaf size varied, but all were larger than the G. thurberi and G. longicalyx leaves and similar to G.
hirsutum.
Most of the MAALS progeny plants presented G. hirsutum morphological traits. The remaining plants (38.5%) differed morphologically from the G. hirsutum plants. The MAALS progeny karyotypes were determined. RW measurements were performed on plants with 2n = 53 and plants with 2n = 52, presenting a sign of introgression.
www.ccsenet.org/jas Journal of Agricultural Science Vol. 8, No. 2; 2016
Table 1. Seed germination and number of seedlings of plants
Line Total number
of seeds
Germinated seed(%)
Seedlings that
survived(%) Morphological traits
MAAL-I 14 71 40 Small plant, well-branched, small and dark-green leaves with 3-5 lobes, globular boll
MAAL-II 35 71 76 Glabrous plant, many small leaves with 3-5 pointed lobes, rounded three- or four-celled boll
MAAL-III 32 81 42.3 Slender stem, little branching, large leaves with 4-5 lobes, abundant anthers and pollen, few bolls produced, large amount of cottonseed per boll, ovoid capsule
MAAL-IV 22 50 63.7 Globular plant, few fruiting branches, small leaves, capsule globular and pointed
MAAL-V 29 79 82.6 Small plant, small leaves, slow growing, round boll MAAL-VII 10 75 50 Light green leaves with 3-5 lobes, few fruiting branches,
few bolls produced
MAAL-VIII 19 58 18.2 Small bushy plant, many vegetative branches, light green leaves with 3 lobes, small round boll with 3-4 lobes MAAL-IX 30 70 38 Slow-growing plant, large leaves with 5-7 lobes, low
pollen production, short fruiting branches
MAAL-XI 25 56 14.3 Dark green leaves with 3-5 lobes, many vegetative branches, few small bolls, large number of cottonseeds MAAL-XII 13 77 70 Slender stem, small leaves with 3 lobes, few fruiting
branches, large number of small globular bolls
HTL 10 90 100 Small plant, well-branched, small and dark-green leaves with 3-5 lobes, globular boll
BC1 27 48 92 Glabrous plant, many small leaves with 3-5 pointed lobes, rounded three- or four-celled boll
We examined the normalities of the fiber RW distributions for all genotypes, and skewness and kurtosis were used to characterize the symmetry and peakedness of the fiber RW distributions. The skewness coefficient measures the degree of symmetry in the variable distribution. A positive or negative skewness, respectively, indicates a long asymmetric right tail and a long asymmetric left tail (Doane & Seward, 2011; Hall, 2014). A skewness value of zero indicates normal distribution, whereas a skewness value greater than 1 indicates that the distribution differs significantly from a normal distribution.
Genotypes that present a negative skewness exhibit a distribution with more coarse fibers, while genotypes with a positive skewness exhibit more fine fibers.
Kurtosis measures the degree to which a distribution is more or less peaked compared with a normal distribution. A high kurtosis value indicates a relatively peaked distribution with a long tail, and a low kurtosis signifies a relatively flat distribution with thinner tails (Zenga, 2014). A high kurtosis indicates a narrow fineness range for the fibers.
The parental species G. hirsutum var. C2 and G. longicalyx exhibited positive skewness and opposite kurtosis. (Table 2). The G. hirsutum var C2 presented a negative skewness with larger fibers than the wild parental species
G. longicalyx.
MAAL-V # 1, MAAL-V # 1, MAAL-V # 1 and MAAL-XII # 4 exhibit skewness values near 0 (-0.08 and -0.06), corresponds to a normal distribution. Among the genotypes presenting a reduced RW, MAAL-Fl-II-8 and MAAL-III # 2 showed positively skewed distributions, which indicates more fine fibers than coarser fibers, while MAAL-XII # 6 and MAAL-Fl-IV-3 exhibited negatively skewed distributions with many coarse fibers. The Skewness and the kurtosis valus are both negative for MAAL-XI # 1. This MAAL may shown a wide range of coarse fibers.
Table 2. Skewness and Kurtosis values of MAALs and their parental species
Genotype Skewness Kurtosis
G. longicalyx 0.67 0.58 (G. hirsutum × G. longicalyx)² 0.10 -0.35 MAAL-I # 6 -0.13 -0.1 MAAL-I # 10 0.23 -0.19 MAAL-II # 8 0.20 0.09 MAAL-III # 2 0.13 0.01 MAAL-IV # 3 -0.41 -0.25 MAAL-V # 1 -0.08 -0.25 MAAL-VII # 3 0.65 0.74 MAAL-VIII # 10 0.40 0.83 MAAL-IX # 2 -0.44 0.21 MAAL-XI # 1 -0.14 -0.64 MAAL-XII # 4 -0.06 0.16 MAAL-XII # 6 -0.39 0.47
The genotypes MAAL-XII-6, MAAL-III # 2 and MAAL-IX # 2 exhibit approximately the same mean (13.97±1.65 µm, 13.94±2.48 µm and 13.85±2.79 µm) but different skewness (0.13, -0.39, and -0.44) and kurtosis values (0.01, 0.47, and 0.21).
The RW distributions for these cotton samples are shown in Figure 3 wherein the x-axis represents the fiber RW, and the y-axis represents the fiber frequencies. Despite exhibiting the same mean, the three genotypes presented different distributions. We presume that MAAL III # 2 contains more fine fibers than the remaining genotypes, which indicates that the mean cannot be used to differentiate the cotton fineness levels.
Figure 3. RW distribution of some MAALs
Statistical parameters such as skewness and kurtosis, are necessary to further characterize the RW of different cottons presenting the same mean. A fiber RW distribution that is symmetrical (skewness = 0) around the mean and as peaked (kurtosis > 0) as possible is necessary.
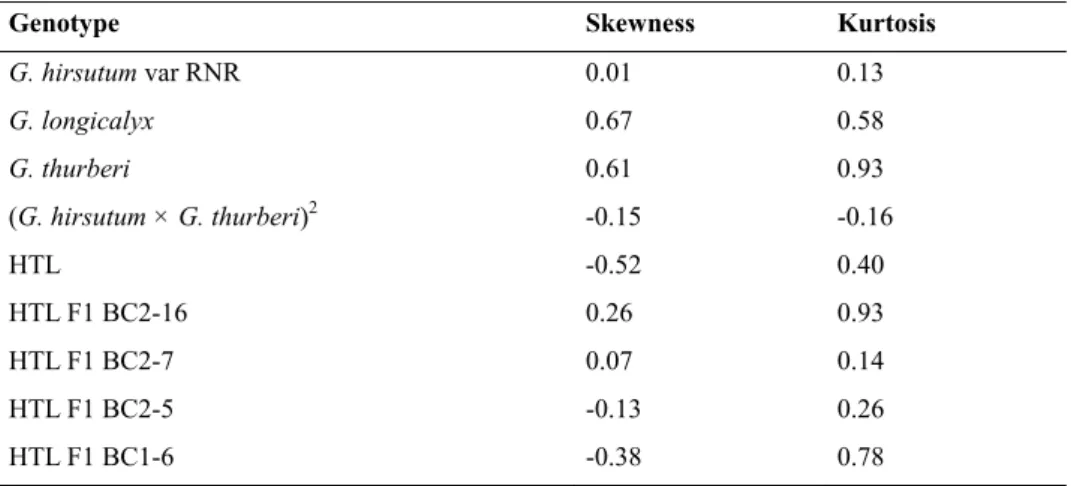
G. hirsutum var. RNR, G. thurberi and BC2-7 presented a leptokurtic distribution are positively skewed (< 1)
and leptokurtic, which indicates a narrow range of distribution of fiber RWs less than the mean (Table 3). The hexaploid (G. thurberi × G. longicalyx) had a negative kurtosis (-0.16) a wide fineness range of fibers.
The HTL and the genotypes BC2-5 and BC1-6 exhibit a negative skewness and positive kurtosis value, which
0 50 100 150 200 250 300 350 400 450 500 0 5 10 15 20 25 30 35 Frequency RW (µm) MAAL III#2 MAAL IX#2 MAAL XII# 6
www.ccsenet.org/jas Journal of Agricultural Science Vol. 8, No. 2; 2016
indicates a narrow range of fiber RWs with more coarse fibers than the mean. Table 3. Skewness and Kurosis value of HTL plants and their parental species
Genotype Skewness Kurtosis
G. hirsutum var RNR 0.01 0.13 G. longicalyx 0.67 0.58 G. thurberi 0.61 0.93 (G. hirsutum × G. thurberi)2 -0.15 -0.16 HTL -0.52 0.40 HTL F1 BC2-16 0.26 0.93 HTL F1 BC2-7 0.07 0.14 HTL F1 BC2-5 -0.13 0.26 HTL F1 BC1-6 -0.38 0.78
The mean RWs of the fibers were similar for the three seeds of G. hirsutum var C2 and HTL F1 BC2-16 plants (Tables 2 and 3).
Bradow et al. (1997) observed significant variations in Pee Dee cotton (G. hirsutum L.) fiber diameters, cross-sections, and circularities at the boll and locule levels measured on 2500 fibers with the AFIS lengths and diameter modules (Zellweger-Uster, Knoxville, TN). In this study, the overall average Pee Dee 3 fiber diameter was 12.7±0.9 µm. Studying the influence of seed location on fiber quality, Davidonis and Hinojosa (1994) found that fiber perimeters of apical seeds were thinner in the micropylar region than the chalazal regions, and, conversely, the fiber perimeter of basal seeds were larger in the micropylar region than the chalazal regions. These authors hypothesized that each fiber cell receives a certain allotment of assimilates for development.
G. hirsutum var. C2 presented an average fiber RW of 17.45±2.98 µm, and G. longicalyx exhibited the finest fiber
with an average RW of 6.41±1.39 µm (Table 4). The hexaploid (G. hirsutum L. × G. longicalyx)² exhibited a RW of 13.58±1.41 µm. The MAAL-III # 2 (2n = 53 chromosomes) and the following euploids (2n = 52 chromosomes) MAAL-II # 8, MAAL-II # 8, MAAL-IX # 2 and MAAL-XII # 6 exhibited means similar to the hexaploid with, respectively 14.07±2.53 µm, 13.85±2.79 µm and 13.94±2.48 µm. The MAAL-XI # 1 exhibited the largest RW (18.09±3.56 µm).
According to Tukey’s test, MAAL-III # 2 (2n = 53) and three introgressed stocks (2n = 52) produced through the bi-specific introgression method did not exhibit significantly different fiber RWs compared to the hexaploid (G.
Table 4. Average RW (µm) of the fibers of the MAALs and their parental species Genotype Chr Nb Genomic formula RW±standard deviation F value RW±SD for 600 fibers Tukey Grouping 200 fibers Seed 1 200 fibers Seed 2 200 fibers Seed 3
G. hirsutum var C2 52 2(AD)1 17.59a±3.45 17.59a±2.41 17.17a±2.98 1.40 17.45±2.98 B
G. longicalyx 26 2F1 6.00a±1.29 6.37b±2.20 6.84b±1.46 20.03* 6.41±1.39 H
(G. hirsutum ×
G. longicalyx)²
78 2(AhDhF1) 13.41a±1.27 13.29b±1.15 14.03b±1.66 15.22* 13.58±1.41 G †
MAAL-I # 6 52 2(AD)1+1 15.74a±1.40 15.39ab±1.51 15.92b±1.63 6.07* 15.69±1.53 D
MAAL-I # 10 53 2(AD)1+1 15.31a±2.26 14.4ab±1.79 14.85b±2.07 8.64* 14.86±2.08 F
MAAL-II # 8 52 2(AD)1 14.69a±1.74 13.80b±2.90 13.73b±2.69 10.79* 14.07±2.53 G†
MAAL III # 2 53 2(AD)1+1 14.07a±1.65 14.52b±1.49 13.31c±1.59 30.32* 13.97±1.65 G†
MAAL-IV # 3 53 2(AD)1+1 15.91a±3.02 17.79b±2.50 16.93c±2.90 22.49* 16.89±2.91 C
MAAL-V # 1 53 2(AD)1+1 15.93a±2.75 16.01a±3.38 14.91b±3.39 7.83* 15.62±3.22 DE
MAAL-VII # 3 53 2(AD)1+1 14.83a±1.51 15.31a±2.78 16.49a±2.68 1.86* 15.54±2.38 EF
MAAL-VIII # 10 53 2(AD)1+1 15.67a±1.81 15.78b±2.99 16.86b±2.41 14.62* 16.10±2.51 D
MAAL-IX # 2 52 2(AD)1 13.46a±2.86 14.13ab±3.06 13.97b±2.39 2.94* 13.85±2.79 G†
MAAL-XI # 1 53 2(AD)1+1 17.56a±3.88 18.14ab±3.44 18.31b±3.32 3.89* 18.09±3.56 A
MAAL-XII # 4 53 2(AD)1+1 14.84a±3.46 15.11a±3.42 15.56a±3.08 2.74* 15.17±3.33 EF
MAAL-XII # 6 52 2(AD)1 13.96a±2.21 13.53ab±2.54 14.35b±2.62 4.94* 13.94±2.48 G†
Note. * Significant at the 0.05 probability level; † Means followed by the same letter are not significantly different from each other; Chr Nb: Chromosome number; SD: Standard deviation.
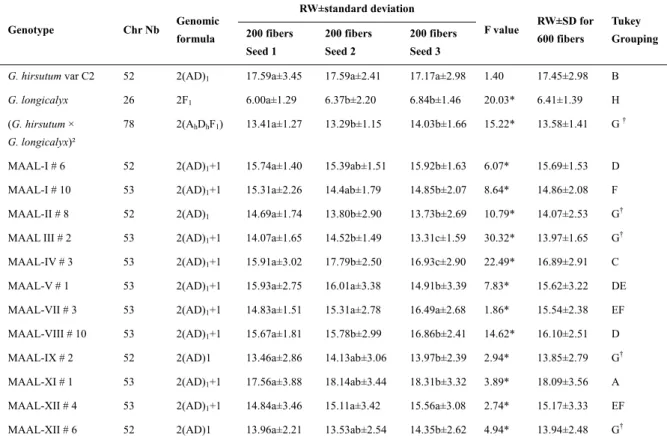
The tri-specific hybrid parents G. hirsutum (cv. 11240-RNR) and G. thurberi exhibited the RW 19.75±3.55 µm and 9.09±1.82 µm (Table 3), respectively.
The G. hirsutum variety RWs ranged from 15.1 to 17.5 µm, consistent with other studies, which indicate that Upland cotton fiber RWs vary between 17 to 20 µm (Roehrich et al., 1947) and 12 to 25 µm (Mishra, 2000). The (G. hirsutum L. × G. thurberi Tod.)² allohexaploid presented a RW of 14.78±1.67 µm, which is consistent with Demol et al. (1978), who estimated that the fiber RW of the hexaploid (G. hirsutum cv. C2 × G. thurberi)² is 15.20 µm. These authors also reported RWs for allohexaploids involving G. hirsutum cv. C2 and certain wild diploid species. The mean RWs of hexaploids involving G. anomalum (B1), G. sturtianum (C1), G. harknessi (D4), G. raimondii (D3), and G. areysianum (E) genomes were 20.30 µm, 22.30 µm, 20.90 µm, 19.00 µm and 22.80 µm, respectively.
The HTL and HTL F1 BC2-5 RWs were, respectively, 10.79±2.14 and 12.71±1.61 µm. These values were lower than the average hexaploid RW; these genotypes carry several G. longicalyx and G. thurberi chromosomes in a
G. hirsutum background. Tukey’s test showed a significant difference between the progenies of [(G. hirsutum × G. thurberi.)² × G. longicalyx] hybrids and their parental species.
www.ccsenet.org/jas Journal of Agricultural Science Vol. 8, No. 2; 2016
Table 5. Average RW (µm) of the fibers of the HTL progenies and parental species
Genotype Chr Nb Genomic formula RW±standard deviation F value RW±SD for 600 fibers Tukey Grouping 200 fibers Seed 1 200 fibers Seed 2 200 fibers Seed 3 G. hirsutum var C2
52 2(AD)1 17.59a±3.45 17.59a±2.41 17.17a±2.98 1.40 17.45±2.98 B
G. hirsutum var RNR 52 2(AD)1 17.95a±9.43 20.41a±3.62 20.88b±2.79 72.77* 19.55±3.55 A
G. longicalyx 26 2F1 6.00a±1.29 6.37b±2.20 6.84b±1.46 20.03* 6.41±1.39 H
G. thurberi 26 2(AD)1 8.81a ± 1.83 9.34ab±1.90 9.13b ± 1.71 4.38* 9.09±1.82 G
(G. hirsutum ×
G. thurberi)2
78 2(AhDhD1) 14.94a±1.70 14.86ab±1.68 14.55b±1. 66 3.96* 14.78±1.67 C
HTL 52 AhDhD1F1 12.52a±1.22 9.06b±1.31 651.51*kjm 10.79±2.14 F
HTL F1 BC2 - 16 52 AhDhD1F1 17.67a±1.64 17.28ab±2.16 17.03b±2.12 5.02* 17.32±1.94 B
HTL F1 BC2 - 7 52 AhDhD1F1 11.84a±1.42 12.12b±1.12 - 5.39* 11.98±1.27 E†
HTL F1 BC2 - 5 52 AhDhD1F1 12.68a±1.32 12.75a±1.86 - 0.026 12.71±1.61 D†
HTL F1 BC1 - 6 52 2(AD)1 12.83a±1.24 11.83b±1.09 12.33c±1.19 35.20* 12.33±1.24 DE† Note. *Significant at the 0.05 probability level; † Means with the same letter are not significantly different from each other; Chr Nb: Chromosome number; SD: Standard deviation.
The coefficients of variation ranged from 9.26 to 21.44%; this value ranged between 21.04 and 21.44% for the wild species G. longicalyx and was lower at 12% for the hexaploid MAAL-Fl-I-6, MAAL-III # 2, and HTL F1-BC1. The high variation observed in this study is first due to the large variation within the cotton seed. A source of error with a lower effect may the microscope measurement, but the reliability of the fiber RW measurements greatly increased through mercerization of the fibers before the measurements.
Huang et al. (2002) performed longitudinal measurements of 25 cotton fiber samples from one bale; they analyzed 1.000 to 4.000 fibers for each sample using an imaging analysis method, and the coefficient of variation for the mean fiber width from one cotton bale was 2.91%.
Adedoyin et al. (2011) reported that the coefficient of variation from laser diffraction system measurements on 20 fibers from one bale of cotton was 9.35%.
Few studies have focused on cotton fiber quality measurements at the seed level because modern instruments require a large sample size, and non-instrumental measurement methods are tedious and time consuming. As a result, the full differences in fiber quality within a single plant and seed have not been estimated. The cotton scope was recently developed and only requires 50 mg of lint per replication, which would be useful for fiber fineness characterization at the seed level.
Baezinger et al. (2007) reported that to enhance the probability of genetic improvement for a specific trait of interest, the trait must be satisfactorily measured and heritable, and sufficient genetic variability must exist to ultimately realize long-term genetic improvement for the trait through plant breeding. Cotton fineness measured as perimeter, linear density or micronaire is moderately to highly heritable (May, 1999). Enhanced fineness is particularly important because selecting a smaller perimeter could facilitate selection of a low-micronaire, longer, and stronger fiber (Kloth, 1998).
According to Long and Bange (2012), RW provides the best average indication of fiber fineness or coarseness regardless of how the external fiber architecture is influenced by other components, such as convolutions, level of fullness affected by fiber maturity, and fiber perimeter. RW is an attribute that relates to how fibers will best pack together in yarn. RW is more related to yarn strength than either micronaire or gravimetrically determined linear density; that is, fibers with smaller RWs spin stronger yarns (Bange et al., 2010). These authors found that less mature cotton from a cooler growing season produced stronger yarns and fabric partly due to the fiber’s smaller RW, which had a greater effect on fiber packing density and inter-fiber friction. RW measurements through microscope analysis remains a reliable and accurate means for highlighting the broad differences observed in the analyzed material.
Although a genetic basis for the fiber fineness is unknown, many studies have localized the QTL associated with this trait to 1 to 8 different chromosomes (Nacoulima & Mergeai, 2014), which indicates that the cotton fiber fineness is a trait controlled by several genes. The tri-specific introgression pathway is more suitable for introgression of genes located on several chromosomes (Mergeai et al., 1997). Under this approach, all of the chromosomes for the wild diploid species encountered the G. hirsutum chromosomes. The recombination frequency for homoeologous chromosomes between the donor species and the sub-genomes Ah and Dh is typically higher for trispecific hybrids than bispecific hybrids (Mergeai, 2006).
However, exploiting trispecific hybrids is difficult because this genetic material is highly unbalanced with low fertility. Linkages among desirable and undesirable traits by the donor and bridge species also complicate successful use of this genetic material. Several backcrossing and selection schemes are necessary to produce fertile offspring and eliminate uninteresting traits as well as fix the selected agronomic traits.
Within the (G. hirsutum × G. longicalyx)² allohexaploid progeny, three introgressed stocks (2n = 52) present enhanced fineness, which suggests that multiple introgressions likely occurred in these plants; thus, they are valuable material for fineness introgression into Upland cotton.
The introgressed stocks with enhanced fiber fineness are from three different MAALs. Presumably; one or several QTLs from the G. longicalyx chromosomes that influence fineness were integrated into the G. hirsutum background. Another hypothesis is that the different MAALs carry the same alien chromosome, which was preferentially transmitted to the pentaploid progenies. This phenomenon was observed in various studies (Ahoton et al., 2004; Benbouza et al., 2008; Sarr et al., 2012).
Recombination may also have occurred at the hexaploid level. G. longicalyx loci from different linkage groups were detected on different MAALs (data not shown), which highlights the importance of using molecular markers to monitor chromosome fragment introgression.
References
Adedoyin, A., Li, C., & Toews, M. D. (2011). Characterization of single cotton fibers using a laser diffraction system. Textile Research Journal, 81, 355-367. http://dx.doi.org/10.1177/0040517510387210
Ahoton, L., J.M. Lacape, A. Dhont, J.P. Baudoin, G. Mergeai. (2004). Isolation and characterisation of seven alien monosomic addition lines of Gossypium australe F. Muell. on G. hirsutum L. In A. Swanepoel (Ed.),
Proceedings of World Cotton Research Conference-3, Cotton production for the new Millenium (pp.
136-142). ICAC, Cape Town (South Africa), March 9-13, 2003, Pretoria, South Africa.
Bange, M. P., Constable, G. A., Johnston, D. B., & Kelly, D. (2010). A method to estimate the effects of temperature on cotton micronaire. Journal of Cotton Science, 3, 164-172.
Benbouza, H., Diouf, F. B. H., Ndir, K., Baudoin, J. P., & Mergeai, G. (2008). Preferential transmission of
Gossypium sturtianum chromosome fragments in the progeny of [(G. hirsutum × G. raimondii)2 × G. sturtianum] trispecific hybrid. The world Cotton Research Conference.
Bradow, J. M., Wartelle, L. H., Bauer, P. J., & Sassenrath-Cole, G. F. (1997). Small-Sample Cotton Fiber Quality Quantitation. The Journal of Cotton Science, 1, 48-60.
D’Hont, A., Rao, P. S., Feldmann, P., & Grivet, L. (1995). Identification and characterization of sugarcane intergeneric hybrids, Saccharum officinarum × Erianthus arundinaceus, with molecular markers and DNA
in situ hybridization. Theor. Appl. Genet., 91, 320-326. http://dx.doi.org/10.1007/BF00220894
Davidonis, G., & Hinojosa, O. (1994). Influence of seed location on cotton fiber development in planta and in
vitro. Plant Science, 203, 107-113. http://dx.doi.org/10.1016/0168-9452(94)03967-4
Delhom, C. D., Cui, X., & Thibodeaux, D. P. (2010). Single fiber testing via FAVIMAT. Beltwide Cotton Conferences. New Orleans.
Demol, J., Verschraege, L., & Maréchal, R. (1978). Utilisation des espèces sauvages en amélioration cotonnière. Observations sur les caractéristiques technologiques des nouvelles formes allohexaploïdes. Coton Fibres
Tro., 33, 327-333.
Doane, D. P., & Seward, L. E. (2011). Measuring Skewness: A Forgotten Statistic? Journal of Statistics
Education, 19(2).
Fryxell, P. A. (1992). A revised taxonomic interpretation of Gossypium L. (Malvaceae). Rheedea, 2, 108-165. Gingle, A. R., Yang, H., Chee, P. W., May, O. L., Rong, J., Bowman, D. T., … Hsieh, Y. L. (2006a). Cotton:
www.ccsenet.org/jas Journal of Agricultural Science Vol. 8, No. 2; 2016
Gingle, A. R., Yang, H., Chee, P. W., May, O. L., Rong, J., Bowman, D. T., … Paterson, A. H. (2006b). An integrated Web resource for cotton. Crop Sci., 46, 1998-2007. http://dx.doi.org/10.2135/cropsci2005.09.0328
Hall, P (2014). Wiley Stats Ref: Statistics Reference Online. John Wiley & Sons, Ltd. http://dx.doi.org/10.1002/9781118445112
Huang, Y., & Xu, B. (2002). Image analysis for cotton fibers Part I: Longitudinal measurements. Textile Res J.,
72, 713-720. http://dx.doi.org/10.1177/004051750207200811
Kloth, R. H. (1998). Cotton Improvement. Analysis of commonality for traits of cotton fiber. J. Cot. Sci., 2, 17-22.
Long, L. R., & Bange, M. P. (2012). Consequences of immature fiber on the processing performance of Upland cotton. Field Crops Research, 121(3), 401-407. http://dx.doi.org/10.1016/j.fcr.2011.01.008
Long, R. L., Bange, M. P., Gordon, S. G., Van der Sluijs, M. H. J., Naylor, G. R. S., & Constable, G. A. (2010). Fiber quality and textile performance of some Australian cotton genotypes. Crop Science, 50, 1509-1518. http://dx.doi.org/10.2135/cropsci2009.10.0600
Maréchal, R. (1983). A collection of interspecific hybrids of genus Gossypium. Coton Fibres Trop., 38, 240-246. May, O. L. (1999). Genetic variation for fiber quality. In A. S. Basra (Ed.), Cotton Fibers—Developmental
Biology, Quality Improvement, and Textile Processing. Food Products Press Imprint of Haworth Press, New
York, NY.
Mergeai, G., Baudoin, J. P., & Bi, I. V. (1997). Exploitation of trispecific hybrids to introgress the glandless seed and glanded plant trait of Gossypium sturtianum Willis into G. hirsutum L. Biotechnologie, Agronomie,
Société et Environnement, 1, 272-277.
Mergeai, G. (2006). Introgressions interspécifiques chez le cotonnier. Cah. Agric., 15, 135-143.
Minitab 17 Statistical Software. (2010). [Computer software]. State College, PA: Minitab, Inc. Retrieved from http://www.minitab.com
Mishra, S. P. (2000). A Text Book of Fibre Science and Technology. New Delhi, India: New Age International (P) Ltd.
Nacoulima, N. L., & Mergeai, G. (2014). Study of the possibilities to improve the fineness of the fiber in cotton.
Biotechnol. Agron. Soc. Environ., 18(4), 566-576.
Pearson, K. (1895). Memoir on skew variation in homogeneous material. Phil. Trans. Roy. Soc. A, 186, 343-414. http://dx.doi.org/10.1098/rsta.1895.0010
Pearson, K. (1905). Das fehlergesetz und seine verallgemeinerungen durch fechner und Pearson: A rejoinder.
Biometrika, 4, 169-212. http://dx.doi.org/10.2307/2331536
Rodgers, J. E., Delhom, C., Fortier, C., & Thibodeaux, D. (2012). A rapid measurement for cotton breeders of maturity and fineness from developing and mature fibers. Text. Res. J., 82(3). http://dx.doi.org/10.1177/0040517511431317
Roehrich, O. (1947). Méthode générale d’étude des caractères technologiques des fibres textiles végétales (2 ème partie). Coton Fibres Tro., 2(3).
Sarr, D., Lacape, J. M., Jacquemin, J. M., Benbouza, H., Toussaint, A., Baudoin, J. P., & Mergeai, G. (2012). Alien chromosome transmission and somatic elimination in monosomic addition lines of Gossypium
australe F. Muell in G. hirsutum L. Euphytica, 18, 55-64. http://dx.doi.org/10.1007/s10681-011-0479-x
USDA. (2013). USDA estimates world cotton production for 2012/13 will be down 4 percent. Southeast Farm Press.
Zenga, M. (2014). Wiley Stats Ref: Statistics Reference Online. John Wiley & Sons, Ltd. http://dx.doi.org/10.1002/9781118445112
Copyrights
Copyright for this article is retained by the author(s), with first publication rights granted to the journal.
This is an open-access article distributed under the terms and conditions of the Creative Commons Attribution license (http://creativecommons.org/licenses/by/3.0/).