Rareté et changements globaux : Tolérance aux changements
globaux et capacité pour la plasticité transgénérationnelle chez
une espèce rare et une espèce commune de polychètes marins
« Mémoire » présenté dans le cadre du programme de maîtrise en gestion de la faune et de ses habitats (profil recherche)
en vue de l’obtention du grade de « maître ès science (M. Sc.) »
PAR
© CYNTHIA, THIBAULT
Composition du jury :
Richard Cloutier, président du jury, UQAR Piero Calosi, directeur de recherche, UQAR France Dufresne, examinateur externe, UQAR
UNIVERSITÉ DU QUÉBEC À RIMOUSKI Service de la bibliothèque
Avertissement
La diffusion de ce mémoire ou de cette thèse se fait dans le respect des droits de son auteur, qui a signé le formulaire « Autorisation de reproduire et de diffuser un rapport, un mémoire ou une thèse ». En signant ce formulaire, l’auteur concède à l’Université du Québec à Rimouski une licence non exclusive d’utilisation et de publication de la totalité ou d’une partie importante de son travail de recherche pour des fins pédagogiques et non commerciales. Plus précisément, l’auteur autorise l’Université du Québec à Rimouski à reproduire, diffuser, prêter, distribuer ou vendre des copies de son travail de recherche à des fins non commerciales sur quelque support que ce soit, y compris l’Internet. Cette licence et cette autorisation n’entraînent pas une renonciation de la part de l’auteur à ses droits moraux ni à ses droits de propriété intellectuelle. Sauf entente contraire, l’auteur conserve la liberté de diffuser et de commercialiser ou non ce travail dont il possède un exemplaire.
REMERCIEMENTS
Je tiens particulièrement à remercier Dr. Piero Calosi, directeur de recherche, sans qui ce projet de recherche n'aurait pu être possible, ainsi que Dr. Gloria Massamba N'Siala et Dr. Fanny Noisette, qui ont été d'une aide précieuse tout au long du projet, que ce soit pour les manipulations au laboratoire ou l'analyse des données. J'aimerais aussi souligner la contribution de Fanny Vermandele, étudiante à la maîtrise, et Mathieu Babin, chimiste à l’Institut des Sciences de la Mer à Rimouski (ISMER), dans le développement des analyses métabolomiques. Finalement, je tiens à remercier Sarah Jacques, étudiante au baccalauréat, qui a contribué aux analyses chimiques du système des carbonates avec l’aide de Steeven Ouellet, technicien de laboratoire à l’UQAR.
Nous remercions le financement du FRQNT (P.C), du CRSNG (P.C.), ainsi que de l’UQAR, de Québec Océan, du CSBQ et de BORÉAS)
Je remercie tous mes collègues de laboratoire, mentionnés précédemment, ainsi que Marie-Hélène Carignan (étudiante à la maîtrise), Christine Isabelle (étudiante au baccalauréat), Mathilde Chemel (étudiante à la maîtrise) et Kayla Menu Courey (étudiante à la maîtrise) pour leur soutien technique et morale à toutes les étapes du projet, ainsi que pour leurs nombreux commentaires lors des présentations qui m'ont permis de persévérer tout au long de mon cheminement. Merci également d'être non seulement des collègues de travail fantastiques, mais aussi mes amis, et d'avoir fait de mon passage à la maîtrise une expérience que je n'oublierais jamais. Il m’a été un honneur de travailler dans le laboratoire d’écophysiologie évolutive marine pour deux belles années et de côtoyer tous ces gens merveilleux et passionnés.
Je remercie également les membres de mon jury, Dr. Richard Cloutier et Dr. France Dufresne, pour leurs commentaires constructifs et l’intérêt qu’ils portent à mon projet.
ix
Finalement, merci à ma famille pour m'avoir soutenu lors de ce parcours, qui n'a pas toujours été facile, et pour m'avoir fourni la motivation nécessaire pour me rendre jusqu'au bout de cette aventure.
RÉSUMÉ
Les émissions de dioxyde de carbone d'origine anthropique ont augmenté considérablement, depuis la période d'industrialisation, et ne cesseront d’augmenter d’ici la fin du siècle. Les métazoaires marins continueront non seulement de faire face à une augmentation de la température des eaux de surface dû à ces émissions, mais aussi à l'acidification des océans. Ces changements dans leur environnement auront des impacts sur leur histoire de vie et leur traits physiologiques. Les espèces auront-elles la capacité de s'acclimater dans ces environnements changeants et pourront-elles s’adapter à long terme. La plasticité phénotypique est le mécanisme permettant l'acclimatation des organismes et varie selon leur distribution géographique et leur niche fondamentale. Une meilleure compréhension des réponses des individus face aux changements globaux, en fonction de leur distribution géographique, est donc essentielle pour la conservation de la biodiversité marine. Les objectifs de ma maîtrise sont de déterminer si les espèces rares et communes répondent différemment aux changements globaux et de déterminer si leur tolérance et leur plasticité transgénérationnelle les rend plus vulnérables aux changements anticipés. Pour répondre à ces objectifs, j’ai soumis deux espèces de polychète du genre Ophryotrocha, une espèce rare (O. robusta) et une espèce commune (O. japonica), à une condition contrôle (C) et trois scénarios imitant les conditions climatiques prédites à la fin du siècle pendant deux générations. Les trois scénarios climatiques futures sont les suivantes : acidification des océans (AO), réchauffement des océans (RO) et une condition combinant ces deux dernières (RAO). Des traits d'histoire de vie (croissance, fécondité et volume des œufs) ont été mesurés sur une période de quatre mois. Par la suite, des analyses métabolomiques ont été réalisées afin de mettre en évidence les patrons métaboliques (c.-à-d. métabolisme énergétique) associées aux changements de traits observés chez les individus. Les individus de l’espèce rare ont atteint un taux de mortalité de 100 % après 49 jours dans les scénarios RO et RAO, et ne se sont pas reproduit. Ceci est congruent avec les résultats métabolomiques, qui démontrent une plus grande dépense énergétique sous ces conditions. La fécondité des deux
xi
espèces a été réduite sous AO (33 % chez l’espèce rare et 75 % chez l’espèce commune), pour ensuite être rétablie à des valeurs contrôle en F2, voir supérieure dans le cas de l’espèce rare. L’espèce commune ne semble pas être affectée par les conditions de changements globaux, à l’exception d’une réduction du volume des œufs en F2 lorsqu’exposé au RO. L’espèce rare aurait donc une fenêtre de tolérance beaucoup plus restreinte que l’espèce commune et ne serait pas en mesure de supporter les conditions climatiques anticipées à la fin du siècle. Ces résultats ont une portée importante sur la conservation de la biodiversité marine, considérant que les espèces rares sont les plus nombreuses dans le règne animal et jouent un rôle clé dans le fonctionnement des écosystèmes.
Mots clés: plasticité phénotypique, plasticité transgénérationnelle, fenêtre de tolérance,
ABSTRACT
Emissions of carbon dioxide from anthropogenic sources have reached unprecedented levels. As a consequence, marine metazoans will have to deal with higher sea surface temperature and ocean acidification over the next century. These changes will affect the life history and physiology of organisms, challenging marine specie’s ability to acclimate to a rapidly changing environment. Phenotypic plasticity is the first mechanism allowing individuals acclimation and has been linked to specie’s distribution and fundamental niche’s size. In context of marine biodiversity conservation, it is important more then ever to understand individual’s responses to global changes according to their distribution. The objective of my master thesis was to determine if rare and common species respond differently to global changes in a marine environment, and if their tolerance and capacity for transgenerational plasticity are different. To answer these questions, two species of the polychaete Ophryotrocha, one rare (O. robusta) and one common (O. japonica), were exposed to one control condition (C) and three climate change scenarios predicted for the year 2 100 for two generations. These scenarios were: ocean acidification (OA), ocean warming (OW) and a combined scenario (OAW). Life history traits (growth, fecundity and eggs volume) were measured over a period of four months. Metabolomic analyses were also conducted to highlight molecular pattern (energetic metabolism) linked to changes observed in individual’s traits. Results show that individuals of the rare species reached 100 % mortality within 49 days of exposure in both OW and OAW scenarios, before having the chance to reproduce. The metabolomics fingerprints also showed higher energy expenses in this species under high temperature condition. Under OA, reproductive success of both species was first affected with reductions of 33 to 75 % in the rare and common species respectively, and then recovered back to control condition in F2, even higher level in the rare species. On the other hand, the common species was little affected by the experimental conditions, with an egg volume reduction in F2 when exposed to OW. Thus, the rare species
xiii
has a narrower tolerance window as compared to the common species, and will not likely be able to cope with future climatic conditions. These results are an important for marine biodiversity conservation, considering that rare species are common in the animal kingdom and have key roles in ecosystem functions.
Key words: Phenotypic plasticity, transgenerational plasticity, tolerance window,
TABLE DES MATIÈRES
REMERCIEMENTS ... viii
ABSTRACT ... xii
TABLE DES MATIÈRES ... xiv
LISTE DES TABLEAUX ... xvi
LISTE DES FIGURES ... xvii
INTRODUCTION GÉNÉRALE ... 1
CHAPITRE 1 ... 7
1.1 RESUME ... 7
1.2 ABSTRACT ... 11
1.3 INTRODUCTION ... 13
1.4 MATERIAL AND METHODS ... 17
Description of the studied species ... 17
Experimental preparation and design ... 17
Experimental system ... 19
Determination of life-history traits ... 20
Determination of metabolomic fingerprinting ... 23
Statistical analysis ... 25 1.5 RESULTS ... 27 1.6 DISCUSSION ... 31 1.7 CONCLUSION ... 35 1.8 ACKNOWLEDGMENT ... 37 DISCUSSION GÉNÉRALE ... 55
xv
Conclusion ... 61
ANNEXES ... 63
Supplementary material ... 73
1.9 SEAWATER PARAMETERS ... 73
1.10 DISSOLVE INORGANIC CARBONE ANALYSIS PROCEDURE (DIC) ... 73
LISTE DES TABLEAUX
Tableau 1 : Mean ± SE of the seawater physic-chemical parameters measured
[salinity, temperature, pHNBS, Dissolve Inorganic Carbon (DIC)] and calculated [CO2
partial pressure (pCO2), Total Alkalinity (TA), carbonate and bicarbonate ions
concentrations (HCO3- and CO32-), calcite and aragonite saturation (Ωcal and Ωara)] for
each scenario. Capital letters represent significant differences between treatments. ... 22
Tableau 2 : Life history traits of Ophryotrocha japonica and O. robusta, exposed to
ocean warming and acidification in isolation and combination. Total number of breeding pairs, % female produced viable offspring, % female survival till 49 days of exposure, growth rate, fecundity and eggs volume are provided averaged by species, scenario and generation. Mean values (± SE). ... 39
Tableau 3 : Normalized values (% difference with Control scenario) of life history
traits of O. japonica and O. robusta, exposed to ocean warming and acidification in isolation and combination. Total number of breeding pairs, % female survival till 49 d of exposure, growth rate, fecundity and eggs volume are provided averaged by species, scenario and generation. Mean values (± SE). ... 40
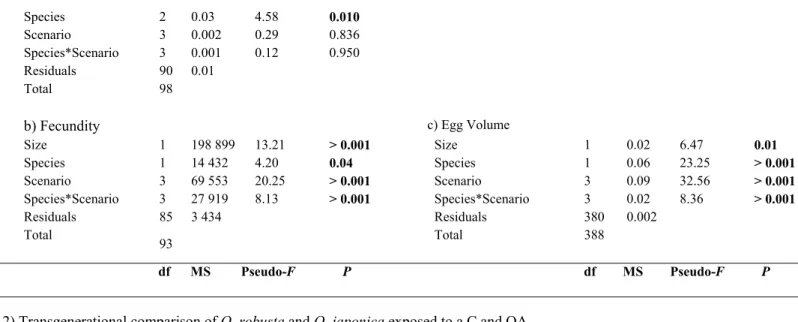
Tableau 4 : Effects of the within- (F1) and transgenerational (F1-F2) exposure to
ocean acidification (OA), ocean warming (OW) and their combination (OAW), on O. robusta and O. japonica life history traits (raw data). Degrees of freedom (df), mean of square (MS), F-ratio (Pseudo-F) and probability level (p) are provided. Bold number means significant P. ... 41
Tableau 5 : χ2 results for the within- (F1) and transgenerational (F1-F2) responses of
O. robusta and O. japonica (degeneration events and female percentage produced viable offsprings) under an ocean acidification (OA), ocean warming (OW) and their combination (OAW). Degrees of freedom (df), χ2 value and probability level (p) are
LISTE DES FIGURES
Figure 1 : Experimental design. Individuals of Ophryotrocha robusta and O.
japonica were exposed to control, C (24 °C and pH 8.2, blue), ocean acidification, OA (24 °C and pH 7.7, green), ocean warming, OW (28 °C and pH 8.2, red), and the combine scenario, OAW (28 °C and pH 7.7, yellow) for two generations (F1-F2). For each species and scenario, pairs of females (F) and males (M) (n = 12 pairs) were created at each generation for the life-history and physiological measurements. ... 44
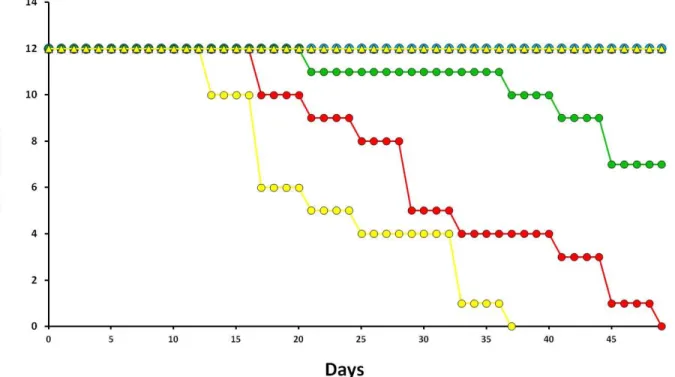
Figure 2: Cumulated mortality curves of F1 individuals O. robusta (rare species;
circles) and O. japonica (common species; triangles) along a 49 d exposure to control (blue), ocean acidification (green) and ocean warming (red) scenarios, in isolation and combined (yellow). ... 45
Figure 3: F1 survival rates for females exposed to ocean acidification (OA, green) and ocean warming (OW, red) scenarios, in isolation and combined (OAW, yellow) after 49 days exposure, on O. japonica (O. jap plain bars, common species)
and O. robusta (O. rob striped bars, rare species) survival in a 49 d exposure. NS indicates “no survival”. ... 46
Figure 4 : F1 occurrence of degeneration events in females of O. robusta (striped
bars; rare species) and O. japonica (plain bars; common species) under the F1 exposure to C (blue), OA (green), OW (red) scenarios and OAW (yellow) scenarios. ND indicates “no degeneration”. ... 47
Figure 5. Percentage of O. robusta and O. japonica breeding pairs that produced viable offspring under control (C), ocean acidification (OA) and ocean warming (OW,
red), in isolation and combined (OAW, yellow) during the F1 (plain bars) and F2 (striped bars) exposure. NS indicates “no survival” ... 48
Figure 6: Transgenerational effects of OA (green) scenario on a) fecundity (# eggs),
b) eggs volume (mm3) in O. japonica (triangle, common species) and O. robusta
(circle, rare species). Traits showing a significant species*scenario*generation effect are plotted. Reaction norms are plotted using the C scenario (blue) as reference.
Significant differences among scenarios, species and generations are showed by different capital letters (P < 0.05). ... 49
Figure 7: Transgenerational effects of global change on a) growth rate (# cheatiger
d-1) and b) fecundity (# eggs) in O. japonica (all data pooled). Significant differences
among generations are shown by different capital letters (P ˂ 0.05). ... 50
Figure 8: Transgenerational effects of global change on egg volume under a) ocean
acidification (OA, green), b) ocean warming (OW, red) and c) combined (OAW, yellow) compare to control condition (C, blue) in O. japonica. Significant differences among generations are shown by different capital letters (P ˂ 0.05). ... 51
Figure 9: a) PCA representing the variation of metabolite composition in O. robusta (rare species) after the exposure of one generation (F1) to the control (C,
black), ocean acidification (OA, red), ocean warming (OW, blue) and ocean acidification*warming (OAW, green) scenarios. Numbers represents the individual replicates. b) Correlation circle of the explanatory metabolites: aspartate (ASPA), ATP, NAD, ADP, AMP, glutamate (GLU), glucose (GLUC), proline (PROL), pyruvate (PYRU), fumarate (FUMA), malate (MALA) and a group of fatty acids (C18:0, C16:3, C18:1, C18:2, C18:3). ... 52
Figure 10: a) PCA representing the variation in metabolite composition of O. japonica (common species, black - green) and O. robusta (rare species, red - blue) after a exposure of one generation (F1) to the ocean warming (OW, blue- green) and ocean acidification*warming (OAW, red - black). b) Correlation circle of the
explanatory metabolites: aspartate (ASPA), ATP, NAD, ADP, AMP, glutamate (GLU), glucose (GLUC), proline (PROL), pyruvate (PYRU), fumarate (FUMA), malate (MALA) and a group of fatty acids (C18:0, C16:3, C18:1, C18:2, C18:3). ... 53
Figure 11: a) PCA representing the variation in metabolite composition of O. japonica (common species) across a transgenerational exposure (F1:
black-green-blue-grey; F2: red-purple-pink-gold) to the control (C, black and red), ocean acidification (OA, green and purple), ocean worming (OW, gray and gold) and ocean acidification*worming (OAW, blue and pink). b) Correlation circle of the explanatory metabolites: aspartate (ASPA), ATP, NAD, ADP, AMP, glutamate (GLU), glucose (GLUC), proline (PROL), pyruvate (PYRU), fumarate (FUMA), malate (MALA) and a group of fatty acids (C18:0, C16:3, C18:1, C18:2, C18:3). ... 54
INTRODUCTION GÉNÉRALE
Les émissions de dioxyde de carbone (CO2) d'origine anthropique ont augmenté
considérablement depuis le début de l'ère industrielle, et sont l’une des causes principales du réchauffement global (Fabry et al., 2008). Les océans, qui absorbent près du tiers de la quantité de CO2 émis (Sabine et al, 2004), subissent non seulement un réchauffement des
eaux de surfaces, mais aussi des changements au niveau de la chimie des carbonates, menant à une augmentation d'ions H+ (Riebesell et al., 2010 ; Doney et al., 2009). Ce phénomène est
connu sous le nom d'acidification des océans. Selon les prévisions pour l'an 2100, une réduction du pH de l'ordre de ~ 0.5 unités et une augmentation de la température de ~ 4°C sont attendues en se basant sur le scénario RCP 8.5 (Caldeira et Wickett, 2003 ; IPCC, 2014). Considérant la vitesse de ces changements et l'impact qu'ils auront sur l'homéostasie cellulaire, l'énergie métabolique et l'histoire de vie des organismes, la réponse des organismes marins à ces conditions futures est devenue une source de préoccupation en termes de conservation. Jusqu'à maintenant la recherche a portée surtout sur les effets des changements globaux sur les espèces marine calcifiantes, particulièrement dans le contexte d'acidification des océans (Dupont et al., 2013; Byrne et al., 2009). Par contre, il y a moins d’information quant aux effets de ces changements sur les espèces marines non-calcifiantes. Pourtant, ces dernières pourraient être tout autant affectées au niveau de leur traits physiologiques et de leur histoire de vie (e.g. Freitas et al., 2016).
Quelques études se sont penchées sur les effets de l'acidification sur la physiologie d’organismes marins, tels que les copépodes (e.g. Kurihara et Ishimatsu, 2008), les poissons (e.g. Frommel et al., 2010) et les communautés benthiques (e.g. Christen et al., 2013). Les méta-analyses combinant un grand nombre de groupes taxonomiques ont d'ailleurs démontrées que l'acidification a des effets sur la survie, la croissance et la reproduction des invertébrés (Kroeker et al., 2013; Ross et al., 2011). Ces impacts résultent de la réduction de
la différence de pH entre le milieu extracellulaire de l'organisme et son environnement, ce qui perturbe l'équilibre acido-basique et le potentiel redox des cellules et par le fait même le flux des voies métaboliques (Rokitta et al., 2012). L’acidose interne résultant de l’accumulation de H+ peut être tamponnée par le HCO
3- acquis par la dissolution du CaCO3
existant dans les coquilles des organismes calcifiants (Green et al., 2004, Manno et al., 2007; Orr et al., 2005; Wheatly et Henry, 1992). Toutefois, faire de tel ajustements au HCO3-
interne peut avoir des effets graves sur la régulation osmotique et ionique (Larsen et al., 2014), ainsi que sur les fonctions neurologiques de l’organisme affectant le comportement des organismes (Nilsson et al., 2012). Il a aussi été observé que les jeunes stades du cycle de vie sont plus sensibles à l’augmentation de la pCO2 (Kroeker et al., 2013), avec comme effets
la diminution de la vitesse du développement embryonnaire, le prolongement de la durée du stade larvaire et la réduction de la taille des larves (Ross et al., 2011). Par exemple, le ralentissement du taux métabolique chez les embryons des crabes porcelaine Petrolisthes cinctipes a d’ailleurs été observé (Carter et al., 2013), ainsi qu’une réduction de la survie des juvéniles chez cette même espèce, sans toutefois affecter la survie au stade larvaire (Ceballos-Osuna et al., 2013). De plus, la taille plus petite des larves peut réduire leur efficacité d'alimentation (Talmage et Gobler, 2010) et les réserves énergétiques peuvent être altérées. Outre l'acidification, les organismes marins sont aussi confrontés à une augmentation de la température. La température a une forte influence sur l'histoire de vie des ectothermes, puisqu'elle agit directement sur la cinétique cellulaire et leur métabolisme (Angelitta, 2009; Cossins et Bowler, 1987; Hochachka et Somero, 2002; Hoffmann, 2005; Nylin et Gotthard, 1998). La température influence le développement, la survie et la taille à maturité, ce qui est communément observé chez les crustacés (Atkinson, 1995; Weiss et al., 2009). Ces effets sont notamment engendrés par la dénaturation de protéines et l'inhibition d’enzymes, lorsque la température est en dehors de la gamme de tolérance de l'organisme, ce qui peut également entraîner une réduction du fitness des individus à long terme (Pörtner, 2001; Pörtner et Knust, 2007). Dans le cas des ectothermes, leur fenêtre de performance est généralement corrélée avec la température de leur environnement (Huey et Stevenson, 1979; Huey et Kingsolver, 1989; Tewksbury et al., 2008). Ainsi dans un contexte de changements climatiques, les
3
ectothermes seront plus à risque et seront forcés de performer à des températures sous-optimales ou sur-sous-optimales à leur fenêtre de tolérance thermale. Dans un contexte d’exposition multiple à des facteurs de stress environnementaux, il a été démontré, chez les crabes araignées (Hyas araneus) par exemple, que l’acidification réduise la fenêtre de tolérance thermale, influençant donc leur sensibilité au réchauffement (Walther et al., 2009). Finalement, les changements climatiques devraient favoriser les espèces avec une fenêtre thermale plus large plutôt que celles avec des fenêtres plus étroites (Angelitta et al., 2002; Pörtner et Farrell, 2008; Magozzi et Calosi, 2015).
Les espèces ont recours à trois mécanismes pour éviter l'extinction locale : la migration, la plasticité phénotypique et l'adaptation rapide (Hoffmann and Sgrò, 2011; Gonzalez et al., 2013; Salinas et al., 2013; Sunday et al., 2014). Dans le cadre de ce mémoire, je m’intéresserai spécifiquement à la plasticité. Plusieurs définitions de la plasticité phénotypique existent et sont encore débattues, mais celle à laquelle je souscris est la définition de West-Eberhard (2003) qui stipule que la plasticité phénotypique est la capacité d'un même génotype à réagir à un changement environnemental en modifiant sa forme, son état, ses mouvements, ses activités ou sa physiologie, c'est-à-dire à exprimer plusieurs phénotypes. Dans le cas des espèces moins plastiques (possédant une capacité d’acclimatation réduite), celles-ci seraient plus à risque à l’extinction locale, pouvant mener à une perte de biodiversité et une réduction des fonctions des écosystèmes océaniques (Solan et al., 2004; Christen et al., 2013; Kroeker et al., 2011). Plusieurs études se sont intéressées à la plasticité phénotypique, mais ont mis l'emphase sur ce mécanisme à l'intérieur d'une même génération (Nicotra et al., 2010). Il est d'autant plus essentiel de comprendre ce phénomène à une échelle de temps plus grande et de l'appliquer sur plusieurs générations. West-Eberhard (2003) mentionne notamment que la plasticité phénotypique n'est pas seulement limitée au génotype, puisque la capacité de réponse d'un individu est d'abord influencée par l'expérience de ses parents dans l’environnement. Le concept de plasticité transgénérationnelle (PTG), dicte que les conditions environnementales expérimentées par les parents affectent les normes de réactions des descendants (Salinas et al., 2013). L'interaction de l'environnement des parents, l’environnement des descendants et leurs
génotypes déterminent donc le phénotype des descendants (Salinas et al., 2013). Ce nouveau concept de plasticité est au centre d'intérêt de plus en plus d'études (Romero-Rodriguez et al., 2015; Gibbin et al., 2015; Chakravarti et al., 2016; Dupont et al., 2013). Plusieurs d’entre elles ont d’ailleurs démontré que la PTG peut agir comme un tampon contre les effets négatifs de différents stress environnementaux, tels que le réchauffement des océans (Donelson et al., 2012; Shama et al., 2014a), l'acidification (Parker et al., 2012; Allan et al.,2014; Murray et al., 2014; Pedersen et al., 2014) et les changements de salinité (Renborg et al., 2014; Jensen et al., 2014). Dupont et al. (2013) ont d'ailleurs démontré que l'acclimatation à long terme des oursins de mer adultes Strongylocentrotus droebachiensis exacerbe les impacts négatifs de l'acidification sur les larves et les juvéniles. Ainsi, la transmission d'informations non-génétiques provenant de l'environnement des parents permet aux descendants de se développer en considérant ces conditions et de réagir de manière anticipée (Sunday et al., 2014).
Le niveau de plasticité phénotypique non seulement varie entre les espèces, mais varierait aussi en fonction de leur biogéographie. En effet, les réponses des espèces marines face aux changements environnementaux vont dépendre de leur gamme de tolérances physiologiques, qui elles seraient directement liée à la taille de leur niche fondamentale (Spicer et Gaston, 1999; Gaston et Spicer, 2001). Plus spécifiquement, les espèces ayant une niche fondamentale plus large sont en mesure d’exploiter une plus grande variété de ressources, tendent à atteindre des densités locales plus grandes, peuvent faire face à un éventail de conditions environnementales plus large et occuper des aires géographiques plus grandes (espèces communes), comparativement aux espèces avec une niche plus étroite (espèces rares) (Brättstrom, 1968, 1970; Gaston et Spicer, 2001; Lomolino et al., 2006). Il a d'ailleurs été démontré que les limites de tolérance de température varient entre les espèces à répartitions distinctes, conséquence de leur adaptation à leur régime environnemental, chez certaines espèces de coléoptères aquatiques (Calosi et al., 2010), de crabes porcelaines (Stillman et Somero, 2000) et de poissons (Platycephalus fuscus et Pseudocrenilabrus multicolor victoriae) (Gannon et al., 2014; McDonnell et Chapman, 2015). De plus, considérant que la plasticité comporte des coûts associés à l'homéostasie cellulaire et à
5
l'énergie métabolique (Parker et al., 2012; Rodrigues-Romero et al., 2015; Chakravarti et al., 2016; Gibbin et al., 2015), les organismes devront faire des compromis énergétiques pour répondre aux changements de conditions abiotiques, ce qui pourrait engendrer des impacts négatifs sur leur histoire de vie, notamment la survie, la croissance et la reproduction (Kroeker et al., 2013). Il est alors fort probable que les espèces rares subissent des conséquences métaboliques plus importantes. Il ne faut pas non plus mettre de côté la possibilité que ces espèces aient pu être distribuées dans des gradients plus large, puis devenir rare pour d’autres raisons qu’une niche fondamentale restreinte. Le développement des connaissances sur la plasticité transgénérationnelle est donc essentiel pour comprendre l'évolution des espèces dans le contexte des changements globaux et s'assurer qu'elles ont un potentiel évolutif suffisamment grand pour éviter l'extinction.
Sachant que la plasticité est le premier mécanisme entrant en jeu pour permettre l'acclimatation (Hoffmann et Sgrò, 2011; Sunday et al., 2014), il est intéressant de comparer les réponses d'espèces étroitement liées phylogénétiquement, mais à biogéographie différente. La comparaison entre les espèces rares et communes est d'autant plus utile dans un contexte de conservation de la biodiversité que la majorité des espèces ont des distributions restreintes et que peu sont largement distribuées (paradigme de la biodiversité) (Darwin, 1859; MacArthur, 1972; Gaston, 1996, 2003, 2009).Les investigations quant aux réponses des espèces face aux changements globaux dans un contexte biogéographique sont minimes, même absentes lorsqu’on y intègre la PTG. Il y a un clair besoin d’adresser des questions éco-évolutives en biologie des changements globaux, portant sur la biodiversité et les paradigmes biogéographiques, pour établir des modèles généraux de réponses de la biodiversité face aux changements globaux et aider à la prédiction des paradoxes de la biodiversité (Calosi et al., 2016). Par conséquent, notre étude sera la première à déterminer si les espèces rares et communes (1) montrent différentes nivaux de tolérance environnementale et (2) différents degrés de PTG, lorsque soumises à des expositions intra- et transgénérationnelle dans des conditions de réchauffement et d’acidification des océans, et (3) à évaluer les coûts énergétiques associés à ces réponses intra- et transgénérationnelle.
Pour répondre à ces questions, nous avons étudié deux espèces de polychètes marins du genre Ophryotrocha caractérisées par la même écologie mais des distributions géographiques différentes : une espèce rare (O. robusta) et une espèce commune (O. japonica). Plus spécifiquement, nous avons caractérisé leur histoire de vie (croissance, fécondité, volume des œufs) sous des expositions intra- et transgénérationnelle face à des conditions de température et de pCO2 élevées qui imitent les prévisions de réchauffement et
d’acidification des océans pour la fin du siècle, séparément et en combinaison. Finalement, nous avons investigué les coûts énergétiques associés aux réponses intra et transgénérationnelle en utilisant les analyses métabolomiques comme proxy pour l’activité aérobique/anaérobique et les réserves d’énergie (Verberk et al., 2013 ; Viant et al., 2003). Ceci nous a permis de vérifier si l’espèce rare montre une plus grande sensibilité en termes d’activités métaboliques (production d’énergie et réserves) que l’espèce commune, lorsqu’elles sont exposées au réchauffement des océans (RO), l’acidification des océans (AO) et à ces changements combinés (RAO).
CHAPITRE 1
Rarity and the global change: Tolerance and capacity for transgenerational plasticity to global changes in rare and common marine polychaetes.
Cynthia Thibault1, Gloria Massamba-N’Siala1, Fanny Noisette2, Fanny Vermandele1, Mathieu Babin2, Piero Calosi1
1Département de Biologie, Chimie et Géographie, Université du Québec à Rimouski, 300
Allée des Ursulines, Rimouski, QC G5L 3A1, Canada
2Institut des Sciences de la Mer, Université du Québec à Rimouski, 310 Allée des Ursulines,
Rimouski, QC G5L 3A1, Canada
Cet article est présentement en révision finale par les autres co-auteurs et sera soumis d’ici l’été à la revue Journal of Biogeography.
1.1 RESUME
La variation au sein de la répartition géographique des espèces est observée depuis longtemps, et il a été reconnu, qu’à l’intérieur d’un groupe taxonomique, la majorité des espèces ont une distribution géographique restreinte (espèce rare), alors que peu sont largement distribuée (espèce commune). L’explication la plus acceptée quant à la variation du niveau de biodiversité à travers le monde est la différence au niveau de la « niche » des espèces, qui ultimement définit l’amplitude de leur distribution géographique. La variation des traits physiologiques joue un rôle pivot dans la définition de la niche des espèces, et par le fait même leur distribution géographique. Ainsi les espèces rares auront de plus petites fenêtres de tolérance physiologique et des niveaux de plasticité plus faibles, faisant d’elles des espèces plus à risque à l’extinction locale dans le contexte des changements globaux. En
considérant que les espèces rares sont les plus nombreuses, leurs réponses face aux changements rapides en cours dans leur environnement vont avoir des impacts sur la diversité taxonomique au sein du règne animal, ainsi que sur la structure et les fonctions des futurs écosystèmes. Le réchauffement et l’acidification des océans vont avoir des répercussions sur un grand nombre de processus cellulaires. Par les changements au niveau du métabolisme énergétique, puis l’altération des traits d’histoire de vie, c’est toute la structure et le fonctionnement des écosystèmes qui seront bouleversé. La plasticité phénotypique peu rapidement aider à rétablir et maximiser les performances des organismes à l’intérieur d’une (intra-générationnelle) ou plusieurs générations (transgénérationnelle) lors de changements dans leur environnement. Par conséquent, le but de notre étude était d’investiguer si des espèces rare et commune répondent différemment aux scénarios de changements globaux en environnement marin, et si leur tolérance et capacité pour la plasticité transgénérationnelle sont différentes. Pour répondre à ces questions, deux espèces de polychètes du genre Ophryotrocha, une rare (O. robusta) et une commune (O. japonica), ont été exposées à quatre scénarios de changements globaux prédits pour la fin du siècle sur deux générations, soit des conditions de contrôle (C), d’acidification des océans (AO), de réchauffement des océans (RO) et un scénario combiné (RAO)). Les traits d’histoire de vie (croissance, fécondité, volume des œufs) ont été mesurés sur une période de quatre mois, après quoi les profiles métabolomiques des individus ont été analysés pour mettre en évidence les métabolites liés aux changements des traits d’histoire de vie. En général, la température élevée a été le facteur principal affectant négativement les performances de l’espèce rare. L’augmentation de la température a eu un impact négatif sur le fitness et la survie de O. robusta. À l’opposé, le fitness de l’espèce commune, mesurés en termes de taux de survie et de capacité à contribuer à la prochaine génération, est demeuré plutôt élevé dans tous les scénarios et générations. L’espèce commune a été l’espèce la plus performante dans les différents scénarios, probablement par le bénéfice des mécanismes de plasticité intra et transgénérationnelle. Ce qui mène à la conclusion que l’espèce rare possède une fenêtre de tolérance plus étroite que l’espèce commune et qu’elle aura plus de difficulté à faire face aux futures conditions de changements climatiques. Ces résultats ont une portée importante au niveau de la
9
conservation de la biodiversité marine, considérant que les espèces rares sont communes dans le règne animal et ont un rôle clé en ce qui a trait aux fonctions des écosystèmes.
Mots clés : Distribution géographique, tolérance, changements globaux, plasticité
11
1.2 ABSTRACT
Variation in the geographical range of species has long been observed, and it well established that most species have a restricted geographic distribution (rare species), whilst few are geographically widespread (common species). One explanation for the variation in biodiversity levels across the globe is that difference in species’ ‘niche’ ultimately defines the breadth of their geographical distribution. Variation in physiological traits is considered to play a pivotal role in defining species niche, and thus their geographical distribution and local abundance, predicting that rare species will have smaller physiological tolerance windows and plasticity levels. Rare species’ responses to rapid ongoing changes in their environment will then greatly define taxonomic diversity across the tree of life, as well as the functions of future ecosystems. Ocean warming and acidification will have impacts on a number of cellular processes. Through shifts in metabolic energy and alteration of life-history traits, all the ecosystem’s structure and functions will be affected. Phenotypic plasticity can rapidly help re-establishing and maximising organisms’ performances within and between generations when environmental changes occur. Consequently, the aim of our study was to determine if rare and common species respond differently to global changes scenarios in a marine environment, and if their tolerance and capacity for transgenerational plasticity are different. To answer this, two species of polychaete of the genus Ophryotrocha, one rare (O. robusta) and one common (O. japonica), were exposed to four different climate change scenarios predict to occur by the end of the century for two generations (control (C), ocean acidification (OA), ocean warming (OW) and a combined scenario (OAW)). Life history traits (growth, fecundity and eggs volume) were measured on a four months period, after which metabolomics profiles were analysed to highlight molecular pattern (energetic metabolism) linked to life history traits’ changes. Overall, the high temperature was the main factor negatively affecting the rare species’ performances. The increase in temperature impacted the physiology of O. robusta, ultimately affecting its reproduction and survival. On the other hand, the common species’ reproduction, measured in terms of survival success and capacity to contribute to the next generation, remained quite high for all scenarios and
generations. The common species was also the most tolerant species under global change scenarios, likely benefiting from both within- and transgenerational plasticity mechanisms. Hence the rare species appear to possess a narrower tolerance window than the common species, and might will have more difficulties to cope with future climatic conditions. These results will likely have important impacts on marine biodiversity levels and conservation, considering that rare species are common in the animal kingdom and have key role in ecosystem functions.
Key words: Geographic distribution, tolerance, global changes, transgenerational plasticity,
13
1.3 INTRODUCTION
<< Evolution, extinction and dispersion: these are three fundamentals processes in biogeography by which species respond to spatial/temporal dynamics and by which species geographic ranges areshaped >>(Lomolino et al., 2006).
Variation in the geographical range size of species has long been observed (Darwin, 1859; Humboldt, 1808), and it has been recognized that, within a same taxon, most of the species have a restricted geographic distribution hereafter rare species, whilst few are geographically widespread hereafter common species. This defines the so-called ‘rarity-richness’ paradigm (MacArthur, 1972; Gaston, 1996, 2003, 2009) which states that rare species, even if they are not dominant in term of biomass in an assemblage, have key roles in the structure and function of this assemblage because they are ecologically different from the common species. The most accepted explanation for variation in biodiversity levels across the globe is that difference in species’ ‘niche’ (sensu Hutchinson 1957, 1978) ultimately defines the breadth of their geographical distribution. More specifically, the Niche Breadth-Range Size Hypothesis (see Brown 1984; Gaston et al. 2009) states that species with broader fundamental niches have larger range sizes, as they are able to cope with a wider range of environmental conditions, persist in more places and occupy a wider area than their narrow-niches relatives (Brättstrom, 1968; Gaston & Spicer, 2001). Variation in physiological traits is considered to play a pivotal role in defining species niche (Gaston & Spicer, 2001), and thus their geographical distribution, predicting that rare species will have smaller physiological tolerance windows and plasticity levels (Calosi et al., 2008 - 2010; Gaston et al. 2009; Sunday et al. 2012; Spicer and Gaston, 1999; Tewksbury et al., 2008), thus being more at risk to local extinction within the context of the global change (Calosi et al., 2008). As a consequence, the ongoing and future high rates for species loss at a local, regional and global level have attracted renewed attention on the need to understand rare species tolerance to global changes (Barnosky, 2011; Wake, 2008; Ceballos, 2015).
Considering that rare species are most numerous across taxa, their responses to rapid ongoing changes in their environment will greatly define taxonomic diversity across the tree of life, as well as the structure and functions of future ecosystems (Solan et al., 2004; Gaston, 2012; Thomsen et al., 2017). The fate of marine biodiversity within the context of global changes is a source of great concern in marine environments (Worm et al., 2006; Cheung et al., 2009; Fabry et al. 2008; Wootton et al. 2008; Hale et al. 2011).
The increase in atmospheric CO2 levels due to anthropogenically driven CO2
emissions are causing the so called green-house effect, responsible for the current warming trends of Earth’s atmosphere and oceans (IPPC, 2014; Sokolov et al. 2009). In addition, the absorption of atmospheric CO2 by the world’s oceans is causing an increase in seawater
pCO2, CO2 and bicarbonate ions concentration as well as a reduction in seawater carbonate
ions concentration and pH, a phenomenon called ocean acidification (Caldeira & Wickett 2003). These perturbations can have repercussions on a number of cellular processes, especially for ectotherms (Huey and Steevenson, 1979; Huey and Kingsolver, 1989; Melzer et al., 2009), and can, through shifts in metabolic energy and the alteration of life-history traits, lead to changes in the structure and functioning of communities and ecosystems.
The fundamental impacts of seawater warming on the developmental, life history and physiological functions of organisms, are in general well understood because of the prominent action of temperature on cellular kinetic and metabolism (Cossins and Bowler, 1987; Hochachka and Somero, 2002; Angiletta, 2009). Moreover, the link between species’ thermal biology and their biogeography has been largely reported and reviewed in the literature (Pörtner and Knust 2007, Gaston et al 2009, Bozinovic et al. 2011; Sunday et al., 2012). Conversely, the current understanding of the biological implications of ocean acidification, mainly through the alteration of cellular homeostasis and energy metabolism, is less extended but rapidly increasing (Melzner et al., 2009; Kroeker et al. 2013; Ross et al., 2011; Wittmann and Pörtner, 2013). Much less is then known for ocean acidification as a potential driver for species’ biogeography (c.f. Rosa and Seibel 2008; Maas et al. 2012;
15
Calosi et al. 2013a-b, 2017). In the context of global changes, a better understanding of the combined effects of ocean warming and acidification on marine organisms is needed to accurately predict the biogeographical consequences of this prominent interaction, and ultimately the fate of biodiversity patterns locally and globally. In addition, there is a clear need for global change biology studies addressing fundamental eco-evolutionary questions, such as those on fundamental biodiversity and biogeographical paradigms (Dupont and Pörtner, 2013), for establishing general patterns of biodiversity under rapid environmental changes (Lucey et al. 2016; Calosi et al. 2016, 2017). In turns, the fate of marine rare species in a rapidly changing ocean is still uncertain, in particularly as studies so far are not accounting for species’ ability for transgenerational plasticity, a key driver of organism responses to environmental changes (Reusch, 2013; Munday et al., 2013; Sunday et al., 2014; Calosi et al., 2016).
Phenotypic plasticity is defined as the capacity of an individual to change its morphological features, movement, activity or physiology, or in other words, expressing different phenotypes in a new environment, whilst maintaining an unchanged genotype (West-Eberhard, 2003). Phenotypic plasticity can rapidly help re-establishing and maximising organisms’ performances within and between generations when environmental changes occur (West-Eberhard, 2003; Ghalambor et al. 2006; Sunday et al. 2012; Calosi et al. 2016). When new environmental conditions set and persist for more than one generation as it is the case within the context of global changes, the parental environment can influence the progeny performances, a mechanism called transgenerational plasticity (TGP hereafter) (Bonduriaski et al, 2012; Marshall et al., 2008). TGP has been shown to buffer the negative impacts of global changes (e.g. Donelson et al., 2012; Shama et al., 2014a; Parker et al., 2012; Murray et al., 2014; Romero-Rodriguez et al., 2015; Chakravarti et al., 2016), but at this stage, this beneficial effect on organismal functions has not been linked to future species biogeography. Consequently, the aim of our study was that to investigate whether congeneric species with different geographical range, i.e. rare vs common species, show (1) different levels of tolerance and plasticity for physiological and life history traits within a generation,
(2) different capacity for transgenerational plasticity, and (3) different energetic costs associated with exposure to future global change scenarios. Our working hypothesis, based on the Niche Breadth-Range Size Hypothesis (Brown 1984; Gaston et al. 2009), is that rare species will be less tolerant and have a reduced capacity to adjust their phenotype through TGP, as well as higher metabolic costs, when compared to their common relatives.
To address these questions, we investigated the within and transgenerational responses to ocean warming and acidification of two phylogenetically closely-related marine polychaete species of the genus Ophryotrocha: one rare (O. robusta) and one common (O. japonica) (Paxton & Åkesson, 2010). We then characterized the life history (growth, fecundity and egg volume) within- (F1) and across generations (F1-F2) in worms exposed to elevated temperature and pCO2 conditions mimicking ocean warming and acidification
scenarios for the end of the century, in isolation and combination. The existence of inter-specific differences in the metabolomic profile was also employed to estimate aerobic/anaerobic activity and energy reserve content in the investigated species, in order to provide a mechanistic understanding of the metabolic and energetic costs associated to the within- and transgenerational exposure to the scenarios tested.
17
1.4 MATERIAL AND METHODS
Description of the studied species
The Ophryotrocha (Dorvellidae) species investigated in this study share similar morphology and ecology, but present different geographical distributions. These species are both sub-tidal, interstitial species (3-4 mm in length) found in the fouling communities that colonise the hard structures of harbour and shallow coastal waters environments (Prevedelli et al., 2005; Simonini et al., 2009a, b; Thornhill et al., 2009). Both species are gonochoric and reproduce semi-continuously along an extended reproductive period, laying the eggs in tubular masses that hatch with direct development (Prevedelli et al., 2006; Paxton and Åkesson, 2010). A newly hatched individual generates its first brood in a relatively short amount of time (approx. 47 d at 24 °C), and parental cares are provided for the whole duration of the development of the eggs. Despite these similarities, O. japonica possesses a wider geographical distribution than O. robusta. Ophryotrocha japonica is considered as a non-indigenous species, native to the Temperate Northern Pacific (Simonini 2009; Paxton & Åkesson 2005). It was recorded for the first time in Europe along the Mediterranean coastline in 1999 (Simonini 2002) and since then, it has successfully increase its occurrence, becoming the second most common Ophryotrocha species (Simonini et al 2009). On the other hand, O. robusta is a rare species endemic of the Mediterranean Sea with an ascertained recent distribution limited to three locations in Southern Sicily, Italy (Simonini et al., 2009).
Experimental preparation and design
The worms used in our investigation came from laboratory strains originated from approx. 40 individuals collected in 2008 in the harbour of Porto Empedocle (Sicily, Italy; 37°17’4’’N, 13°31’3’’E) for O. robusta, and 100 individuals collected in 2010 in the harbour of La Spezia (Liguria, Italy, 44° 6' 24'' N, 9° 49' 45'' E) for O. japonica. Both strains were maintained in laboratory, in control conditions (salinity: 35; temperature: 24 ° C; pHNBS =
In order to test if the rare and common species investigated showed different levels of sensitivity to scenarios mimicking ocean warming and acidification conditions predicted to occur by the end of the century (IPCC, 2014), individuals of each species were exposed for two generations to each scenario in isolation and combined, and their within- and transgenerational life-history and physiological responses were compared. A total of 48 breeding pairs were originally formed for each species using specimens taken from the laboratory strain (F0 generation), and each pair was isolated in separated wells for reproduction (Fig. 1). Once a sufficient amount of offspring (F1 generation) was obtained, 20 individuals were randomly taken from each of 12 broods, 21 d after hatching, and transferred to one of the four temperature/pH treatment combinations chosen to mimic current and future oceanic scenarios according to the IPCC (2014) predictions: (1) 24 ± 1 °C and pH 8.2 ± 0.1 (corresponding to 400 atm pCO2) as the control scenario (C), (2) 24 ± 1
°C and pH 7.7 ± 0.1 (corresponding to 1500 atm pCO2) as the ocean acidification scenario
(OA), (3) 28 ± 1 °C and pH 8.2 ± 0.1 (corresponding to 400 atm pCO2) as the ocean
warming scenario (OW), and (4) 28 ± 1 °C and pH 7.7 ± 0.1 (corresponding to 1500 atm pCO2) as the combined ocean acidification and warming scenario (OAW). The control
temperature was representative of the average thermal conditions experienced by both species in their environment when collected, while the elevated temperature represented a + 4 °C scenario of OW predicted to occur by the end of the century in the Mediterranean Sea (RCP8.5; IPCC, 2014). The low pH/high pCO2 values mimicked an OA scenario predicted
for the end of the century (+ 600 µatm / - 0.4 pH unity; IPCC 2014).
Once the F1 individuals reached sexual maturity, 12 breeding pairs were formed per species per scenario by pairing females and males taken from different broods to prevent inbreeding depression (Paige, 2010; Massamba N’Siala et al., 2011). Each pair was then isolated in a well of a six-well plate, and its first egg mass was used to obtain the next generation (F2). F2 individuals were followed until reaching sexual maturity and paired as described for the F1, maintaining them in the same conditions as their parents (Fig. 1).
19
Experimental system
The experimental scenarios were generated and maintained using a carbon dioxide (CO2) and temperature manipulation system, similar to the one described in Chakravarti et
al. (2016). The system was composed of two large containers (60 cm x 30 cm x 15 cm, vol. 13 L) for each temperature condition, half-filled with tap water and heated with an aquaria heater (Theo 11702, Hydor, Sacramento, CA, USA). Each container, used as water baths, was equipped with a water pump ensuring the homogenous distribution of the heat (Koralia nano 900, Hydor) and a Perspex sheet limiting the heat dissipation through evaporation.
Each container contained four airtight experimental aquaria (Sterilite, 26 cm x 18 cm x 17 cm, vol. 4.5 L), two perfused with CO2-enriched air to reach the low pH/ high pCO2
condition, and two perfused with ambient air to maintain control pH/pCO2 conditions. For
both conditions, ambient air was supplied to the aquaria by an air pump (Mistral 4000, Aqua Medic, Bissendorf, Germany) and bathed in 1M sodium hydroxide (NaOH) solution to remove the excess of CO2 and reach a pH of 8.1. For the low pH condition, the air perfusing
the aquaria was then enriched with pure CO2 with a constant flow checked by a CO2 analyzer
(LI-840A, Li-Cor, Lincoln, NE, USA).
Each aquaria contained four, six-well culture plates (Costar, VWR, Radnor, PA, USA), two for each species, and each plate housed three F1 and three F2 breeding pairs and their corresponding broods (n = 3 pairs/broods per plate, 12 replicate pairs/broods total per scenario, species and generation, Fig. 1). Plates were filled with artificial sea water (salinity 35) made by dissolving artificial sea salt (Reef Crystals, Instant Ocean, Blacksburg, VA, USA) in distilled water. They were covered with a breathable sealing film (Aeraseal, Alpha Laboratories Ltd, Eastleigh, UK), which allowed gas exchanges whilst limiting evaporation, thus avoiding large salinity and temperature fluctuations. The sea water in the wells was changed every 2 d, using sea water kept in the same conditions (in each aquaria) in spare beakers. Worms were fed on the same day by adding ~ 1 mL of minced spinach in sea water (300 g L-1) (Romero-Rodriguez et al., 2015), after having removed the uneaten food.
F1 individuals were transferred to the elevated temperature (28 °C) through a gradual pre-exposure of 1 °C h-1 from the control temperature as in Massamba-N’Siala et al. (2012,
2014). Exposure to the low pH/high pCO2 condition was achieved by transferring F1
individuals in the system and gradually diffusing the air mixed with CO2 in the corresponding
experimental aquaria. Temperature, pH and salinity were measured every 2 d in two wells, selected randomly, and one beaker (which contained new seawater) per aquaria. The mean physico-chemical parameters of the sea water measured and calculated for each scenario are shown in Table 1 and the methods used to measure and/or calculate them are in Suppl. Mat.
Determination of life‐history traits
The female survival rate was calculated as the number of remaining females after 49 d of exposure, divided by the number of females at the beginning of the experiment *100. This period corresponded to the period after which 100 % of O. robusta females died in OW and OAW scenarios.
Female size was measured at each spawning event of each individual, and these data was used to calculate female growth rates as the number of chaetigers (i.e segments bearing bristles) added daily from hatching until they reach their maximum size, i.e. the maximum amount of chaetigers counted during the duration of the experiment (around 60 d exposure) (Massamba-N'Siala et al., 2012). Degeneration events, defined as the loss of chaetigers during an individual development, were also recorded.
The number of degeneration events and the percentage of pairs producing viable offspring was used as proxy for female reproductive success. In addition, females’ fecundity was measured as the number of eggs laid at the second reproductive event (first egg mass used to obtain F2 generation). Pictures of the second egg masses were taken under low-medium (x 40) and higher (x 100) magnification, maximum 24 h after its deposition, using a microscope (Laborlux S, Leitz, Oberkochen, Germany) equipped with a digital camera (OMAX A-3530U, Kent, WA, USA) (Romero-Rodriguez et al. 2015). x40 pictures were used to count the number of eggs as the x100 ones were analysed to determine the egg
21
volume, a proxy for egg quality (Allen and Marshall, 2014). The longest and shortest axes of 10 eggs per mass were then measured using imageJ program (Schneider et al., 2012), and egg volume calculated using the formula:
(Eq. 1) ∗ ∗ ∗
Tableau 1 : Mean ± SE of the seawater physic-chemical parameters measured [salinity, temperature, pHNBS, Dissolve Inorganic Carbon (DIC)] and calculated [CO2 partial pressure (pCO2), Total Alkalinity (TA), carbonate and bicarbonate ions concentrations (HCO3- and CO32-), calcite and aragonite saturation (Ωcal and Ωara)] for each scenario. Capital letters represent significant differences between treatments.
a Calculated by CO2SYS program (Lewis and Wallace, 1998) with constants from Mehrbach et al. (1973) and corrected by Dickson and Millero (1987) and KSO4
constants from Dickson (1990).
Scenario Salinity pHNBS Temperature
(°C) DIC (μmol kg−1) TAa (μmol kg−1) pCO2 (µatm) [HCO3-]a (μmol kg−1) [CO32-]a
(μmol kg−1) Ωcala Ωaraa
Control 34.48 A ± 0.85 n = 376 8.16A ± 0.14 n = 683 24.29A ± 1.10 n = 705 2326.80A ± 6.84 n = 32 2681.60A ± 8.76 n = 32 436.08A ± 2.24 n = 32 2048.28A ±5.35 n = 32 266.28A ± 1.91 n = 32 6.48A ± 0.05 n = 32 4.27A ± 0.03 n = 32 Ocean warming 35.38 A ± 3.36 n = 379 8.10A ± .17 n = 675 28.20B ± 0.89 n = 681 2208.01C ± 16.09 n = 20 2583.56A ± 17.07 n = 20 433.61A ± 7.96 n = 20 1921.10A ± 14.98 n = 20 275.60A ± 3.13 n = 20 6.70A ± 0.08 n = 20 4.45A ± 0.05 n = 20 Ocean acidification 33.43 B ± 0.23 n = 391 7.67B ± 0.13 n = 698 24.37A ± 1.02 n = 704 2595.39D ± 8.57 n = 31 2686.93A ± 8.61 n = 31 1645.61B ± 10.58 n = 31 2449.12B ± 8.15 n = 31 100.13B ± 0.59 n = 31 2.44B ± 0.02 n = 31 1.60B ± 0.01 n = 31 Ocean acidification and warming 35.20 B ± 2.53 n = 390 7.69B ± 0.13 n = 697 28.18B ± 1.14 n = 686 2525.08B ± 17.92 n = 20 2568.85A ± 17.76 n = 20 2141.30B ±65.04 n = 20 2371.09B ± 16.43 n = 20 82.99B ± 1.61 n = 20 2.04B ± 0.04 n = 20 1.38B ± 0.12 n = 20
23
Determination of metabolomic fingerprinting
In order to characterise the energetic metabolism and fatty acid composition of the rare and common species examined here, and thus provide a mechanistic understanding of the life-history responses measured, breeding pairs (male and female individuals) from each scenario, generations and species were individually flash frozen in 1.5 mL centrifugal PP tube at the end of the experiment, and maintained at -80 °C. Since none of the O. robusta breeding pairs survived the exposure to the OW and OAW scenarios, metabolomics analyses were performed on the few individuals remaining from the original groups exposed (see fig. 1 in the supplementary material). This group correspond to the 20 worms transferred in each wells of the plates before the formation of the breeding pairs (see the experimental design above, Fig. 1). These individuals were then kept in OW and OAW conditions for the same amount of time (max. of 49 d in OW and 37 d in OAW) than the breeding pairs. As these individuals were in the same conditions and did not reproduce also in OW and OAW conditions, no distinction was made between “breeders” and “non-breeders” in the analysis.
Extractions of key targeted metabolites, were carried out following the method described by Lu et al. (2006), originally tested on the bacterium Salmonella enterica, and modified to be applied on small marine organisms such as polychaetes, particularly to prevent the formation of salt adducts when injecting marine organism samples. For this, a fast “cold quenching salt-eliminating” extraction was developed, using an ammonium carbonate as an extraction solution. In more details, 4.8 g of ammonium carbonate (trace metals-grade 99.999 %; Sigma-Aldrich, St. Louis, MO, USA) was dissolved in 1 L of Nanopure water (18.0 Ω, Barnstead infinity system, Lake Balboa, CA, USA) to create a 50 mM ammonium carbonate solution. Then, 0.4 mL of this solution was added to 1.6 mL of Nanopure water and 8 mL of methanol in order to produce a final 8:2 methanol: water-10 mM ammonium extraction solution.
In order to allow for a sensitive detection of the targeted metabolites, specifically chosen for their key role in energy metabolism and cellular function, the method was developed using different mix of standards. The amino acid standard was obtained from Phenomenex (Torrance,
CA, USA) and the free fatty-acid standard was created by hydrolyzing a FAME 37 standard (Sigma-Aldrich, St. Louis, MO, USA). To do so, 250 µL of FAME 37 was evaporated under nitrogen in a 1.5 mL PP centrifugal tube. 50 µL of KOH 6.25 % (w/v) in Nanopure water was then added and the tube was heated for 30 min at 60 °C. 950 µL of the extraction solution was then added and the tube was centrifuged at 8 000 rpm. The supernatant was then transferred to HPLC amber vial and was stored in -80 °C. For all the other metabolites standards, obtained from Sigma-Aldrich (St. Louis, MO, USA), individual metabolite solutions were created by precisely weighing each standard into clear HPLC vials to produce 1 mg mL-1 solution in the extraction solution. A
final working solution, containing all targeted metabolites, was then created by pooling 1000 µL of the amino acid standard, 2000 µL of the free fatty acid standard, 500 µL of glucose and 50 µL of each other individual metabolite solution. Extraction solution was added to the mix to reach a final volume of 10 mL. From this final working solution, a serial dilution 1:1 in the extraction solvent was conducted to create 10 different metabolite concentration solutions for the calibration curve.
Once the method was developed and tested for the targeted metabolites, metabolomics analyses were realised on the polychaete samples. Each centrifugal PP tube (1.5 mL) containing a single frozen polychaete was bathed in liquid nitrogen (to avoid thawing and thus metabolites degradation during the manipulations). Then 250 µL of the extraction solution, kept continuously at -80 °C, was added in the tube and a potter pestle (blue pre-sterilize, Axygen, Tewksbury, MA, USA) was used to crush the sample. Once homogenised with the potter pestle, the sample was sonicated for 3 s (Sonication bath, model Symphony, VWR, West Chester, PA, USA) and then centrifuged at 11 000 rpm for 3 min at 4 °C (centrifuge 5430R, Eppendorf, Hamburg, Germany). Then, 225 µL of the supernatant was transferred in a 250 µL glass insert inside an amber HPLC vial (Wheaton, New Jersey, USA). The vial was then injected in a liquid chromatography system (Accela, Thermo Electron Corporation, San Jose, CA, USA) equipped with a 150 mm X 2 mm Luna C5 guard column for Phenomenex (Torrance, CA, USA). The system was adjusted with the following parameters: autosampler temperature set at 4 °C, a column temperature set at 20 °C, an injection volume of 25 µL and a solvent flow rate of 200 µL min-1. LCMS-grade acetonitrile
25
Chester, PA, USA) was used for the mobile phases. A 50 mM of acetonitrile (ACN) in carbonate water (90:10) was used for mobile phase A whilst mobile phase B was composed of ACN: 5 mM ammonium carbonate water solution. The gradient program started at 2 % of mobile phase A over 2 min and reach 98 % of mobile phase A at 6 minutes until the minute 15. The initial conditions of 2 % of mobile phase A was re-established at 17 minutes and was followed by a conditioning of 13 min for a total run time of 30 min. The identification of metabolites previously separated was then achieved on an Orbitrap LTQ Discovery high-resolution mass spectrometer (HRMS) (Thermo Electron Corporation, San Jose, CA, USA), sequentially in a positive and negative mode. The electrospray ionization spay voltage was of 5000 V in positive mode and of 3200 V in negative mode. Nitrogen was used as sheath gas at 55 arbitrary units with a capillary temperature of 325 °C and the scan range was from 60 to 1000 m/z for both modes.
HRMS data were then analysed on Xcalibur 2.0 software (Thermo Electron Corporation, San Jose, CA, USA) using a 10 ppm mass tolerance. For each targeted metabolite, a calibration curve was created using the 10 diluted working solution (see above) and the best linear, linear log-log or quadratic log-log-log-log relationship was chosen to build the curve. Metabolite concentration for all the samples where then assessed from the area of the working standard solution by extract ion integration.
Statistical analyses
The effects of ‘species’ (fixed), climate change ‘scenario’ (fixed), ‘generation’ (fixed) and their interactions on each life-history trait (growth rate, fecundity, eggs volume), were tested using general linear models (GLM's) with ‘container’ as a random factor nested within ‘temperature’, and ‘aquaria’ as random factor nested within ‘pH/pCO2’. The factor ‘container’ was found to have
a non-significant effect on any of the variable, while ‘aquaria’ had a significant effect only on ‘fecundity’ (minimum F5, 39 = 4.168; p = 0.01). Removing this factor did not change the patterns
of significance of the main factors, thus the ‘aquaria’ effect was considered marginal and it was removed from the analysis (Melatunan et al., 2013). As no random factor were significant, three and two-ways ANOVA analyses were performed to measure the effects of the fixed factors. Body size was used as a covariate for data related to fecundity and egg volume.
Since F1 individuals of the rare species did not survive to reproduce in the high temperature scenarios (OW and OWA), and hence the F2 was not obtained, the analyses of the life-history traits (growth rate, fecundity and egg volume) were run in three different steps:
1) rare vs common species within-generational responses (F1) to all global change drivers, using ‘scenario’ (C, OA, OW, OAW) and ‘species’ (O. robusta, O. japonica) as factors.
2) rare vs common species transgenerational responses (F2) to ocean acidification, using ‘generation’ (F1, F2), ‘scenario’ (C, OA) and ‘species’ (O. robusta, O. japonica) as factors. 3) the common species’ transgenerational responses to all global change drivers, using ‘generation’ (F1, F2) and ‘scenario’ (C, OA, OW, OAW) as factors.
Most of the data did not meet the assumption for normality as raw data, or following log10 or square root transformations, and variances were heterogonous. However, since our experimental design included four scenarios with a minimum of 12 breeding pairs per scenario per generation per species, we assumed that the ANOVA design employed was tolerant to deviation from the assumptions of normality and heteroscedasticity (Sokal & Rohlf 1995; Underwood, 1997). Pairwise comparisons within scenarios, species or generations were performed whenever a significant interaction or main effects were found, using the 95 % confidence interval test calculated for estimated marginal means.
Percentage of survival, number of degeneration events and percentage of pairs producing viable offspring were tested according to step 1) and 2) using a χ2 test.
To explore multivariate patterns of metabolite variation among ‘scenario’ (C, OA, OW, OAW), ‘species’ (O. robusta, O. japonica) and ‘generation’ (F1, F2), a principal component analysis (PCA) based on correlation matrix was run, using the package FactoMineR (Husson et al., 2017). A multivariate variance analysis (MANOVA) was performed using ‘scenario’, ‘species’ and ‘generation’ as fixed factors. Different trials were run to select the one maximizing explication percentage of the variation. All statistical analyses were run with the 3.2.2 R program version and the graphic interface R commander using a significant threshold of α = 0.05 (RStudio Team, 2015).
![Tableau 1 : Mean ± SE of the seawater physic-chemical parameters measured [salinity, temperature, pH NBS , Dissolve Inorganic Carbon (DIC)] and calculated [CO 2 partial pressure (pCO 2 ), Total Alkalinity (TA), carbonate and bicarbonate ion](https://thumb-eu.123doks.com/thumbv2/123doknet/7463770.222228/42.1188.189.988.294.550/parameters-temperature-dissolve-inorganic-calculated-alkalinity-carbonate-bicarbonate.webp)