HAL Id: hal-03210790
https://hal.archives-ouvertes.fr/hal-03210790
Submitted on 30 Apr 2021
HAL is a multi-disciplinary open access
archive for the deposit and dissemination of
sci-entific research documents, whether they are
pub-lished or not. The documents may come from
teaching and research institutions in France or
abroad, or from public or private research centers.
L’archive ouverte pluridisciplinaire HAL, est
destinée au dépôt et à la diffusion de documents
scientifiques de niveau recherche, publiés ou non,
émanant des établissements d’enseignement et de
recherche français ou étrangers, des laboratoires
publics ou privés.
in 21st century simulations with interactive carbon cycle
L. Boysen, V. Brovkin, V. Arora, P. Cadule, N. de Noblet-Ducoudré, E. Kato,
J. Pongratz, V. Gayler
To cite this version:
L. Boysen, V. Brovkin, V. Arora, P. Cadule, N. de Noblet-Ducoudré, et al.. Global and regional
effects of land-use change on climate in 21st century simulations with interactive carbon cycle. Earth
System Dynamics, European Geosciences Union, 2014, 5 (2), pp.309-319. �10.5194/esd-5-309-2014�.
�hal-03210790�
www.earth-syst-dynam.net/5/309/2014/ doi:10.5194/esd-5-309-2014
© Author(s) 2014. CC Attribution 3.0 License.
Global and regional effects of land-use change on
climate in 21st century simulations with interactive
carbon cycle
L. R. Boysen1,*, V. Brovkin1, V. K. Arora2, P. Cadule3, N. de Noblet-Ducoudré3, E. Kato4, J. Pongratz1, and V. Gayler1
1Max Planck Institute for Meteorology, Hamburg, Germany
2Canadian Centre for Climate Modeling and Analysis, Meteorological Service of Canada,
University of Victoria, Victoria, BC, V8W 2Y2, Canada
3Laboratoire des Sciences du Climat et de l’Environnement, Gif-sur-Yvette, France 4National Institute for Environmental Studies, Tsukuba, Japan
*now at: Potsdam Institute for Climate Impact Research, Research Domain 1: Earth System Analysis,
Telegraphenberg A62, 14473 Potsdam, Germany
Correspondence to: L. R. Boysen (lboysen@pik-potsdam.de) Received: 1 March 2014 – Published in Earth Syst. Dynam. Discuss.: 7 April 2014 Revised: 22 August 2014 – Accepted: 22 August 2014 – Published: 30 September 2014
Abstract. Biogeophysical (BGP) and biogeochemical (BGC) effects of land-use and land cover change (LULCC) are separated at the global and regional scales in new interactive CO2simulations for the 21st
cen-tury. Results from four earth system models (ESMs) are analyzed for the future RCP8.5 scenario from simu-lations with and without land-use and land cover change (LULCC), contributing to the Land-Use and Climate, IDentification of robust impacts (LUCID) project. Over the period 2006–2100, LULCC causes the atmospheric CO2concentration to increase by 12, 22, and 66 ppm in CanESM2, MIROC-ESM, and MPI-ESM-LR,
respec-tively. Statistically significant changes in global near-surface temperature are found in three models with a BGC-induced global mean annual warming between 0.07 and 0.23 K. BGP-BGC-induced responses are simulated by three models in areas of intense LULCC of varying sign and magnitude (between −0.47 and 0.10 K). Modifications of the land carbon pool by LULCC are disentangled in accordance with processes that can lead to increases and decreases in this carbon pool. Global land carbon losses due to LULCC are simulated by all models: 218, 57, 35 and 34 Gt C by MPI-ESM-LR, MIROC-ESM, IPSL-CM5A-LR and CanESM2, respectively. On the con-trary, the CO2-fertilization effect caused by elevated atmospheric CO2concentrations due to LULCC leads to
a land carbon gain of 39 Gt C in MPI-ESM-LR and is almost negligible in the other models. A substantial part of the spread in models’ responses to LULCC is attributed to the differences in implementation of LULCC (e.g., whether pastures or crops are simulated explicitly) and the simulation of specific processes. Simple ideal-ized experiments with clear protocols for implementing LULCC in ESMs are needed to increase the understand-ing of model responses and the statistical significance of results, especially when analyzunderstand-ing the regional-scale impacts of LULCC.
1 Introduction
About one-third of the global land surface has already been altered by land-use and land cover changes (LULCC) (Vitousek et al., 1997), primarily through deforestation and replacement of natural vegetation with cropland and pastures (Hurtt et al., 2009; Ellis, 2011). The impacts of past, present and potential future LULCC on climate and the carbon cycle have been addressed in a number of recent studies (Matthews et al., 2004; Brovkin et al., 2004, 2013; Sitch et al., 2005; Shevliakova et al., 2009; Pongratz et al., 2010). The climatic consequences of LULCC can be expressed in terms of its bio-geophysical (BGP) and biogeochemical (BGC) effects. BGP effects account for alterations of physical land surface char-acteristics such as changes in albedo and roughness length, which in turn affect regional boundary layer dynamics and land–atmosphere energy and water exchange. For example, a local cooling may occur due to increased surface albedo and the reduced seasonal snow-masking effect when forests are replaced by cropland in mid- to high latitudes, which leads to an increased albedo due to brighter snow cover (Bonan et al., 1992; Claussen et al., 2001). However, a reduction in latent heat fluxes in tropical regions associated with a sim-ilar change in land cover may result in a warming (Davin and de Noblet Ducoudré, 2010; Brovkin et al., 2009) and decreases in cloud cover (Werth and Avissar, 2002). BGC effects alter the atmospheric greenhouse gas (GHG) com-position, which then affects the climate at the global scale. Over the historical period, LULCC-associated CO2
emis-sions have increased atmospheric CO2concentration by 15–
20 ppm (Matthews et al., 2004; Brovkin et al., 2004; Pon-gratz et al., 2010; Arora and Boer, 2010) and Shevliakova et al. (2013) even estimates a contribution of 43 ppm. The re-sulting global BGC warming effects may counteract regional BGP cooling effects of LULCC but may also intensify local temperature increases, depending on the geographical loca-tion (Pongratz et al., 2011, 2009; Bathiany et al., 2010; Bala et al., 2007). Furthermore, LULCC affects land–atmosphere feedbacks, which are triggered by changes in climate and at-mospheric CO2concentration: the carbon–temperature
feed-back and the carbon–concentration feedfeed-back may act in op-posite directions (Arora et al., 2013). The first one can either be a negative climate feedback due to increased plant produc-tivity or a positive climate feedback as a result of enhanced heterotrophic respiration of soils in a warmer climate (Arneth et al., 2010; Bonan, 2008; Friedlingstein et al., 2006). The second one is a negative climate feedback due to the CO2
-fertilization effect of the vegetation. However, LULCC re-duces the size of the land carbon sink and sources and thus may reduce these climate feedback effects.
The Land-Use and Climate, IDentification of robust pacts (LUCID) project is devoted to the detection of the im-pacts of LULCC on climate. Several studies have found ro-bust climate signals associated with LULCC. Pitman et al. (2009), for example, showed that LULCC can affect latent
and sensible heat fluxes, albedo and near-surface tempera-tures in atmospheric general circulation models (AGCMs) with prescribed SSTs. Pitman et al. (2012) revealed changes in temperature extremes and Van der Molen et al. (2011) em-phasized the latitudinal-dependent importance of cloud feed-backs in the context of climatic consequences of LULCC. Brovkin et al. (2013) found small regional impacts on albedo, available energy, near-surface temperature and land carbon storage by analyzing the output of six earth system model simulations for the 21st century with prescribed CO2
con-centrations. However, large uncertainties remain, both in the sign and magnitude of BGP and BGC effects due to differ-ences in model parameterizations and assumptions regarding the underlying processes. These mechanisms were investi-gated in detail, for example, by Boisier et al. (2012). Reduc-ing the uncertainty associated with BGC and BGP effects of LULCC is one of the challenges for climate and earth sys-tem modelers. Previous LUCID studies focused exclusively on BGP effects of LULCC with the exception of Brovkin et al. (2013), who compared BGP with BGC effects. How-ever, their analysis, relying solely on simulations with pre-scribed CO2, was restricted to changes in land carbon
stor-age and first-order approximations of the consequences for global mean temperature. A consistent multi-model compar-ison of explicitly calculated BGP and BGC effects in terms of relevance for key climate variables is yet missing – a gap to be filled by the present study.
We use simulations for the 21st century following a spec-ified emission-driven scenario called ESMRCP8.5 (Moss et al., 2010), which was carried out by four earth system models participating in the fifth coupled model intercompar-ison project (CMIP5, Taylor et al., 2012). This scenario, pro-vided by the integrated assessment model (IAM) MESSAGE (Riahi et al., 2011), includes spatially explicit LULCC pat-terns, which reflect the expansion of crop and pasture land required to meet the increasing food demand of a grow-ing world population. This scenario yields a total anthro-pogenic radiative forcing of about 8.5 W m−2 in 2100. For the contribution to the LUCID project, the four climate mod-eling groups performed two additional ESMRCP8.5 simu-lations in which land cover was held constant at its year 2005 state, once with CO2 concentrations calculated
inter-actively and once with prescribed CO2concentrations from
the ESMRCP8.5 simulation (see Table 1). This new approach uses the differences between the standard ESMRCP8.5 and the additional simulations to directly quantify the climatic consequences of regional BGP effects in comparison to the global BGC effects of LULCC on future climate. Thereby, we can also analyze the effect of interactively calculated CO2 concentrations on land carbon pools and their
contri-bution to temperature changes in contrast to estimated tem-perature changes from land carbon losses as it is usually done (Brovkin et al., 2013; Gillett et al., 2013). Finally, we identify major uncertainties arising in this multi-model approach.
Table 1.Overview of CMIP5 and LUCID simulations based on CMIP5 standard simulations for RCP8.5 and the employed terminology exemplified with near-surface temperature T .
Simulation Terminology CO2concentration LULCC ESM TeCO2
LULCC Interactive As in RCP
(emission-driven)
L1B Tno LULCCeCO2 Interactive Fixed to the year 2005 L1A Tno LULCCcCO2 Prescribed Fixed to the year 2005
(concentration-driven, output of the ESM run) RCP TcCO2RCP
LULCC Prescribed from RCP8.5 Transient scenario
(Moss et al., 2010) (MESSAGE, Riahi et al., 2011) (Hurtt et al., 2011)
L2A TcCO2RCP
no LULCC As in RCP Fixed to the year 2005
2 Methods
Results from the ESMRCP8.5 simulations are used from four ESMs: MPI-ESM-LR (Giorgetta et al., 2013; Reick et al., 2013), MIROC-ESM (Watanabe et al., 2011), IPSL-CM5A-LR (Dufresne et al., 2013) and CanESM2 (Arora et al., 2011). Hereafter, the models are referred to as the MPI, MIR, IPSL and CAN model, respectively. For the year 2006, MPI, MIR and CAN simulate 375, 387, and 386 ppm, respectively (no values for IPSL available), which compare well with the observed value of 382 ppm (Keeling et al., 2009) and close to the prescribed CO2 concentration of RCP8.5 with
377 ppm (for detailed benchmarking of these models, see Anav et al., 2013). The impacts of LULCC on climate and land–atmosphere fluxes of carbon are examined by differenc-ing model simulations with and without LULCC. To distin-guish BGP and BGC effects, three simulation setups between the years 2006 and 2100 are used (Table 1): ESMRCP8.5 in-cludes all RCP8.5 forcings with CO2 freely exchanged
be-tween the land, the ocean and the atmosphere components (i.e., CO2is simulated interactively; hereafter ESM
simula-tion and TeCO2
LULCCfor resulting near-surface temperatures and
CeCO2
LULCCfor simulated land carbon content in year 2100). The
L1A simulation uses land cover corresponding to the year 2005 and prescribes atmospheric CO2 concentration taken
from the ESM simulation (TcCO2
no LULCC and C
cCO2
no LULCC). The
L1B simulations also neglect LULCC but CO2 is
interac-tively simulated (TeCO2
no LULCC and C
eCO2
no LULCC). In general, the
same terminology holds for the land carbon content C; how-ever, changes in carbon pools due to BGP effects of LULCC are not separated by the ESM-L1A difference from the di-rect LULCC effects (deforestation, replacement of natural vegetation and regrowth), and are thus labeled 1C1LULCC.
The difference between the ESM and L1A simulations there-fore yields the biogeophysical effects of LULCC on climate
(1TBGP), whereas the difference between the L1A and L1B
simulations yields the biogeochemical effects of LULCC on climate (1TBGC). Finally, the difference between ESM and
L1B simulations yields the net effect of LULCC on climate (1Tnet), including all feedbacks (Table 2).
Additionally, BGP effects in our simulations with interac-tively simulated CO2are compared to BGP effects in
simula-tions with prescribed CO2concentrations calculated from the
difference of RCP8.5 and L2A simulations (hereafter, RCP simulation and 1TBGPRCP) with prescribed CO2concentrations
(Brovkin et al., 2013).
The land-use change information was adapted from the land-use harmonization project by Hurtt et al. (2011). Al-though common land-use information were provided to all modeling groups, vegetation dynamics, land surface schemes and parameterizations differ substantially among the mod-els leading to different changes in vegetation cover (Fig. S1 in the Supplement). MPI and MIR, for example, simulate LULCC patterns based on annual fractional changes given by a transition matrix (“gross LULCC transitions”), whereas CAN and IPSL only simulate annual LULCC state maps for each grid cell (“net transitions”). Details about participating models can be found in Fig. S1 and Table S1 in the Supple-ment as well as in Brovkin et al. (2013). It needs to be noted that none of the participating models simulated plant growth with respect to nitrogen and phosphorus limitation and thus, land carbon uptakes by the biosphere and LULCC emissions might be overestimated (Goll et al., 2012).
Statistical methods were applied to test the significance of results. The modified Student’s t test was used, which accounts for temporal autocorrelation (Zwiers et al., 1995; Findell et al., 2006) and removes linear trends for the aver-aging period 2071–2100 caused by a strong CO2forcing. In
the case of CAN, the average over three ensemble members is calculated. Since CAN did not perform L1A runs, BGP
Table 2.Overview of model setups and analysis strategies.
Difference Setup differences Terminology/scientific interpretation BGP effects:
ESM-L1A same CO2concentration; 1T (1LULCC, 1CO2= 0) = 1TBGP,
with-without LULCC 1C(1LULCC, 1CO2= 0) = 1C1LULCC
BGC effects:
L1A-L1B different CO2concentrations; 1T (1LULCC = 0, 1CO2)= 1TBGC,
both without LULCC 1C(1LULCC = 0, 1CO2) = 1CBGC
net effects:
ESM-L1B different CO2concentrations; 1T (1LULCC, 1CO2) = 1Tnet,
with-without LULCC 1C(1LULCC, 1CO2) = 1Cnet
Table 3.Atmospheric CO2(ppm) concentrations in 2100.
Model CO2 LULCC CO2 no LULCC 1CO2 1LULCC
MPI 951 885 66
CAN 1037 1024 12
MIR 1134 1113 22
MESSAGE 926
effects were estimated by the difference of RCP and L2A simulations for this model from Brovkin et al. (2013).
3 Results and discussion
3.1 Effects of LULCC on the atmospheric CO2 concentration and on near-surface temperatures 3.1.1 Changes in atmospheric CO2concentrations
The exchange of carbon between the land and the atmosphere via plant and soil processes is modified by LULCC, which thus affects atmospheric CO2 concentrations. CO2
concen-trations for interactive CO2 simulations with and without
LULCC are listed in Table 3 for MPI, CAN and MIR for the year 2100 (no data available for IPSL). All models show higher CO2 concentrations in the ESM simulations at 2100
(951 to 1134 ppm) than the MESSAGE model (926 ppm), upon which the RCP scenario is based. This is likely due to the underestimation of feedback mechanisms in IAMs rel-ative to earth system models (Jones et al., 2013). The con-tribution of LULCC emissions is given by the difference be-tween simulations with and without LULCC (CO2 1LULCC)
(Table 3; transient evolution of changes in Fig. S2 in the Supplement). It is greatest for MPI and smallest for CAN, which is also reflected and discussed in the changes of land carbon stocks in Sect. 3.3. Carbon emissions from LULCC enhance atmospheric CO2concentration above those due to
fossil-fuel emissions by 7 % in MPI, compared to only 1 and 2 % in CAN and MIR, respectively.
Table 4.1TBGPand 1TBGC(K), averaged over the period 2071–
2100: globally and over areas where LULCC ≥ 10 % of the grid cell. The asterisk (∗) marks values with statistical significance (≥ 95 %) of a Student’s t test accounting for autocorrelation. The tempera-ture change over the 21st relative to 2006 century due to fossil fuel forcings only is given by 1TeCO2
no LULCC(L1B simulation).
1TeCO2
no LULCC 1TBGC 1TBGP 1TBGP
Model Global Global LULCC ≥ 10 %
MPI 3.02 0.23∗ 0.02 0.03 CAN∗∗ 3.60 0.07∗ 0.02 0.10∗ MIR 4.73 0.12∗ −0.01 −0.47∗ IPSL 3.70 −0.02 −0.03 −0.16∗ ∗∗The BGP part in CAN is calculated as 1TRCP
BGP.
3.1.2 Biogeochemical effects on climate
Changes in the atmospheric GHG composition due to LULCC affect climate on the global scale. Global mean near-surface temperatures increase in all simulations until year 2100 whereas MIR is the most sensitive model to rising GHG concentrations (see Fig. S3a in the Supplement). On a global average over the years 2071 to 2100, statistically significant increases in 1TBGC associated with LULCC are found in
MPI (0.23 K), MIR (0.12 K) and CAN (0.07 K) (Table 4). LULCC emissions enhance the BGC warming associated with fossil-fuel emissions in a statistically significant manner by 8, 3 and 2 %, respectively (Table 4, first column). Maps of BGC effects for each model (Fig. 1b) show the widespread warming pattern of a well-mixed GHG, where the most pro-nounced temperature increases are found in polar regions due to the sea ice albedo feedback as well as temperature feedbacks (Pithan and Mauritsen, 2014), which contribute to the polar amplification. On land the warming patterns differ among the models as the greenhouse effect of CO2 is not
homogeneously distributed. The modification of local BGC-induced temperature change leads, for example, to a small warming in all models in Australia (Fig. 1b).
Figure 1.Maps displaying the change in near-surface temperature (K) averaged over 2071–2100 for each model. Only areas are shown where changes are statistically significant; (a) 1TBGP(for CAN 1TBGPRCP); (b) 1TBGC(for CAN 1Tnet−1TBGPRCP); (c) 1Tnet.
3.1.3 Biogeophysical effects on climate
LULCC modifies the physical properties of the land surface which then affect near-surface climate, mainly on the local to regional scale. The model spread in 1TBGP signals is wide
in the global mean and no statistical significance is detected (Table 4). This agrees with previous model intercomparisons of BGP effects of LULCC for historical times (e.g., Pitman et al., 2009); however, results must be expected to be less ro-bust in our study due to the chosen scenario of LULCC. In the underlying RCP8.5 scenario, the area undergoing LULCC is relatively small and is mainly located in the tropics. In the past, LULCC mainly took place in the mid- to high latitudes, where a clear BGP signal was identified caused by albedo in-crease related to the seasonal snow-masking effect of trees. In the tropics however, changes in albedo are less dominant and may counteract in their effect on temperatures by changes in other BGP properties such as the latent heat fluxes.
Here, the importance of LULCC implementation and its link to land–atmosphere processes in the models becomes
visible when linking LULCC patterns (Fig. S1 in the Sup-plement) with spatial 1TBGP responses in Fig. 1a.
Conver-sions of forests (or shrubs as in Australia) to pasture areas (as dynamically implemented by MIR and MPI in Africa, South America and Australia) or grasslands (simulated in IPSL in Australia and South America) lead to BGP-induced cooling. For two models, MIR and IPSL, this BGP effect in Australia (cooling caused by e.g., the simulated increase in albedo) dominates over the warming due to the above-mentioned BGC effect in this region. CAN neglects pastures and thus only changes in cropland extent lead to a conversion of forested areas and natural grasslands. Latent heat fluxes are reduced over crop areas, leading to a warming which overcompensates the cooling effect of increased albedo over these areas in tropical regions. While this holds for all mod-els in South America and Africa, IPSL simulates a cooling in those regions. This is rather untypical for IPSL, as previous studies with this model (e.g., Davin and de Noblet Ducoudré, 2010) showed that the impact of LULCC on
evapotranspira-tion dominates the total BGP response to LULCC in tropical regions. Note that the IPSL model also showed warming in the extratropics, due to particular assumptions in the season-ality of the leaf area index (LAI) for crops (Pitman et al., 2009). BGP warming is found over North America in MIR and IPSL where pastures (grassland in the latter model) and crops are abandoned for the regrowth of natural grassland and trees. This in turn not only directly decreases surface albedo but also increases the snow-masking effect in period-ically snow-covered regions. This effect is also responsible for the observed warming in high northern latitudes of Eura-sia, where the tree line shifts northward in a warmer climate in the dynamically simulated vegetation patterns of MPI and MIR.
However, there are more diverse temperature responses shown in Fig. 1 which cannot directly be linked to LULCC. Taking therefore only areas of intense LULCC (here defined as grid cells in which the area of LULCC equals or exceeds 10 % in 2100 compared to 2006) into account, results in sta-tistically significant changes in three models (Table 4, see Fig. S3b in the Supplement): CAN, which neglects pastures, simulates a warming of 0.1 K (this value is based on results from Brovkin et al., 2013, as mentioned earlier in Sect. 2), whereas IPSL and MIR show a BGP cooling of 0.16 and 0.47 K, respectively. The prescribed CO2 simulations
ana-lyzed by Brovkin et al. (2013) yield a BGP cooling effect of 0.23 K for MIR. The stronger decrease in our analysis’ near-surface temperature for MIR model is mainly attributed to enhanced changes in South America, Africa and Australia, which can partly be connected to changes in latent heat fluxes (not shown). BGP cooling can therefore dampen or dominate the net effect on near-surface temperature in specific regions (and not coherently across the models, see Fig. 1c).
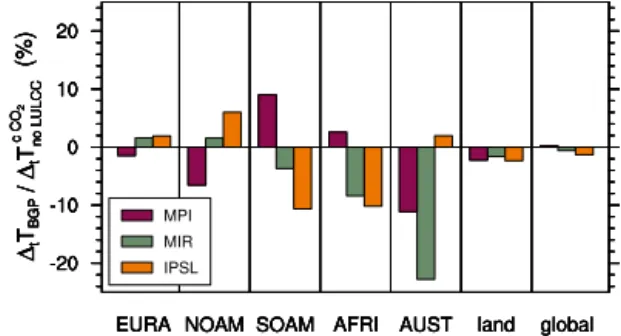
3.1.4 Role of LULCC in affecting regional climate
Here, we investigate whether BGP effects (1tTBGP) can
mit-igate or rather enhance climate impacts caused by fossil and LULCC emissions alone (L1A simulation, 1tTno LULCCcCO2 )
on the continental scale, where 1t means a difference
be-tween values averaged over the period 2071 to 2100 and the year 2006. Figure 2a illustrates the percentage impact of
1tTBGP/1tTno LULCCcCO2 . Values are listed in Table S2 in the
Supplement. Since CAN did not perform the 1tTno LULCCcCO2
simulation it is not considered here. Overall, the models show inconsistent signs and magnitudes of how the BGP ef-fects influence 1tTno LULCCcCO2 . However, the analysis shows
that for the global land area the models coherently simulate a reduction of the fossil-fuel and LULCC emission-driven temperature increase (1tTno LULCCcCO2 ) by 2 % (0.1 K).
Further-more, MPI and MIR simulate the strongest (and statistically significant) potential of warming mitigation over Australia with −11 and −23 %. This emphasizes the importance of in-cluding pastures in the model simulations and the currently
Figure 2.Relative changes in near-surface temperature: compari-son of 1tTBGPrelative to 1tTno LULCCcCO2 (L1A simulation), that is the BGP impacts of LULCC compared to the impacts of anthro-pogenic carbon emissions (both fossil-fuel and LULCC) on near-surface temperature (in %). Depicted are mean 2071–2100 values minus the 2006 state (indicated by “1t”). Positive (negative) values indicate that BGP effects (1tTBGP) enhance (dampen) the change
caused by LULCC and other anthropogenic emissions. Analysis is done for the following regions: Eurasia (EURA), North Amer-ica (NOAM), South AmerAmer-ica (SOAM), AfrAmer-ica (AFRI), Australia (AUST), land (land area excluding ice sheets) and global (total area on earth). A list of exact values can be found in Table S2 in the Supplement.
large role of pasture implementation as a source of uncer-tainty in simulating the LULCC effects on climate. Unlike those models that represent pastures as specific vegetation type, CAN, which neglects the representation of pastures, and IPSL, which does not consider the distinction between grasslands and pastures, do not show significant changes (for more detailed model descriptions see Table S1 in the Supple-ment). Similarly, LULCC changes described in Sect. 3.1.3 are strong enough to counteract the warming caused by fossil and LULCC emissions in Africa in MIR and IPSL (−8 and
−10 %, respectively) but not in MPI with an insignificant warming signal of crops. Model responses are again uncer-tain and it is therefore difficult to link LULCC to adapta-tion or mitigaadapta-tion strategies, such as done by Pongratz et al. (2011), who analyzed the impact of reforestation.
3.2 Evaluation of the TRCE approach
Gillett et al. (2013) calculated the so-called transient re-sponse to cumulative emissions, TRCE, as the ratio of how global mean temperature changes in response to the cumu-lative increase of CO2 in the atmosphere by 1 % per year
until a doubling is reached. The TRCE for the participat-ing models (in K Tg C−1) is given in Table 5 (after Gillett
et al., 2013). MPI and IPSL have a very similar low TRCE while CAN has the highest TRCE. By multiplying the TRCE with the loss of land carbon due to LULCC in 2100 found in each model, equivalent changes in near-surface temperature (1TTRCE) can be estimated. Note that the conversion factor
from atmospheric CO2concentration to atmospheric carbon
Table 5.Comparison of simulated 1TBGC(as in Table 4) to temperature changes derived from the TRCE approach (transient response of
temperature to cumulative emissions; 1TTRCE Gillett et al., 2013). LULCC emissions are derived from the losses in land carbon storage
(1C1LULCC) multiplied by the TRCE values from Gillett et al. (2013) to approximate temperature changes. Results for RCP simulations
(≈ 1TTRCERCP ) are taken from Brovkin et al. (2013). The asterisk (∗) marks values of statistical significance (p < 0.05). 1TBGC TRCE 1C1aLULCC ≈1TTRCE 1CRCP b1LULCC ≈1TTRCERCP b
Model (K) (◦K Tt C−1) (GtC) (K) (GtC) (K)
MPI 0.23∗ 1.604 218 0.35 205 0.33
CAN 0.07∗ 2.365 34 0.08 34 0.08
MIR 0.12∗ 2.151 57 0.12 62 0.13
IPSL −0.02 1.585 31 0.06 37 0.06
aChanges for CAN are calculated indirectly by 1T
net−1TBGPRCP.
bBrovkin et al. (2013).
that quantify 1TBGCinteractively now allows us to evaluate
the TRCE-approximation used by Brovkin et al. (2013) for prescribed CO2concentrations.
Results applying the TRCE-approximation for interactive and prescribed CO2 simulations yield very similar results.
For MIR, 1TTRCE agrees well with the interactively
simu-lated temperature change 1TBGC(Table 4), and in CAN the
TRCE estimate is only 0.01 K too high.
However, larger differences as found in MPI and IPSL hint to the relevance of effects other than the direct effects of LULCC emissions. The TRCE approach quantifies the cli-mate response to cumulative carbon emissions before any BGP- or BGC-induced feedbacks occur but which are sub-stantial for LULCC impacts (e.g., altered albedo). This linear approach therefore only captures results well in the absence of significant non-linearities in the models. Furthermore, we compared the instantaneous TRCE results to 30-year mean values which eliminate inter-annual variabilities. Overall, the TRCE approach serves as a good first estimate of the mag-nitude and direction of changes in near-surface temperatures due to LULCC emissions, but sensitivity analysis is needed for each model response.
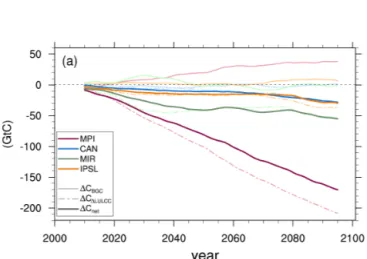
3.3 Contribution of changes in land carbon storage
The modification of the land carbon sinks and sources via LULCC is responsible for the observed changes in the at-mospheric CO2concentration (Table 3), resulting climate
ef-fects. The effect of LULCC on the land carbon stocks is shown in Fig. 3. All models simulate land carbon losses due to LULCC (1Cnet, dark solid lines) whereby the
dom-inant carbon loss is mainly attributed to the deforestation (1C1LULCC, light dashed lines) of carbon-rich tropical forest
(see Fig. S1 in the Supplement). In the extra-tropics, defor-estation is less prevalent and the replacement of abandoned pastures by grasslands has almost no effect, because both are treated the same way in most models. The MPI model yields the strongest carbon loss of 218 Gt C in 2100 (Table 6,
1C1LULCC), which is partly attributed to its overestimation
of initial carbon stocks in the tropics and drylands (Brovkin
Figure 3.The 10-year running global means of net changes due to LULCC in the terrestrial carbon content (in GtC). Dark solid lines represent 1Cnet, dashed lines 1C1LULCCand light solid lines
1CBGC.
et al., 2013). The second largest decrease in land carbon in response to LULCC is found in MIR with 57 Gt C. This is consistent with recent simulations, showing that the net land-use change flux is substantially larger when gross transitions are accounted for in addition to net (see also Hurtt et al., 2011; Wilkenskjeld et al., 2014; Stocker et al., 2014) like in MPI and MIR (see S1 in the Supplement). The reason is that cyclic conversions in fractional land cover might not be seen in the resulting vegetation distribution, but lead to modified distributions of carbon among the reservoirs.
The increase in atmospheric CO2concentration and
near-surface temperature following LULCC emissions affects land carbon storage differently across the models (1CBGC,
light solid lines). The carbon gain due to CO2-fertilization
caused by LULCC emissions is strongest in MPI with 40 Gt C and is almost negligible in the other models with
−3 to 4 Gt C. This probably explains the stronger dif-ference in MPI to simulations with prescribed CO2
con-centration (Table 6, 1C1LULCCRCP). Global mean annual
atmosphere-to-land carbon fluxes reveal an increase until mid-century in all models and all simulations (see Fig. S4
Table 6.Global changes in cumulative land carbon fluxes 1C (cu-mulative from 2006 until 2100 in GtC) in 2100 due to the various effects of LULCC: changes in vegetation distribution and climate (1C1LULCC), net effect (1Cnet), and BGC effects (1CBGC).
Model Simulation-index 1C 1CRCP b MPI 1LULCC −218 −205 net −179 BGC 39 CANa 1LULCC −34 −34 net −29 BGC 4 MIR 1LULCC −57 −62 net −56 BGC 2 IPSL 1LULCC −35 −37 net −38 BGC −3
aChanges for CAN are calculated indirectly by 1T
net−1TBGPRCP.
bBrovkin et al. (2013).
in the Supplement). Around mid-century, the increasing res-piration in a warmer climate reduces and more than over-compensates the enhanced carbon uptake associated with the CO2-fertilization effect, especially in MIR. The
behav-ior of the MIR is consistent with the findings in Arora et al. (2013) who showed that the carbon–temperature feedback is strongest in the MIR.
The representation of modified land carbon sinks and sources by LULCC vary across the ESMs leading to the wide spread in carbon pool signals. The modeling groups used common land-use data sets and handled indirect effects co-herently following the LUCID protocol so that only ences in simulated climate remain. However, intrinsic differ-ences across the models remain, such as the explicit simula-tion of some carbon-cycle-related processes (e.g., the repre-sentation of crops in CAN), and the neglect or parameteri-zation of other processes (e.g., crops in MPI). One example is the simulation of fire emissions that was done by MPI and IPSL (see Fig. S5 in the Supplement). Interestingly, they both show that fire emissions are reduced by increased land man-agement, which would otherwise increase much stronger in a warmer climate. Following Houghton et al. (2012), these as-pects cause uncertainties in modeling carbon emissions from LULCC in the order of ±50 %.
4 Conclusions
BGP and BGC impacts of LULCC on near-surface tempera-tures and land carbon pools are separated by using CMIP5-LUCID simulations with interactive CO2 from four earth
system models. These results show that the BGP effect in
the RCP scenario causes no statistically significant change in the globally averaged near-surface temperature averaged over the period 2071–2100. This is the consequence of rel-atively small changes in land cover over the 2006–2100 pe-riod compared to that over the historical pepe-riod. One further reason is the fact that over the 21st century LULCC primar-ily takes place in (sub)tropical regions where changes in la-tent heat fluxes have more impact than changes in albedo, which are more effective in seasonally snow-covered re-gions. However, averaged over regions of intense LULCC (i.e., when LULCC impacts ≥ 10 % of a grid cell over the 2006–2100 period), three models simulate statistically sig-nificant changes of varying sign and magnitude (between 0.1 and −0.47 K). BGC effects of LULCC lead to statisti-cally significant increases in global mean near-surface tem-peratures of 0.07, 0.12 and 0.23 K following increases in at-mospheric CO2from LULCC emissions between 12, 22 and
66 ppm in CAN, MIR and MPI, respectively. The model spread is attributed to differences in modeling assumptions, parameterizations and included processes (e.g., fire), which lead to different manners in which the common LULCC pat-tern is implemented across models (e.g., with and without pastures) and induce a degree of uncertainty.
The BGP effects of LULCC may enhance or dampen its BGC effects. For example, in South America and Africa, MIR and IPSL both show that BGP effects dampen and, in the case of MPI, enhance BGC warming caused by land-use change and fossil-fuel emissions. A causal link between LULCC forcing and the climate impact is found for MIR, where the presence of pastures in Europe and Australia tends to induce a local BGP cooling which offsets a BGC warming. Crops tend to warm climate in most areas and models. This is especially the case in CAN, which is the only model that sim-ulates an overall BGP warming in the absence of pasture rep-resentation. Conversion to pastures thus may have a climate change mitigation potential but more detailed and idealized experiments are required e.g., simulations with and without pasture cultivation in each model.
The approach of the transient response to cumulative emis-sions in 2100, TRCE (Gillett et al., 2013) captures the changes in temperature well for CAN and MIR but is less precise for MPI and IPSL. Therefore, TRCE serves as a good first estimate but since it is a linear approach it is less reliable in case of non-linearities and strong variability in the models. LULCC leads to carbon release from the land to the at-mosphere. Accounting for gross LULCC transitions in both MPI and MIR results in stronger LULCC emissions than in the other two models. The global effect of CO2-fertilization
due to LULCC is strong for MPI with 39 Gt C in 2100 and almost negligible in the other models.
Land-use change emissions are inherently uncertain. When implemented in ESMs, the diagnosed BGP and BGC effects of LULCC are even more uncertain because of the manner in which land-use change is interpreted and im-plemented across models. The BGC effects of LULCC are
related to how the deforested biomass is treated, whether or not transitions across land cover types are considered and how natural vegetation regrows after croplands/pastures are abandoned. All these factors determine the net LULCC emis-sions and thus the change in atmospheric CO2concentration.
The BGP effects of LULCC are related to how changes in the physical appearance of the land surface affect the en-ergy and water balance through changes in albedo, rough-ness length and other physical structural attributes of vege-tation. Since models differ greatly in treating BGP and BGC effects of LULCC, the same LULCC pattern can yield dif-ferences in magnitude and even sign of the net effect. Simple idealized experiments with clear experimental protocols are needed, for example, to make actual simulated land-use pat-terns more comparable by coherently implementing or ne-glecting pastures. This would provide a better understand-ing of why models respond differently to the same LULCC forcing and thus help reduce uncertainty in the net effect of LULCC across models. Last but not least, some of the uncer-tainty could be eliminated by having several ensemble mem-bers, which would make statistical significance testing more robust.
The Supplement related to this article is available online at doi:10.5194/esd-5-309-2014-supplement.
Acknowledgements. We acknowledge the World Climate Re-search Programme’s Working Group on Coupled Modelling, which is responsible for CMIP, and we thank the climate modeling groups for producing and making available their model output. We thank Karl Taylor and Charles Doutriaux for help with setting up the CMOR tables for the LUCID-CMIP5 experiments. We appreciate the support by the staff of the German Climate Computing Center (DKRZ), in particular by Stephanie Legutke and Estanislao Gonza-lez, in performing the LUCID-CMIP5 simulations and in making the model results available via DKRZ ESG gateway.
The service charges for this open access publication have been covered by the Max Planck Society. Edited by: L. Ganzeveld
References
Anav, A., Friedlingstein, P., Kidston, M., Bopp, L., Ciais, P., Cox, P., Jones, C., Jung, M., Myneni, R., and Zhu, Z.: Evalu-ating the land and ocean components of the global carbon cycle in the CMIP5 Earth System Models, J. Climate, 26, 6801–6843, doi:10.1175/JCLI-D-12-00417.1, 2013.
Arneth, A., Harrison, S. P., Zaehle, S., Tsigaridis, K., Menon, S., Bartlein, P. J., Feichter, J., Korhola, A., Kulmala, M., O’Donnell, D., Schurgers, G., Sorvari, S., and Vesala, T.: Terrestrial biogeo-chemical feedbacks in the climate system, Nat. Geosci., 3, 525– 532, 2010.
Arora, V. and Boer, G.: Uncertainties in the 20th century carbon budget associated with land use change, Global Change Biol., 16, 3327–3348, 2010.
Arora, V. K., Scinocca, J., Boer, G., Christian, J., Denman, K., Flato, G., Kharin, V., Lee, W., and Merryfield, W.: Carbon emis-sion limits required to satisfy future representative concentration pathways of greenhouse gases, Geophys. Res. Lett., 38, L05805, doi:10.1029/2010GL046270, 2011.
Arora, V. K., Boer, G. J., Christian, J. R., Bopp, L., Brovkin, V., Eby, M., Friedlingstein, P., Ilyina, T., Jones, C. D., Hajima, T., Tjiputra, J. F., and Wu, T.: Carbon-concentration and carbon-temperature feedbacks in CMIP5 Earth system models, J. Cli-mate, 26, 5289–5314, doi:10.1175/JCLI-D-12-00494.1, 2013. Bala, G., Caldeira, K., Wickett, M., Phillips, T., Lobell, D.,
Delire, C., and Mirin, A.: Combined climate and carbon-cycle effects of large-scale deforestation, P. Natl. Acad. Sci. USA, 104, 6550–6555, doi:10.1073/pnas.0608998104, 2007.
Bathiany, S., Claussen, M., Brovkin, V., Raddatz, T., and Gayler, V.: Combined biogeophysical and biogeochemical effects of large-scale forest cover changes in the MPI earth system model, Bio-geosciences, 7, 1383–1399, doi:10.5194/bg-7-1383-2010, 2010. Boisier, J., de Noblet Ducoudré, N., Pitman, A., Cruz, F., Delire, C., van den Hurk, B., van der Molen, M., Müller, C., and Voldoire, A.: Attributing the impacts of land-cover changes in temperate regions on surface temperature and heat fluxes to spe-cific causes: results from the first LUCID set of simulations, J. Geophys. Res., 117, D12116, doi:10.1029/2011JD017106, 2012. Bonan, G.: Forests and climate change: forcings, feedbacks, and the
climate benefits of forests, Science, 320, 1444–1449, 2008. Bonan, G., Pollard, D., and Thompson, S.: Effects of boreal forest
vegetation on global climate, Nature, 359, 716–718, 1992. Brovkin, V., Sitch, S., Von Bloh, W., Claussen, M., Bauer, E., and
Cramer, W.: Role of land cover changes for atmospheric CO2
increase and climate change during the last 150 years, Global Change Biol., 10, 1253–1266, 2004.
Brovkin, V., Raddatz, T., Reick, C., Claussen, M., and Gayler, V.: Global biogeophysical interactions between forest and climate, Geophys. Res. Lett., 36, L07405, doi:10.1029/2009GL037543, 2009.
Brovkin, V., Boysen, L., Arora, V., Boisier, J., Cadule, P., Chini, L., Claussen, M., Friedlingstein, P., Gayler, V., van den Hurk, B., Hurtt, G., Jones, C., Kato, E., de Noblet Ducoudré, N., Paci-fico, F., Pongratz, J., and Weiss, M.: Effect of anthropogenic land-use and land cover changes on climate and land carbon stor-age in CMIP5 projections for the 21st century, J. Climate, 26, 6859–6881, doi:10.1175/JCLI-D-12-00623.1, 2013.
Claussen, M., Brovkin, V., and Ganopolski, A.: Biogeophysical vs. biogeochemical feedbacks of large-scale land cover change, Geophys. Res. Lett., 28, 1011–1014, 2001.
Davin, E. and de Noblet Ducoudré, N.: Climatic impact of global-scale deforestation: radiative vs. nonradiative processes, J. Cli-mate, 23, 97–112, 2010.
Dufresne, J.-L., Foujols, M.-A., Denvil, S., Caubel, A., Marti, O., Aumont, O., Balkanski, Y., Bekki, S., Bellenger, H., Benshila, R., Bony, S., Bopp, L., Braconnot, P., Brockmann, P., Cadule, P., Cheruy, F., Codron, F., Cozic, A., Cugnet, D., de Noblet, N., Duvel, J.-P., Ethe, C., Fairhead, L., Fichefet, T., Flavoni, S., Friedlingstein, P., Grandpeix, J.-Y., Guez, L., Guilyardi, E., Hauglustaine, D., Hourdin, F., Idelkadi, A., Ghattas, J., Jous-saume, S., Kageyama, M., Krinner, G., Labetoulle, S., Lahel-lec, A., Lefebvre, M.-P., Lefevre, F., Levy, C., Li, Z. X., Lloyd, J., Lott, F., Madec, G., Mancip, M., Marchand, M., Masson, S., Meurdesoif, Y., Mignot, J., Musat, I., Parouty, S., Polcher, J., Rio, C., Schulz, M., Swingedouw, D., Szopa, S., Talandier, C., Terray, P., Viovy, N., and Vuichard, N.: Climate change projections us-ing the IPSL-CM5 Earth System Model: from CMIP3 to CMIP5, Clim. Dynam., 40, 1–43, 2013.
Ellis, E.: Anthropogenic transformation of the terrestrial biosphere, Philos. T. Roy. Soc. A, 369, 1010–1035, 2011.
Findell, K. L., Knutson, T. R., and Milly, P.: Weak simulated extra-tropical responses to complete extra-tropical deforestation, J. Climate, 19, 2835–2850, 2006.
Friedlingstein, P., Cox, P., Betts, R., Bopp, L., Von Bloh, W., Brovkin, V., Cadule, P., Doney, S., Eby, M., Fung, I., Bala, G., John, J., Jones, C., Joos, F., Kato, T., Kawamiya, M., Knorr, W., Lindsay, K., Matthews, H. D., Raddatz, T., Rayner, P., Reick, C., Roeckner, E., Schnitzler, K.-G., Schnur, R., Strassmann, K., Weaver, A. J., Yoshikawa, C., and Zeng, N.: Climate-carbon cy-cle feedback analysis: results from the C4MIP model intercom-parison, J. Climate, 19, 3337–3353, 2006.
Gillett, N., Arora, V., Matthews, D., and Allen, M.: Constrain-ing the ratio of global warmConstrain-ing to cumulative CO2
emis-sions using CMIP5 simulations, J. Climate, 26, 6844–6858, doi:10.1175/JCLI-D-12-00476.1, 2013.
Giorgetta, M. A., Jungclaus, J., Reick, C. H., Legutke, S., Bader, J., Böttinger, M., Brovkin, Vi., Crueger, T., Esch, M., Fieg, K., Glushak, K., Gayler, V., Haak, H., Hollweg, H.-D., Ilyina, T., Kinne, S., Kornblueh, L., Matei, D., Mauritsen, T., Mikolajew-icz, U., Mueller, W., Notz, D., Pithan, F., Raddatz, T., Rast, S., Redler, R., Roeckner, E., Schmidt, H., Schnur, R., Segschnei-der, J., Six, K. D., Stockhause, M., Timmreck, C., Wegner, J., Widmann, H., Wieners, K.-H., Claussen, M., Marotzke, J., and Stevens, B.: Climate and carbon cycle changes from 1850 to 2100 in MPI-ESM simulations for the Coupled Model Intercom-parison Project phase 5, J. Adv. Model. Earth Syst., 5, 572–597, doi:10.1002/jame.20038, 2013.
Goll, D. S., Brovkin, V., Parida, B. R., Reick, C. H., Kattge, J., Re-ich, P. B., van Bodegom, P. M., and Niinemets, Ü.: Nutrient lim-itation reduces land carbon uptake in simulations with a model of combined carbon, nitrogen and phosphorus cycling, Biogeo-sciences, 9, 3547–3569, doi:10.5194/bg-9-3547-2012, 2012.
Houghton, R. A., House, J. I., Pongratz, J., van der Werf, G. R., De-Fries, R. S., Hansen, M. C., Le Quéré, C., and Ramankutty, N.: Carbon emissions from land use and land-cover change, Biogeo-sciences, 9, 5125-5142, doi:10.5194/bg-9-5125-2012, 2012. Hurtt, G. C., Chini, L. P., Frolking, S., Betts, R., Feddema, J.,
Fis-cher, G., Goldewijk, K. K., Hibbard, K., Janetos, A., Jones, C., Kindermann, G., Kinoshita, T., Riahi, K., Shevliakova, E., Smith, S., Stehfest, E., Thomson, A., Thornton, P., van Vuuren, D., and Wang, Y. P.: Harmonization of Global Land Use Scenarios for the Period 1500–2100 for IPCC AR5, Integrated Land Ecosys-tem Atmosphere Processes Study (iLEAPS) Newsletter, iLEAPS Newsletter, iLEAPS International Project Office, University of Helsinki, http://www.ileaps.org/sites/ileaps.org/files/newsletters/ NL7_9MB.pdf, last access: 3 April 2014, 6–8, 2009.
Hurtt, G. C., Chini, L. P., Frolking, S., Betts, R. A., Feddema, J., Fischer, G., Fisk, J. P., Hibbard, K., Houghton, R. A., Janetos, A., Jones, C., Kindermann, G., Kinoshita, T., Klein Goldewijk, K., Riahi, K., Shevliakova, E., Smith, S., Stehfest, E., Thomson, A., Thornton, P., van Vuuren, D. P., and Wang, Y. P.: Harmoniza-tion of land-use scenarios for the period 1500–2100: 600 years of global gridded annual land-use transitions, wood harvest, and resulting secondary lands, Climatic Change, 109, 1–45, 2011. Jones, C., Robertson, E., Arora, V., Friedlingstein, P., Shevliakova,
E., Bopp, L., Brovkin, V., Hajima, T., Kato, E., Kawamiya, M., Liddicoat, S., Lindsay, K., Reick, C., Roelandt, C., Segschnei-der, J., and Tjiputra, J.: 21st Century compatible CO2emissions and airborne fraction simulated by CMIP5 Earth System models under 4 Representative Concentration Pathways, J. Climate, 26, 4398–4413, doi:10.1175/JCLI-D-12-00554.1, 2013.
Keeling, C. D., Piper, S. C., Bollenbacher, A. F., and Walker, J. S.: Atmospheric CO2Records from Sites in the SIO Air Sampling
Network, Trends: a Compendium of Data on Global Change, Carbon Dioxide Information Analysis Center, Oak Ridge Na-tional Laboratory, US Department of Energy, Oak Ridge, Tenn., USA, 2009.
Matthews, H., Weaver, A., Meissner, K., Gillett, N., and Eby, M.: Natural and anthropogenic climate change: incorporating histor-ical land cover change, vegetation dynamics and the global car-bon cycle, Clim. Dynam., 22, 461–479, 2004.
Moss, R. H., Edmonds, J. A., Hibbard, K. A., Manning, M. R., Rose, S. K., van Vuuren, D. P., Carter, T. R., Emori, S., Kainuma, M., Kram, T., Meehl, G. A., Mitchell, J. F. B., Nakicenovic, N., Riahi, K., Smith, S., Stouffer, R. J., Thomson, A. M., Weyant, J. P., and Wilbanks, T. J.: The next generation of scenarios for climate change research and assessment, Nature, 463, 747–756, 2010. Pithan, F. and Mauritsen, T.: Arctic amplification dominated by
temperature feedbacks in contemporary climate models, Nat. Geosci., 7, 181–184, doi:10.1038/ngeo2071, 2014.
Pitman, A. J., de Noblet-Ducoudré, N., Cruz, F. T., Davin, E. L., Bonan, G. B., Brovkin, V., Claussen, M., Delire, C., Ganzeveld, L., Gayler, V., van den Hurk, B. J. J. M., Lawrence, P. J., van der Molen, M. K., Müller, C., Reick, C., Seneviratne, S. I., Strengers, B. J., and Voldoire, A.: Uncertainties in climate re-sponses to past land cover change: first results from the LU-CID intercomparison study, Geophys. Res. Lett., 36, L14814, doi:10.1029/2009GL039076, 2009.
Pitman, A. J., de Noblet-Ducoudré, N., Avila, F. B., Alexander, L. V., Boisier, J.-P., Brovkin, V., Delire, C., Cruz, F., Donat, M. G., Gayler, V., van den Hurk, B., Reick, C., and Voldoire, A.: Effects of land cover change on temperature and rainfall extremes in multi-model ensemble simulations, Earth Syst. Dynam., 3, 213– 231, doi:10.5194/esd-3-213-2012, 2012.
Pongratz, J., Reick, C., Raddatz, T., and Claussen, M.: Effects of anthropogenic land cover change on the carbon cycle of the last millennium, Global Biogeochem. Cy., 23, GB4001, doi:10.1029/2009GB003488, 2009.
Pongratz, J., Reick, C., Raddatz, T., and Claussen, M.: Biogeo-physical vs. biogeochemical climate response to historical an-thropogenic land cover change, Geophys. Res. Lett., 37, L08702, doi:10.1029/2010GL043010, 2010.
Pongratz, J., Reick, C., Raddatz, T., Caldeira, K., and Claussen, M.: Past land use decisions have increased mitigation poten-tial of reforestation, Geophys. Res. Lett., 38, L15701, doi:10.1029/2011GL047848, 2011.
Reick, C., Raddatz, T., Brovkin, V., and Gayler, V.: The rep-resentation of natural and anthropogenic land cover change in MPI-ESM, J. Adv. Model. Earth Syst., 5, 459–482, doi:10.1002/jame.20022, 2013.
Riahi, K., Rao, S., Krey, V., Cho, C., Chirkov, V., Fischer, G., Kin-dermann, G., Nakicenovic, N., and Rafaj, P.: RCP 8.5 – A sce-nario of comparatively high greenhouse gas emissions, Climatic Change, 109, 1–25, 2011.
Shevliakova, E., Pacala, S., Malyshev, S., Hurtt, G., Milly, P., Caspersen, J., Sentman, L., Fisk, J., Wirth, C., and Crevoisier, C.: Carbon cycling under 300 years of land use change: importance of the secondary vegetation sink, Global Biogeochem. Cy., 23, GB2022, doi:10.1029/2007GB003176, 2009.
Shevliakova, E., Stouffer, R. J., Malyshev, S., Krasting, J. P., Hurtt, G. C., and Pacala, S. W.: Historical warming reduced due to enhanced land carbon uptake, P. Natl. Acad. Sci. USA, 110, 16730–16735, 2013.
Sitch, S., Brovkin, V., von Bloh, W., van Vuuren, D., Eickhout, B., and Ganopolski, A.: Impacts of future land cover changes on atmospheric CO2 and climate, Global Biogeochem. Cy., 19, GB2013, doi:10.1029/2004GB002311, 2005.
Stocker, B., Feissli, F., and Strassmann, K.: Past and future carbon fluxes from land use change, shifting cultivation and wood har-vest, Tellus B, 66, 23188, doi:10.3402/tellusb.v66.23188, 2014. Taylor, K. E., Stouffer, R. J., and Meehl, G. A.: An overview of
CMIP5 and the experiment design, B. Am. Meteorol. Soc., 93, 485–498, 2012.
Van der Molen, M., van den Hurk, B., and Hazeleger, W.: A damp-ened land use change climate response towards the tropics, Clim. Dynam., 37, 2035–2043, 2011.
Vitousek, P. M., Mooney, H. A., Lubchenco, J., and Melillo, J. M.: Human domination of Earth’s ecosystems, Science, 277, 494’– 499, doi:10.1126/science.277.5325.494, 1997.
Watanabe, S., Hajima, T., Sudo, K., Nagashima, T., Takemura, T., Okajima, H., Nozawa, T., Kawase, H., Abe, M., Yokohata, T., Ise, T., Sato, H., Kato, E., Takata, K., Emori, S., and Kawamiya, M.: MIROC-ESM 2010: model description and basic results of CMIP5-20c3m experiments, Geosci. Model Dev., 4, 845–872, doi:10.5194/gmd-4-845-2011, 2011.
Werth, D. and Avissar, R.: The local and global effects of Amazon deforestation, J. Geophys. Res.-Atmos., 107, LBA55-1–LBA55-8.27, doi:10.1029/2001JD000717, 2002.
Wilkenskjeld, S., Kloster, S., Pongratz, J., Raddatz, T., and Reick, C.: Comparing the influence of net and gross anthropogenic land use and land cover changes on the carbon cycle in the MPI-ESM, Biogeosciences Discuss., 11, 5443–5469, doi:10.5194/bgd-11-5443-2014, 2014.
Zwiers, F., von Storch, H., and Max-Planck-Institut für Meteorolo-gie: Taking Serial Correlation into Account in Tests of the Mean, Max-Planck-Institut für Meteorologie, J. Climate, 8, 336–351, doi:10.1175/1520-0442(1995)008<0336:TSCIAI>2.0.CO;2, 1995.