HAL Id: halshs-00552230
https://halshs.archives-ouvertes.fr/halshs-00552230
Preprint submitted on 5 Jan 2011HAL is a multi-disciplinary open access archive for the deposit and dissemination of sci-entific research documents, whether they are pub-lished or not. The documents may come from teaching and research institutions in France or abroad, or from public or private research centers.
L’archive ouverte pluridisciplinaire HAL, est destinée au dépôt et à la diffusion de documents scientifiques de niveau recherche, publiés ou non, émanant des établissements d’enseignement et de recherche français ou étrangers, des laboratoires publics ou privés.
Consequences and Remedies
Christian Hubert Ebeke, Hélène Ehrhart
To cite this version:
Christian Hubert Ebeke, Hélène Ehrhart. Tax Revenue Instability in Sub-Saharan Africa: Conse-quences and Remedies. 2011. �halshs-00552230�
Document de travail de la série Etudes et Documents
E 2010.25
TAX REVENUE INSTABILITY IN SUB-SAHARAN AFRICA:
CONSEQUENCES AND REMEDIES
CHRISTIAN EBEKE 1 and HELENE EHRHART 2
We are particularly grateful to Michael Keen and Mario Mansour for kindly providing the data on tax revenue. We are also indebted to Gerard Chambas, Jean-Louis Combes, Paul Collier, Jan Gunning, Samuel Guerineau, Sylviane Guillaumont, Patrick Guillaumont, Grégoire Rota-Graziosi and participants at ANR-Foreign Aid Seminar at CERDI for their useful comments and suggestions on an earlier draft of this paper.
1
Auvergne University, CERDI, Center for Studies and Research on International Development, 65 Boulevard F. Mitterrand, 63000 Clermont-Ferrand, FRANCE. Tel: (33) 4 731 775 07, Fax: (33) 4 731 774 28.
E-mail: Christian_Hubert.Ebeke@u-clermont1.fr
2
Auvergne University, CERDI, Center for Studies and Research on International Development, 65 Boulevard F. Mitterrand, 63000 Clermont-Ferrand, FRANCE. Tel: (33) 4 731 775 07, Fax: (33) 4 731 774 28.
Summary. – This paper focuses on the sources and consequences of the instability of tax revenue in Sub-Saharan African countries. We take advantage of a unique and extraordinarily rich dataset on the composition of tax revenues for a large number of countries. Using panel data for 39 countries observed over the period 1980-2005, our results are threefold. Firstly, the instability of government tax revenue leads to an instability of both the public investment and government consumption, and finally, reduces the level of public investment. Secondly, foreign aid inflows appear to be an effective insurance mechanism against the instability of tax revenue by lowering the sensitivity of public investment with respect to tax revenue shocks. Finally, the reliance on domestic indirect taxation-based systems seems more stabilizing than the dependency on trade tax revenue.
1 - INTRODUCTION
Tax revenue mobilization in Sub-Saharan Africa (SSA) is not only low compared to spending
needs (Stotsky and Woldemariam, 1997; Keen and Mansour, 2009) but also suffers from high
instability (Brun, Chambas and Combes, 2006). Tax revenue instability has been documented as
particularly important in Sub-Saharan Africa and, from the tax instability measures presented in Table
1, one can note that countries did not succeed well in eliminating this instability over the period
1980-2005. Since the beginning of the 2000’s, a small decrease in tax instability has been occurring but it
still remains an ongoing issue that need to be seriously addressed. As far as the components of tax
revenue are concerned, we can highlight some stylised facts. Corporate taxes were the most instable
taxes during the entire period whereas indirect taxes have became slightly less volatile than trade taxes
since the 90’s.
Table 1: Instability of tax revenues and spending in Sub-Saharan Africa.
1980/1985 1986/1990 1991/1995 1996/2000 2001/2005
Total tax revenue 2.59 2.77 2.64 2.49 2.22
Trade tax revenue 3.04 3.18 3.14 3.07 2.79
Indirect tax revenue 3.22 3.26 3.08 3.06 2.64
Income tax revenue 3.03 2.91 2.83 2.78 2.61
Corporate tax revenue 3.32 3.37 3.34 3.41 3.17
Individual income tax revenue 3.06 2.96 3.09 2.8 2.73
Public investment 2.92 3.30 3.15 3.30 3.22
Government consumption 2.24 2.37 2.36 2.42 2.37
Note: Instability is measured by the standard-deviation of the growth rates of the corresponding variables (in % of GDP) over 5-year overlapping sub-periods. Instability is in logarithmic terms.
The primary concern linked with tax revenues instability is that it may result in public spending
instability which is of deep concern for Sub-Saharan African countries since it was found to be
detrimental for growth and welfare (Guillaumont et al. 1999; Fatas and Mihov, 2003; Furceri, 2007;
Loayza et al., 2007). Indeed, instable revenues are costly because they might force the government to
consequently cut public spending, leading to public spending instability. According to the instability
decreased compared to their levels in the 1980’s and assessing to what extent this fact is due to
revenue instability is therefore crucial.
It is worth noting that the public investment ratio seems more stable than the government
consumption ratio in our sample. This is not very surprising since the government consumption
contains some items such as wage and salaries which are renewed every year.
Only two studies, to our knowledge, tackled the problem of tax revenue instability. Lim (1983)
estimated that tax revenues instability was the major cause of expenditure instability in less developed
countries in the period going from 1965 to 1973. He therefore urged for further research investigating
how to reduce the degree of tax revenue instability. Bleaney, Gemmel and Greenaway (1995) analysed
the sources and the consequences of revenues instability in developing countries. They found that tax
revenue instability is more common in poor, more open and more inflationary economies. Moreover,
the cross-section evidence shows that countries with high tax revenue instability tend also to have high
total expenditure instability.
Given this background, the aim of this paper is to implement a thorough analysis of tax revenue
instability in a panel of Sub-Saharan African countries over the period 1980-2005, judging its impact
on both public investment and government consumption instability and public investment level and
deriving concrete solutions to deal with that.
This study takes advantage of a recent and unique dataset on the composition of the tax revenues
in a long time period compiled by Keen and Mansour (2009). We will first of all assess the
consequences of tax revenue instability on the volatility of both public investment and government
consumption and on levels of public investment which is one of the most crucial components of public
spending for economic growth in developing countries. In a second step, we will investigate the two
means available to governments to deal with the tax revenue instability.
We focus solely on African countries because these countries are often unable to resort to
financial markets (domestic or international) to smooth their revenue. Finding alternative ways of
dealing with revenue instability in these countries is therefore of foremost importance. At the same
time, African countries are the recipients of large amounts of external development assistance. We will
decreasing the public investment instability and can offset the detrimental effect of tax revenues
instability. Moreover, countries can also enhance their risk preparedness by analysing the determinants
of the instability of tax revenue and especially investigating whether a specific tax structure can limit
the instability of the total tax revenue ratio.
To preview our findings, we established that tax revenues instability in Sub-Saharan Africa is
leading to public investment and government consumption instability which in turn generates lower
public investment ratio and is therefore detrimental to the long term economic growth.
Our study reveals that there are two main means of dealing with this issue. On the one hand, when
tax revenues are instable, foreign aid can offset the positive effect of the instability of tax revenue on
the public investment. On the other hand, we find that the departure from trade taxes toward indirect
domestic taxes, a reform which is currently occurring in developing countries, is beneficial for limiting
tax revenue instability.
In the next section, we discuss the impacts of the instability of tax revenue on both the public
consumption and investment in Sub-Saharan Africa. Section 3 is devoted to the analysis of the ways to
deal with tax revenue instability by investigating the role of foreign aid as a risk coping mechanism
and the stabilizing effect of the reliance on domestic indirect taxation mechanisms rather than the
dependency on trade tax revenues. Section 4 concludes on the policy implications for African
countries which can be derived from our results.
2. CONSEQUENCES OF TAX REVENUE INSTABILITY IN THE SSA REGION
The principal objective of this empirical section is to establish the consequences of the high level
of tax revenue instability in the Sub-Saharan region. We analyse the impact of tax instability on the
instability of both public investment and government consumption. In a second step, we analyse what
is the effect of this instability of public spending on the level of public spending. Nevertheless, for the
impact on the level, our interest relies only on public investment which is one of the productive
components of public spending crucial for long-term growth (Barro, 1990; Ramirez and Nazmi, 2003).
spending instability and a negative one between public investment instability and the level of public
investment. Altogether, we are interested in a relationship between tax revenue instability and public
expenditures which looks like communicating vessels: tax revenue instability leads to an increase in
the instability of public investment and the instability of public investment lowers the level of public
capital spending.
Figure 1: Transmission of Tax Revenues instability on Public Spending Instability and on Public Investment Level
It is plausible to think that the ability of public authorities to provide public goods is weakened by
the volatility of their revenues. One could oppose the idea that if the variation in the tax revenue ratio
is perceived as temporary by the governments, they should not move consequently the level of public
spending. As recommended by Barro (1979), public spending should be smoothed and be based on the
permanent component of revenue. In this view, public spending should not be affected by tax revenue
cycles. However, as shown by Akitoby et al. (2006), the public investment component is the most
erratic category of public expenditure in developing countries. This can be explained by two factors.
On the one hand, governments face political pressures such that during boom episodes, they can easily
increase their spending but during downturns, it becomes more difficult to sustain the effort. On the
second hand, governments might be affected by ‘myopia’ and thus are not always able to identify
whether the revenue shocks will be temporary or permanent. We can therefore expect a significant
positive effect of tax instability on both public investment instability and government consumption.
This instability of government expenditures in developing countries (Talvi, 2005; Akitoby et al.,
2007; Thorthon, 2008; Diallo, 2009) might contribute to reduce the mean level of public spending.
This hypothesis might seem counterintuitive since several papers underlined the existence of a positive
the cyclical ratcheting effects (Collier and Gunning, 1999; Tornell and Lane, 1999; Akitoby et al.
2006). However, the expenditure category which is mostly affected by these effects is the current
public expenditures (government consumption). For the public investment category, things appear
relatively different. Indeed, recent papers point the fact that governments of developing countries tend
to cut more easily capital expenditures during recessions than the other spending categories (Akitoby
et al. 2006). This can be partly explained by the lower political cost of a reduction of public
investments than a reduction of spending on wages and salaries or on current goods and services. We
can therefore expect a negative association between public investment instability and its level, what is
detrimental for the long-term capital accumulation.
A. The transmission of the instability of the tax revenue ratio into the instability of public spending ratios
As far as the relationship between the instability of tax revenue and the instability of public
spending is concerned, Lim (1983) provided the first empirical test. The author concluded that one of
the main consequences of the instability of tax revenues is to increase the instability of the aggregate
public spending. By using recent econometric techniques and datasets, we will then be able to provide
and quantify the intensity of this positive relationship. The estimated econometric model is the
following:
Model [1]:
log
( )
σ
is,t=
α
+
θ
log
( )
σ
it,t+
Χ
i′
,tγ
+
u
i+
η
t+
ε
i,twhere the superscripts s and t refer to the public spending variables, either public investment or
government consumption, and to the tax variable respectively.
σ
is the measure of public spending and tax revenue instability. As in Bekaert et al. (2006), we measure it as the 5-year rolling standarddeviation of the growth rate of the corresponding series expressed as part of GDP.3 Thus, we have
yearly data on these measures of instability. Because of the way instability is computed, there is a
suspicion of serial correlation in
ε
i,t. We will therefore use an OLS estimator with Newey-West3
We have not retained the 5-year non overlapping sub-periods as measure of instability because of the limited number of observations that this computation generates.
standard-errors where the error structure is assumed to be heteroskedastic and first-order
autocorrelated. X is the matrix of basic control variables. It includes the proxy for the level of
development (GDP per capita in log terms) and two indicators of the availability of external sources of
funding at the government level, namely foreign aid per capita and the external debt as part of GDP (in
log terms). We expect that both GDP per capita, external debt and foreign aid should be negatively
correlated to the instability of public spending. ui and
η
t are the country and year fixed-effects whichallows controlling for the cross-sectional time-invariant heterogeneity and the common shocks,
respectively. Our hypothesis tested is that
θ
>
0
.The models are estimated over the period 1980-2005 with yearly data. Data on tax revenue are
drawn from the recent work of Keen and Mansour (2009). The public investment ratio is the public
gross fixed capital formation as part of GDP which is drawn from the IMF World Economic Outlook
database. Government Consumption as part of GDP represents current spending of the government
and is drawn from the World Development Indicator (WDI). All the other control variables are also
extracted from WDI. Descriptive statistics of all the variables used in the paper are presented in
Appendix A.
Results
Table 2 shows the estimation of the model (1). The first two columns present the results for the
public investment instability whereas in the two subsequent columns, results are for the government
consumption. In columns 1 and 3, we present the results with a unique control variable, GDP per
capita, and in columns 2 and 4 we add the levels of foreign aid per capita and external debt. The
results show that the level of economic development is negatively correlated with the instability of
public spending. We notice also that foreign aid smoothes the public investment ratio whereas external
debt has no effect.
Regarding now the variable of interest, the results confirm the hypothesis that the instability of tax
revenue is translated into instability of public spending. The coefficients are highly significant at 1%
level and remain robust after the introduction of additional control variables. The coefficient
measuring the impact of the instability of tax revenue is higher for public investment than for
government consumption traducing the fact that public investment is the component more prone to a
decrease than the current spending during bust periods. Having established that the instability of tax
revenue results in the instability of both public investment and government consumption, we will now
assess the impact of public investment instability on the level of public investment.
B. The detrimental effect of the instability of public investment ratio on its level
The model [2] tests the hypothesis that there might be a negative association between the
instability of public investment and its level
(
β
<
0
)
.Model [2]:
( )
( )
it i t it s t i t iu
s
,log
, , ,log
=
α
+
β
σ
+
Υ
′
λ
+
+
η
+
ε
This can be due to the fact that episodes of booms and busts in the dynamics of public spending
reduce the level of public spending observed in the end of the period. On contrary, when the public
spending is relatively stable over time, it results in a higher level of spending than in the previous
scenario.
The matrix Y of control variables includes the level of economic development, the level of foreign
aid per capita, the level of external debt, the urbanization rate and the level of inflation.4 The former is
included to capture the positive association between income and the government size (the Wagner
law) while the second variable controls for the existence of economies of scale in a context of high
urbanization rate. The dependant variable s represents the ratio of public investment as part of GDP.
In the model [2], the coefficient β identifies the correlation between the instability of public
investment and its level. While the model [1] informed us that this instability of spending takes its
4
These variables are often used as main determinants of capital and social spending in developing countries (Dreher, 2008; Fosu, 2007).
source in the instability of tax revenue, it seems more interesting to directly measure the contribution
of the instability of tax revenue on the level of public spending, which passes through the channel of
public spending instability. This task is devoted to the model [3]. To evaluate the importance of the
instability of tax revenue on the level of public spending, we use the instability tax instability as an
instrument for public investment instability.
Model [3]:
( )
it i t it s t i t iz
u
s
, 2 , , ,log
=
α
+
β
)
+
Υ
′
λ
+
+
η
+
ε
where z represents the prediction of the log term of the instability of public investment from a first
stage regression with the tax revenue instability being the instrumental variable.5
In the model [3], β2 quantifies the effect of the instability of public spending induced by the
instability of tax revenue. The comparison between β in the model [2] and β2 in the model [3] is
interesting. Indeed, β measures the effect of the instability of government spending on the level of
spending while β2 measures the effect of the component of the instability of government spending
explained by the instability of tax revenue.
The models [2] and [3] can also be represented in a dynamic form in which the lagged value of the
dependent variable is accounted for. This is justified by the fact that government spending is often
characterized by a strong inertia and controlling for the lagged value of the dependent variable allows
taking into account this dynamic property of the dependent variable. However, this leads to a bias in
the estimation of the coefficient associated with the lagged dependent variable in the presence of
country fixed-effects.
The estimator of the generalized method of moments (GMM) designed for dynamic panel data is
useful is this context. We therefore use the two-step System-GMM estimator (Blundell and Bond,
5
Identifying the transmission channels with the instrumental variables techniques is now common in the literature. Fatas and Mihov (2003) used a similar approach to investigate how the discretionary fiscal policy can reduce economic growth through the channel of the instability of growth. One may argue that tax instability is not a proper exclusion restriction in this model but we are only interested in assessing whether the public investment instability component induced solely by the instability of tax revenue is significantly related to the
1998) with the Windmeijer (2005) correction of standard errors to estimate the dynamic specifications
of models [2] and [3].6
Results
Table 3 presents the results of the estimations of models 2 and 3. In the first column, the results
obtained by the ordinarily least squares (OLS) with country and year fixed effects, suggest a negative
and significant relationship between the instability of the public investment ratio and the public
investment ratio.
- Table 3 -
In column 2, the instability of public investment is instrumented by the instability of tax revenue
in order to account for the transmission channel of the effect of the instability of tax revenue. The
coefficient of the instability of public investment increases in absolute term and is ten times larger than
in column 1. This result reinforces the idea that one channel through which the instability of tax
revenue reduces public investment is the instability of spending. The story remains the same even
when a dynamic panel specification is estimated by the System-GMM-IV method (column 3). Once
again, after instrumenting the instability of spending by the instability of taxes, the negative
contribution of the former remains.
The control variables included in the models exhibit the expected signs. Foreign aid and the
external debt are positively correlated with the public investment ratio in Sub-Saharan Africa.
6
The System-GMM allows the instrumentation of potential endogenous variables by their lagged values. It combines equation in levels and equations in first differences in a system which is estimated jointly. Two tests are presented in order to validate the specification. Firstly, the autocorrelation test of order two of the residuals in differences (Arellano and Bond, 1991) and secondly, the test of over-identification (Hansen test).
3. HOW TO DEAL WITH TAX REVENUES INSTABILITY?
This section is devoted to the analysis of two solutions available to governments in order to cope
with or to manage the tax revenue instability. Firstly, we expose the stabilizing role of foreign aid and
secondly, we investigate the stabilizing effect of the dependency on a domestic taxation-based system.
A. How does foreign aid smooth public capital spending?
Three main channels can be identified to explain how foreign aid might decrease the extent to
which tax revenue instability is translated into public spending instability. First, foreign aid inflows
can be countercyclical and, in presence of tax revenue shocks, permit to smooth public spending.
Second, if public investment is largely financed by foreign aid then the public investment sensitivity to
the tax revenue shocks might be lowered. Lastly, foreign aid can stabilize the overall economy (the tax
base) and then the government tax revenue, and by this way, may reduce the instability of public
investment.
Foreign aid: a risk coping mechanism?
We evaluate the potential of foreign aid to act as an effective insurance mechanism to which
governments of Sub-Saharan African countries can resort to smooth their total revenues and then their
developmental spending. More precisely, we examine the effect of foreign aid on the elasticity of
public investment instability with respect to tax revenue instability. The following model is then
specified to quantify the insurance effect played by foreign aid:
Model [4]:
( )
( )
( )
( )
it( )
it it i t it t t i t t i s ti, 1
log
, 2log
,log
A
, 3log
A
, ,u
,log
σ
=
α
+
θ
σ
+
θ
σ
∗
+
θ
+
Χ
′
γ
+
+
η
+
ε
where A is foreign aid per capita. The insurance role of foreign aid is validated when
θ
1>
0
and0
2
<
instability is strongly reduced at high levels of foreign aid per capita received. Because we expect the
two coefficients to have opposite signs, the threshold level of foreign aid (in $US per capita terms)
which fully stabilizes (offsets) the effect of tax instability is given by the following formula:
−
=
2 1exp
*
θ
θ
)
)
A
. - Table 4 -The results show that there is a nonlinear effect of tax revenue instability on the instability of
public investment which depends on the level of foreign aid. As expected, the coefficient of the
additive term of the instability of tax revenue is positive and significant in the two specifications
(column 1 and column 2). However, the interaction of this variable with the level of foreign aid per
capita exhibits a negative and significant coefficient. This confirms that foreign aid reduces the
elasticity of spending shocks to tax revenue shocks. The full offsetting of the impact of tax revenue
instability occurs for levels of foreign aid per capita higher than 120 $US per year. We conclude that
the mean level of aid per capita (57 US$, in the sample) enables an absorption of 84 percent of the
destabilizing effect of the instability of tax revenue on public investment instability, compared to the
extreme case of a zero aid situation.
The initial presence of aid inflows in the country
An additional way of explaining the stabilizing effect of foreign aid on public spending might rely
in the fact that foreign aid was already financing a large part of public investment in the country thus
reducing the propensity of public investment to be instable. We will therefore test whether large
inflows of foreign aid in the time period before tax revenue shocks are decreasing the destabilizing
effect of current tax revenue instability on public investment7. In the model [5], an interactive variable
between tax revenue instability and the five year lagged level of foreign aid is introduced.
7
Instability being measured as the 5 year rolling standard deviation, the level of foreign aid preceding the tax shock is the one in t-5.
Model [5]:
( )
( )
( )
(
it)
(
it)
it i t it t t i t t i s ti, 1
log
, 2log
,log
A
, 5 3log
A
, 5 ,u
,log
σ
=
α
+
θ
σ
+
θ
σ
∗
−+
θ
−+
Χ
′
γ
+
+
η
+
ε
The results are presented in columns 3 and 4 of Table 4. We find that
θ
1>
0
andθ
2<
0
, meaning that a higher level of tax revenue instability is translated into public investment volatility butthis effect is decreased in the presence of large foreign aid inflows in the 5 years preceding the tax
revenue shock. This result is robust to the addition of external debt as control variable in column 4.
The channel of the stabilization of the government tax revenue
In our investigation of the mechanics underlining the contribution of foreign aid on public
investment spending stabilization, we ask if a part of the total stabilizing effect of foreign aid might
pass through the channel of the stabilization of government tax revenues. Foreign aid can reduce the
instability of public tax revenue by enhancing the administrative capacity of the public sector and its
efficiency in tax mobilization. Moreover, external development assistance subject to conditionality can
enhance the macroeconomic management and institutional quality in receiving countries, which in
turn lower the aggregate volatility.
Thus, by lowering the instability of tax revenue in recipient countries aid can contribute to
smoothing the level of public spending over the time. However, the contribution of foreign aid into
aggregate stability is not always recognized in the literature. Some authors (Rajan and Subramanian,
2009) pointed that aid can lead to a real exchange rate appreciation which is an obvious source of
macroeconomic instability in developing countries. It thus results that quantifying the relevance of the
channel of aggregate stability due to foreign aid is empirical. We take advantage of the recent
literature on foreign aid in developing countries to breakdown the contribution of aid to the stability of
public investment into the ‘indirect effect’ – aid stabilizes the economy and then the government
revenues – and the ‘direct effect’ of aid.
The methodology described in Gomanee et al. (2005) is used to address this issue. The method
transmission channel (here, the instability of total tax revenues). The residual term of this first
estimation measures the component of the tax revenue instability not explained by foreign aid.
Model [6]:
( )
( )
it i t itt t
i,
log
A
,u
,log
σ
=
α
+
β
+
+
η
+
ε
The second stage consists in estimating two equations. The first one is designed to measure the
direct effect of foreign aid on the instability of public investment by including both the instability of
tax revenue and foreign aid. More specifically, we have
Model [7]:
( )
( )
(
it)
it i t it t t i s t i, 1log
A
,log
, ,u
,log
σ
=
α
+
θ
+
λ
σ
+
Χ
′
γ
+
+
η
+
ε
The second one replaces the effective value of tax revenue instability by its residual component
estimated in the model [6]. It results that the coefficient associated with foreign aid in this
specification measures the ‘total effect’ of aid on public spending instability. This leads to
Model [8]:
( )
( )
it it i t it t t i s t i, 2log
A
,ˆ
, ,u
,log
σ
=
α
+
θ
+
λ
σ
+
Χ
′
γ
+
+
η
+
ε
Finally, the indirect effect (expressed in percentage of the total effect) of foreign aid which passes
through the channel of the stabilization of the government revenues is given by:
(
)
2 1 2
100
θ
θ
θ
−
×
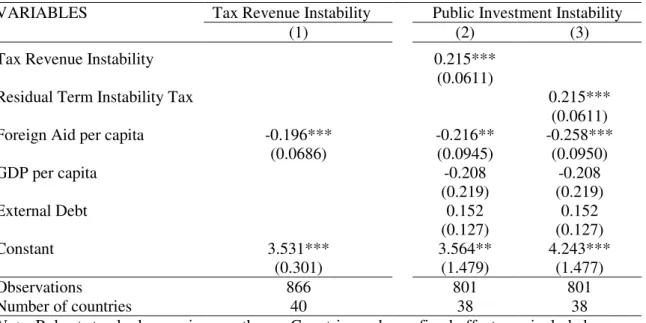
.The results of the estimations are presented in Table 5. In column 1, we see that the value of
β
is about - 0.20. This suggests a strong and significant negative correlation between the instability of taxrevenue and foreign aid.
- Table 5 –
In column 2, the direct effect of foreign aid (obtained by controlling for observed instability of tax) is
close to - 0.20. Finally, in column 3 the instability of tax revenue is replaced by the residual term of
aid is then -0.26. It thus comes that the indirect contribution of foreign through the macroeconomic
stability channel is around 17% of the total potential stabilizing effect of aid. The main conclusion that
comes after this result is that the ‘indirect channel’ tackled here is quite low and then foreign aid acts
like a spending smoother primarily through the insurance channel discussed in the two previous
sub-sections and not necessarily through the stabilization of the government tax revenues.
B. How can tax composition affect revenue instability?
This section is devoted to the understanding of the sources of tax revenue instability in
Sub-Saharan Africa and of the ways to reduce it. We take advantage of the new dataset released by Keen
and Mansour (2009) which includes disaggregated tax data on: international trade taxes, indirect taxes
(VAT, sales taxes and excises) and income taxes (individuals’ and corporate income taxes) are
expressed in percent of GDP.
We focus primarily on the stabilizing effect of the domestic taxation-based systems vis-a-vis the
dependency on trade tax revenues. The hypothesis tested is that a high dependency on trade taxes
rather than on domestic taxes (indirect or direct) leads to more revenue instability because trade taxes
are more vulnerable to external shocks (Bleaney et al. 1995). In contrast, the dependency on domestic
indirect taxes for example, should be associated with low instability of tax revenue because the
corresponding tax base, mainly the private consumption, is more stable and relatively less affected by
the business cycle.8
Looking at the stabilizing effect of the reliance on domestic taxes is also a value added to the
recent literature which has analyzed the effectiveness of the domestic tax instruments in the recovery
of tax revenues looses after the trade liberalization in many developing countries (Baunsgaard and
Keen, 2010). Our paper therefore adds to this literature another relevant motive to enhance the
efficiency of the domestic tax instruments by looking not at the effect on the level of the tax revenues
collected, but at the stability of this level.
8
Even though about 55 percent on average (Ebrill et al., 2001) of the value-added tax is collected at the border on imports, the remaining 45 percent rely on domestic consumption and are therefore likely to be more stable.
In order to quantify the differential effects on tax instability of the different categories of taxes,
several specifications can be retained. Indeed, the first way to quantify the differential effect of the
dependency on trade tax revenues rather than domestic tax revenues is to explain the instability of the
total tax revenue ratio by the share of trade tax revenues in the total tax revenues. This is described by
the model [9]:
Model [9]:
log
( )
σ
i,t=
α
+
Χ
′
i,tδ
+
θ
1ttx
i,t+
u
i+
η
t+
ε
i,twhere ttx represents the logarithm of the ratio of the trade tax revenues over the total tax revenues in
each country,
σ
i,t is the instability of total taxes. X is the matrix of control variables.To confront the effect of the dependency on trade tax revenue with that of the domestic tax
dependency, the same model is estimated by replacing ttx by the logarithm of domestic tax revenue
divided by the total tax revenues (dtx)
Model [10]:
log
( )
σ
i,t=
α
+
Χ
′
i,tδ
+
θ
2dtx
i,t+
u
i+
η
t+
ε
i,tWhile the previous approach seems interesting to give a first look at the respective effects of the
dependency on trade and domestic tax revenues, it does not allow estimating in the same equation, the
effects of the dependency on trade tax vis-à-vis the domestic tax. In fact, because of the high and
negative colinearity between these two variables (the sum of the two leads to 100%), introducing
additively the two variables in the equation may induce a bias.
We tackle this potential issue by replacing both the trade tax and the domestic tax dependency by
a new variable R which is the ratio of the domestic tax revenues divided by the trade tax revenues to
approximate the structure of the taxation system in each country. Therefore, an increase in this ratio
should be associated to less instability of the government tax revenues according to our hypothesis that
the reliance on a domestic taxation system is more stabilizing. The specification derived from this is
presented in model [11]:
The matrix of control variables includes the standard determinants of the instability of taxes (see
Lim, 1983; Bleaney et al. 1995) and other potential correlates. Among the structural factors we have
GDP per capita, country size (population), trade openness, and the level of natural resources rent. The
other determinants are shocks variables: the GDP per capita growth instability, the terms of trade
instability and the inflation volatility.
We expect that the instability of the tax base (GDP per capita instability) and both the inflation and
terms of trade volatility should be positively correlated with the instability of total tax revenues. The
level of economic development (GDP per capita) should be negatively associated with the instability
of taxes because it proxies for the degree of risk management and diversification of productions
activities, which can lower the extent of volatility. The country size might also reduce the instability of
tax revenue because small countries are more prone to covariant shocks than larger countries.
The contribution of trade openness to tax instability is less striking. On the one hand, trade
openness might proxy for an openness policy behind which there exists a willingness to provide a
better management of the economic affairs, good institutions and policies for competitiveness. On the
other hand, trade openness might proxy for the “natural openness” which increases the vulnerability of
a small open economy to external shocks. Altogether, the sign of the coefficient associated to the trade
openness variable (exports plus imports divided by the GDP) is ambiguous. Finally, we expect a
positive association between the levels of natural resources rent and tax revenue instability because the
natural resources prices are known to be highly volatile.
Regarding the shocks, we expect that each type of shocks will increase the instability of
government tax revenues. All the data on control variables are drawn from the World Development
Indicators (2009). The estimation concerns the period 1980-2005 and the estimator is a two-way
fixed-effects OLS method with Newey-West standard-errors accounting for a heteroskedastic and first-order
autoregressive error structure in the residuals.
Results: The effect of the tax composition on the instability of revenues
Table 6 shows the estimation of the coefficients associated with the tax structure variables. The
taxes is a significant and positive determinant of the instability of government revenue in SSA and this
appears to be robust to the alternative specifications used. On contrary, the dependency on domestic
taxes has a stabilizing effect which can be observed in columns 2 and 3.
- Table 6 -
Domestic taxes are composed of both direct taxes, on personal and companies’ income, and
indirect taxes, such as value added taxes or excises, so we investigate in the last three columns of
Table 6 whether the stabilizing effect of a higher reliance on domestic taxes is due to direct taxes or to
domestic indirect taxes.
We breakdown the domestic tax revenues into the indirect tax and the direct tax revenue ratios and
confront their respective impacts of the instability of the government tax revenue in Africa. However,
since our test consists in comparing the respective effects of direct tax revenue ratio relative to the
contribution of the reliance on trade tax revenues in column 4 and domestic indirect tax ratio
compared to trade tax dependency in column 5 there might be a colinearity problem. Indeed, as
mentioned by Bleaney et al. (1995), the two tax variables in column 4 are necessarily negatively
correlated with the domestic indirect tax ratio (the sum of the three leads to 100) and an arithmetical
transformation is needed to reduce the colinearity problem. To deal with that, we follow Bleaney et al.
(1995) by computing the dependency on the direct tax revenues and on the domestic indirect tax
revenues as the level of these tax revenues divided by the level of the total tax revenue excluding trade
taxes. We use these same measures for direct taxes dependency and domestic indirect taxes
dependency in the last column of Table 6, but include simultaneously the two variables in the same
equation both as a robustness check and to allow for a better interpretation of the effects.
In column 4, the coefficient associated with the dependency on direct taxes is non significant
whereas a higher dependency on indirect taxes (columns 5 and 6) is significantly associated with
Because the domestic indirect taxes have undergone several reforms in developing countries over
the period 1980-2005, the impact of domestic indirect taxes on the instability of tax revenue might not
be constant over the period. Put differently, it is possible that the effect of domestic indirect taxes
varies over time and thus becomes more significant in the recent period, a period characterized by
peaks in the VAT adoption in Sub-Saharan Africa and by several reforms taken to improve the tax
administration. The era of VAT adoption in developing countries is associated with significantly more
domestic indirect tax revenue being collected (Keen and Lockwood, 2010) and we investigate whether
this has lead to more stable tax revenue in Sub-Saharan African countries.
To tackle this issue, we perform cross-sectional rolling regressions year by year to assess the
distinctive impact of the dependency on indirect taxes on the instability of tax revenue at each year.
Figure 2 depicts the evolution of the coefficient associated with the indirect tax revenue variable. A
greater dependency on domestic indirect taxes significantly has decreased the instability of tax
revenues mainly since the end of the 1990s in Sub-Saharan Africa.
The reinforced negative effect of indirect taxes dependency on government revenues instability in
the recent period coincides in fact with the period of more VAT adopters in Sub-Saharan Africa
(Figure 3).
Source: Authors’ calculations and Ebrill et al. (2001).
Beyond the stabilizing effect of a higher dependency on domestic indirect taxes, other variables
are also significant determinants of tax instability on which governments should focus. In Table 6, we
can notice that large countries experiment less instability of their total tax revenue. In large countries,
the government takes advantage of the spatial dispersion (geographical dispersion) of the taxpayers,
what leads to a more stable revenue collected since citizens in large countries do not experiment the
same shocks at the same time. This result seems close to the conclusion of Furceri and Ribeiro (2009)
who found that large countries exhibit a low instability of the government consumption ratio.
Regarding the shocks variables, inflation volatility and the instability of the aggregate tax base
(GDP per capita instability) are significantly and positively associated with the instability of tax
revenues. These results highlight the importance of the macroeconomic stability and the disinflation
policies as among the main policy agenda to reduce the instability of government tax revenue in
Africa. Moreover, the level of natural resources rents also appears positively correlated with the
instability in the oil price which is transmitted into government revenues what reinforces the
macroeconomic uncertainty and the difficulties for these countries in the conduct of fiscal and
developmental policies.
5. CONCLUSION AND POLICY RECOMMENDATIONS
Tax revenues instability has proved to be a crucial issue for decades in Sub-Saharan Africa and
therefore really needs to be addressed. In this paper we investigated the consequences of tax revenues
instability in a panel of 39 Sub-Saharan African countries over the period 1980-2005 and derived
solutions in order to mitigate it. Tax revenue instability in Sub-Saharan Africa is not only high but also
highly detrimental since we found that it leads to increased public spending volatility. Moreover, we
found robust evidence that high instability of the public investment has a negative impact on the level
of public investment.
Given these negative consequences of tax revenues instability, we studied how governments could
cope with and/or manage the instability of tax revenues. Firstly, we found that foreign aid acts as a
buffer mechanism to counter the detrimental impact of the instability of tax revenues on the public
capital spending. Secondly, we analysed what factors could reduce the instability of tax revenue per
se. We found that tax composition matters. A lower reliance on trade taxes and a higher dependency
on domestic indirect taxes lead significantly to low levels of instability of tax revenues. Therefore, the
departure from trade taxes toward indirect domestic taxes, which is currently occurring in developing
countries, is beneficial for limiting tax revenues instability. Foreign aid can also help Sub-Saharan
REFERENCES
Akitoby, B.; B. Clements, S. Gupta and G. Inchauste, 2006. “Public spending, voracity, and Wagner's law in developing countries”, European Journal of Political Economy, 22, 908-924
Afonso, A. and D. Furceri, 2010, “Government size, composition, volatility and economic growth”,
European Journal of Political Economy, doi: 10.1016/j.ejpoleco.2010.02.002.
Arellano, M. and S. Bond, 1991, “Some tests of specification for panel data: Monte Carlo evidence and an application to employment equations”, The Review of Economic Studies, Review of Economic
Studies Ltd., 277-297
Barro, R. J, 1979, “On the Determination of the Public Debt,” Journal of Political Economy, 87(5), pp. 940-71.
Baunsgaard, T. and M. Keen, 2010, “Tax revenue and (or?) trade liberalization”, Journal of Public
Economics, 94, 563-577.
Barro, R. J., 1990, “Government Spending in a Simple Model of Endogeneous Growth”, Journal of
Political Economy, 98(5), pp. S103-S125.
Bekaert G., C. R. Harvey and C. Lundblad, 2006, “Growth volatility and financial liberalization”,
Journal of International Money and Finance, 25, 370-403.
Bleaney, Y. M., N. Gemmel and D. Greenaway, 1995, “Tax Revenue Instability, with Particular Reference to Sub-Saharan Africa”, The Journal of Development Studies, 31, 883-902.
Blundell, R. and S. Bond, 1998, “Initial conditions and moment restrictions in dynamic panel data models”, Journal of econometrics, 87, 115-143.
Brun, J.F., G. Chambas and J.L. Combes, 2006, “Recettes publiques des pays en développement. Méthode d'évaluation”, Statéco, 100, 163-171.
Collier, P., J.W. Gunning and associates, 1999, Trade Shocks in Developing Countries. Vol. 1: Africa, Vol. 2: Asia and Latin America, Oxford: Oxford University Press.
Diallo, O., 2009. “Tortuous road toward countercyclical fiscal policy: Lessons from democratized sub-Saharan Africa”, Journal of Policy Modeling, 31, 36-50
Dreher, A.; J. Sturm and H. Ursprung, 2008, “The impact of globalization on the composition of government expenditures: Evidence from panel data”, Public Choice, 134, 263-292.
Ebrill, L., M. Keen, J-P. Bodin and V. Summers, 2001, “The Modern VAT”, International Monetary Fund.
Fatás, A and I. Mihov, 2003, “The Case for Restricting Fiscal Policy Discretion”, Quarterly Journal
of Economics, 118, 1419-1447.
Fosu, A. K., 2007. “The External Debt-Servicing Constraint and Public Expenditure Composition: Evidence from African Economies” World Institute for Development Economic Research
(UNU-WIDER), 2007/36.
Furceri, D., 2007, “Is Government Expenditure Volatility Harmful for Growth? A Cross-Country Analysis”, Fiscal Studies, 28(1), 103-120.
Furceri, D. and M. P. Ribeiro, 2009, “Government Consumption Volatility and the Size of Nations”,
OECD Economics Department Working Papers, No. 687, OECD Publishing.
Gomanee, K., S. Girma and O. Morrissey, 2005, “Aid and growth in Sub-Saharan Africa: accounting for transmission mechanisms”, Journal of International Development, 17(8), 1055-1075.
Guillaumont, P., S. Jeanneney Guillaumont and J.-F. Brun, 1999, "How Instability Lowers African Growth," Journal of African Economies, 8(1), 87-107.
Keen, M., and B. Lockwood, 2010, “The value added tax: Its causes and consequences”, Journal of
Development Economics, 92(2), pp. 138-151.
Keen, M. and M. Mansour, 2009, “Revenue Mobilization in Sub-Saharan Africa: Challenges from Globalization”, International Monetary Fund Working Paper WP/09/157.
Lim, D., 1983, “Instability of Government Revenue and Expenditure in Less Developed Countries”,
World Development, 11(5), 447-450.
Loayza, N., R. Rancière, L. Servén and J. Ventura, 2007, “Macroeconomic volatility and welfare in developing countries: an introduction”, World Bank Economic Review, 21, 343-357.
Rajan, R. G. and A. Subramanian, 2009, “Aid, Dutch disease, and manufacturing growth”, Journal of
Development Economics, doi:10.1016/j.jdeveco.2009.12.004
Ramirez, M. D. and N. Nazmi, 2003. “Public Investment and Economic Growth in Latin America: an Empirical Test”, Review of Development Economics, 7(1), pp.115-126.
Stotsky J. G. and A. WoldeMariam, 1997, “Tax Effort in Sub-Saharan Africa”, International
Monetary Fund Working Paper WP/97/107.
Talvi E. and C. A. Végh, 2005, “Tax base variability and procyclical fiscal policy in developing countries”, Journal of Development Economics, 78, 156-190.
Thornton, J., 2008. “Explaining Procyclical Fiscal Policy in African Countries”, Journal of African
Economies, 17, 451-464
Windmeijer, F., 2005. “A finite sample correction for the variance of linear efficient two-step GMM estimators”, Journal of econometrics, 126, 25-51.
Table 2: Impact of the instability of tax revenue on the instability of public spending, 1980-2005
Public Investment instability Governement Consumption instability
(1) (2) (3) (4)
Tax revenue instability 0.226*** 0.215*** 0.154*** 0.156***
(0.0597) (0.0611) (0.0402) (0.0402)
GDP per capita -0.281 -0.208 -0.0828 -0.185
(0.174) (0.219) (0.0944) (0.128)
Foreign aid per capita -0.216** -0.0700
(0.0945) (0.0681) External debt 0.152 -0.0953 (0.127) (0.0858) Constant 4.228*** 3.564** 2.667*** 3.672*** (0.864) (1.479) (0.486) (1.046) Observations 834 801 833 802 Number of countries 39 38 39 38
Note: Robust standard errors in parentheses. All the variables are expressed in their natural logarithmic terms. The OLS estimator with Newey-West standard-errors and country and year fixed effects is used.
Table 3: How the instability of tax revenue lowers the level of public spending, 1980-2005 Public Investment Ratio
OLS-FE IV-FE System-GMM-IV
(1) (2) (3)
Public investment ratio (t-1) 0.767***
(0.068)
Public investment instability -0.0575** -0.792*** -0.112**
(0.0285) (0.217) (0.0443) GDP per capita 0.243** 0.127 0.118 (0.111) (0.164) (0.0973) Urbanization rate -0.609*** -0.872** -0.248* (0.209) (0.374) (0.150) Inflation -0.0739 0.286 0.158 (0.132) (0.228) (0.137)
Foreign aid per capita 0.203*** 0.0788 0.220
(0.065) (0.101) (0.220) External debt 0.411*** 0.411*** 0.0957 (0.087) (0.112) (0.114) Constant 0.283 -1.018 (1.100) (1.115) Observations 687 687 685 Number of countries 36 36 36 Number of instruments .. .. 34 AR(1) p-value .. .. 0.000 AR(2) p-value .. .. 0.869
Hansen OID p-value .. .. 0.963
Note: Robust standard errors withNewey-West correction for autocorrelation in parentheses. Country and year fixed effects included in all estimations All the variables are expressed in log terms. In column (2), the instability of public investment is instrumented by the instability of total taxes revenue. In column (3), the two-step estimator with the Windmeijer (2005) correction for finite sample bias has been used. In the GMM-System estimation, the level of inflation, the rate of urbanization and year dummies are considered as exogenous, the lagged dependent variable is treated as predetermined and the public investment instability and the level of foreign aid, the level of external debt and the level of GDP are considered as endogenous and instrumented with one lag. We include as external instrument the logarithm instability of tax revenue. AR(2) refers to the probability of the test of 2nd order autocorrelation of Arellano and Bond (1991) of the residuals in first differences. *** p<0.01, ** p<0.05, * p<0.1.
Table 4: The stabilizing effect of foreign aid in Sub-Saharan Africa, 1980-2005 Public Investment Instability
(1) (2) (3) (4)
Foreign aid per capita 0.430* 0.449*
(0.256) (0.265) Tax revenue instability * Foreign aid -0.243** -0.270***
(0.0945) (0.0975)
Tax revenue instability 1.175*** 1.281*** 0.993*** 1.095***
(0.390) (0.400) (0.364) (0.380)
Foreign aid per capita (t-5) 0.462* 0.431
(0.258) (0.271)
Tax revenue instability * Foreign aid (t-5) -0.200** -0.227**
(0.0880) (0.0922) GDP per capita -0.327* -0.195 -0.239 -0.0369 (0.174) (0.218) (0.177) (0.207) External debt 0.169 0.227** (0.125) (0.114) Constant 2.755 0.785 2.253 0.313 (0) (1.789) (1.488) (1.854) Observations 825 801 787 767 Number of countries 39 38 39 38
Joint significance of instability variables, p-value
0.0001 0.0001 0.0004 0.0006
Threshold of foreign aid per capita $US a 126 $ 116 $
Note: Robust standard errors in parentheses. Countries and year fixed-effects are included. The OLS estimator with Newey-West standard-errors is applied to the data.
a
refers to the level of foreign aid which fully offsets the impact of the instability of tax revenue on the instability of public developmental expenditures. It has been obtained after taking the first derivative of public spending with respect to the instability of tax revenue.
Table 5: Public Investment Instability and aid: the channel of tax base stabilization
VARIABLES Tax Revenue Instability Public Investment Instability
(1) (2) (3)
Tax Revenue Instability 0.215***
(0.0611)
Residual Term Instability Tax 0.215***
(0.0611)
Foreign Aid per capita -0.196*** -0.216** -0.258***
(0.0686) (0.0945) (0.0950) GDP per capita -0.208 -0.208 (0.219) (0.219) External Debt 0.152 0.152 (0.127) (0.127) Constant 3.531*** 3.564** 4.243*** (0.301) (1.479) (1.477) Observations 866 801 801 Number of countries 40 38 38
Note: Robust standard errors in parentheses. Countries and year fixed-effects are included. The OLS estimator with Newey-West standard-errors is applied to the data.
Table 6 : Effect of the tax composition on the instability of tax revenues
Dependent variable : Total tax revenue instability
(1) (2) (3) (4) (5) (6)
Tax composition variables
Trade taxes dependency 0.237*** 0.227*** 0.248*** 0.256***
(0.0808) (0.0865) (0.0807) (0.0871)
Domestic taxes dependency -0.437***
(0.153)
Ratio Domestic/Trade taxes -0.275***
(0.0733)
Direct taxes dependency 0.0541 -0.0401
(0.117) (0.128) DomesticIndirect taxes -0.0777* -0.0818* dependency (0.0464) (0.0467) Structural factors GDP per capita 0.0109 -0.247 -0.0571 0.0125 -0.0179 -0.0208 (0.216) (0.179) (0.195) (0.216) (0.195) (0.196) Population -2.511*** -2.674*** -2.688*** -2.514*** -2.644*** -2.650*** (0.636) (0.636) (0.639) (0.637) (0.645) (0.647) Trade openness -0.234* -0.237* -0.229* -0.238* -0.232* -0.229 (0.139) (0.132) (0.134) (0.140) (0.138) (0.139)
Natural resources rents 1.402** 0.202 0.882 1.452** 1.136 1.085
(0.680) (0.669) (0.635) (0.687) (0.693) (0.701)
Shocks variables
GDP per capita instability 0.218*** 0.196*** 0.211*** 0.219*** 0.216*** 0.216*** (0.0471) (0.0486) (0.0476) (0.0465) (0.0465) (0.0462)
Inflation volatility 0.0730* 0.0759** 0.0673* 0.0737* 0.0788** 0.0788**
(0.0384) (0.0371) (0.0366) (0.0383) (0.0382) (0.0382)
Terms of trade volatility 0.0660 0.0451 0.0577 0.0678 0.0602 0.0584
(0.0417) (0.0393) (0.0397) (0.0416) (0.0411) (0.0407)
Constant 39.96*** 46.54 45.72*** 39.84 42.84*** 43.08***
(9.916) (0) (10.17) (0) (9.984) (10.08)
Observations 576 576 571 576 570 570
Countries 33 33 33 33 33 33
Note: Robust standard errors in parentheses. OLS with Newey-West standard-errors and country and year fixed-effects is used. All the variables are expressed in log terms. *** p<0.01, ** p<0.05, * p<0.1.
APPENDICES
Appendix 1 – Descriptive Statistics
Variable Obs Mean Std. Dev. Min Max
Tax Revenues
Total tax revenue instability (log) 875 2.535 .7538 .3500 5.667
Trade tax revenue instability (log) 875 3.044 .7951 .7890 6.456
Indirect tax revenue instability (log) 869 3.027 .8923 .6396 5.725
Income tax revenue instability (log) 875 2.806 .7229 .5536 5.507
Corporate tax revenue instability (log) 800 3.321 .7902 1.074 6.244 Individual tax revenue instability (log) 806 2.909 .7832 .2425 6.365
Trade Tax dependency (log) 1027 3.266 .7309 -1.555 4.504
Domestic Tax dependency (log) 1028 3.868 .5270 .5993 4.5559
Ratio Domestic/Trade taxes 1022 5.197 .938 1.949 10.701
Direct Tax dependency (log) 1033 3.504 .5947 .5247 4.5262
Indirect Domestic Tax Dependency (log) 1024 3.490 .9863 -3.157 4.463
Public Spending
Public investment instability (log) 856 3.2187 .9237 -3.7879 6.0627 Government consumption instability (log) 837 2.371 .770 .1914 4.304
Public investment ratio (log) 966 1.8750 .7380 -2.2671 4.5502
Control Variables
GDP per capita instability (log) 846 1.0907 .8242 -1.5944 3.4338
Terms of trade instability (log) 698 2.1875 .8917 -1.8921 4.2694
Inflation (log) 864 4.7288 .1770 4.4111 6.2761
Inflation Volatility (log) 744 1.7087 .9939 -1.021 5.073
Natural Resources Rent (log(1+x)) 953 .04804 .0945 0 .8652
Population (log) 1040 15.2708 1.6125 11.0729 18.7668
Openness (log) 991 4.1226 .5323 1.8438 5.6176
GDP per capita (log) 997 6.1333 1.0440 4.5226 8.9994
External debt (%GNI) (log) 943 4.2751 .73169 1.5905 6.2185
Foreign aid per capita (log) 1023 4.0468 .6686 .1038 6.5077
Appendix 2 – List of countries (39 Sub-Saharan African Countries)
Benin, Burundi, Burkina Faso, Botswana, Cameroon, Cape Verde, Central African Republic, Chad, Comoros, Congo Republic, Côte d’Ivoire, Equatorial Guinea, Ethiopia, Gabon, Gambia, Ghana, Guinea, Guinea-Bissau, Kenya, Lesotho, Madagascar, Malawi, Mali, Mauritius, Mozambique, Namibia, Niger, Nigeria, Rwanda, Senegal, Seychelles, Sierra Leone, South Africa, Swaziland, Tanzania, Togo, Uganda, Zambia, Zimbabwe.