HAL Id: hal-01703126
https://hal.archives-ouvertes.fr/hal-01703126
Submitted on 8 Nov 2019
HAL is a multi-disciplinary open access archive for the deposit and dissemination of sci-entific research documents, whether they are pub-lished or not. The documents may come from teaching and research institutions in France or abroad, or from public or private research centers.
L’archive ouverte pluridisciplinaire HAL, est destinée au dépôt et à la diffusion de documents scientifiques de niveau recherche, publiés ou non, émanant des établissements d’enseignement et de recherche français ou étrangers, des laboratoires publics ou privés.
Modeling of solid particles pyrolysis
Pierre Mousques, Jean-Louis Dirion, Didier Grouset
To cite this version:
Pierre Mousques, Jean-Louis Dirion, Didier Grouset. Modeling of solid particles pyrolysis. Journal of Analytical and Applied Pyrolysis, Elsevier, 2001, 58, pp.733-745. �10.1016/S0165-2370(00)00176-5�. �hal-01703126�
Modeling of solid particles pyrolysis
P. Mousque`s *, J.L. Dirion, D. Grouset
Ecole des Mines d’Albi-Carmaux, Centre Energe´tique et En!ironnement, Campus Jarlard, Route de Teillet,81013 Albi Cedex 09, France
Abstract
Two models of solid particle pyrolysis have been developed. The first one represents the pyrolysis of a homogeneous solid particle and the second one describes temperature, composition, velocity and pressure gradients inside the particle. These two models are able to simulate reaction schemes of varying complexity. They have been tested with data from the literature concerning wood and PVC. © 2001 Elsevier Science B.V. All rights reserved.
Keywords: Pyrolysis; Modeling; PVC; Wood
1. Introduction
In order to develop designs for industrial pyrolysis processes adapted to various wastes or mixed wastes, it is necessary to correctly understand the physico-chemical phenomena interacting during pyrolysis. To cope with the diversity of materials or mixed materials and with the numerous technologies, which can be found, general
Abbre!iations: Ai, pre-exponential factor, s− 1; Ei, activation energy, J mol− 1; Ki, reaction rate; hi,
enthalpy of ith component, J kg− 1; H
c, convective exchange coefficient, W m− 2 K− 1; k*, effective thermal conductivity, W m− 1 K− 1; L, total number of gaseous species; M, total number of solid residues; Mi, molecular weight of gas i, kg mol− 1; N, total number of initial compounds; Nu, Nusselt
number; P, pressure, Pa; Pr, Prandtl number; Q, secondary reaction number; Qray, radiative flux, W; R, primary re´action number; Re, Reynolds number; Rg, perfect gas constant; Rp, particle radius, m; S, particle surface, m2; t, time, s; T, particle temperature, K; T
p, furnace wall temperature, K; u, Darcy gas velocity, m s− 1; X, conversion grade; !, porosity; !
p, particle emissivity; ", viscosity, Pa s; #, apparent density, kg m− 3; Stefan constant, W m− 2 K− 4; $
cond, conduction characteristic time; $cin, kinetic characteristic time; $ext, external heat transfer characteristic time; %, permeability, m2.
* Corresponding author. Tel.: +33-5-63493238; fax: +33-5-63493099. E-mail address: [email protected] (P. Mousque`s).
but accurate models are required. According to our approach, modeling of chemi-cal and physichemi-cal phenomena at the particle level is a necessary step on the way to an accurate process model. Many particle models adaptable to only one specific material can be found in the literature [1,2]. In this work, two flexible particle models have been developed: The first assumes that the particles are homogeneous with respect to temperature and composition (homogeneous model), and the second takes into account gradients (heterogeneous model). In the first version of these models, remarks have to be noticed:
1. First, several simplifying assumptions had to be made in order to conceive an easy-to-use general model.
2. Significant effort has been made to represent chemical aspects. Various chemical reaction schemes can be easily incorporated into the models. Thus, pyrolysis of different products can be simulated. In this paper, only simple reaction schemes using pseudo-species are used.
3. To date, it is difficult to find a complete set of data (thermal, chemical and physical) of a given material and its pyrolysis products.
4. Finally, the heat transfer has been rather accurately described in order to deal with various operating conditions and particle sizes.
Once validated with given operating conditions, these models should allow results to be transposed to various other operating conditions. After the presentation of the models, some first tests with data found in literature are presented. These tests concern two different materials: PVC and Wood.
2. The two models
The particle is assumed to be immersed in an inert gas flow inside a black wall furnace. As in most models found in the literature, local thermal equilibrium between gas and solid is assumed [1,2]. This assumption is particularly appropriated in our case because with industrial processes, low heating rates are used. In order to build flexible models, which are adaptable to different materials, several other assumptions had to be adopted. Authors dealing with specific materials have considered anisotropy [3] or volume variation [2]. In our models, the particle is assumed spherical, isotropic and undergoes no volume variation during the pyroly-sis. This last assumption is the most restrictive because many waste undergo significant shrinkage during pyrolysis.
In the case of binary gas mixing in the pores, some models have taken into account molecular diffusion [1,2]. Chan et al. [4] showed that molecular diffusion in the gas phase could be neglected in comparison with the convective transport. This assumption will be made in our case.
During pyrolysis, many chemical reactions may take place in the particle. When a sufficient temperature is reached, the initial material is degraded to give gases and solid residues. Such transformations will be called primary reactions. The products of these primary reactions undergo secondary reactions: primary solid residues and gases may be transformed to other gases and solids.
Each reaction rate is modeled by the Arrhenius law. Simple or more complex reaction schemes can be represented: the models are able to handle parallel and/or consecutive reactions using mass stoechiometric coefficients for each solid or gas species. Many kinetic models found in literature are consequently easily usable in the models presented.
The gas velocity inside the pores is obtained with Darcy’s law, the pressure is calculated assuming the applicability of the perfect gas law. Thermophysical parameters such as porosity, effective thermal conductivity or permeability are assumed to vary between the initial material value and the final solid residue value according to the extent of conversion. Specific heats are either constant or depen-dant on temperature.
For the solid components, apparent densities are used and for the gaseous component real densities are used.
The formulation of the phenomena above for the heterogeneous model leads to the system below integrated on the control volume V.
Mass balances for the N initial compounds:
!
V
"#n
"t dV=An n=1, N (1)
Mass balances for the M solid residues:
!
V
"#m
"t dV=Bm+Cm+Dm+Em m=1, M (2)
Mass balances for the L gases:
!
V "(!#l) "t dV+!
V div(u#l)dV=Fl+Gl+Hl+Il l=1, L (3) Enthalpy balance:!
V " "t"
# N n = 1 #nhn+ # M m = 1 #mhm+ # L l = 1 !#lhln
dV+!
V div$
u#L l = 1 #lhl%
dV =!
V div(k*!a T) dV+"+#+$ (4)The integration of the accumulation terms of the equations above is simple because of the constant volume of the particle, the divergence integral terms are transformed in surface integrals according to the divergence theorem.
Momentum balance (Darcy’s law):
u= −%
"!a P (5)
Pressure (perfect gas law):
P= #L
l = 1
#l
Ml
Thermophysical parameters (porosity, effective thermal conductivity, permeability): &i=(1−X)&i, initial+X&i, final i=1, 2, 3 with &1=k*, &2=!, &3=% (7)
In the above equations, the terms An, Bm, Cm, Dm, Em, Fl, Gl, Hl,
Il, ', (, ) represent chemical sources:
An represents the consumption of the initial compound n by the primary
reactions in the control volume V (kg s− 1).
Bmrepresents the solid residue production by the primary reactions in the control
volume V (kg s− 1).
Cmrepresents the solid residue production by the gaseous secondary reactions in
the control volume V (kg s− 1).
Dmrepresents the solid residue production by the solid secondary reactions in the
control volume V (kg s− 1).
Em represents the solid residue consumption by the secondary reactions in the
control volume V (kg s− 1).
Fl represents the gas production by the primary reactions in the control volume
V (kg s− 1).
Gl represents the gas production by the gaseous secondary reactions in the
control volume V (kg s− 1).
Hl represents the gas production by the solid secondary reactions in the control
volume V (kg s− 1).
Il represents the gas consumption by the secondary reactions in the control
volume V (kg s− 1).
', ( and ) represent respectively the reaction heat fluxes generated by the primary reactions, the solid secondary reactions and the gaseous secondary reactions in the control volume V (W).
The conversion X is given by:
X=1−
$
#N n = 1 #n%
$
#N n = 1 #n, initial%
(8)Initial and boundary conditions:
Initially, the particle is assumed homogeneous with respect to temperature and composition and its pores are filled with nitrogen (inert sweeping gas) at the ambient pressure.
The heat flux continuity at the exterior-particle interface (r=Rp) leads to the
boundary condition:
k*S"T
"r
&
r = Rp=HcS(Text−T)+Qray (9)
For the convective heat transfer coefficient (Hc) calculation, the Rohsenow
correlation giving the Nusselt number in the case of a laminar flow around a sphere is used:
Nu=2+0.4Re1/2Pr1/3 (10)
The radiation term is obtained assuming that the particle is in a furnace with black walls. The radiative flux is then given by:
Qray=!pS*(Tp4−T4) (11)
The last boundary condition consists of assuming a constant pressure at the interface (r=Rp).
In the homogeneous model, equations are the same as for the heterogeneous model with the exception of the heat conduction term disappears in Eq. (4). The flux exchanged with the exterior is homogeneously dispatched in the overall particle and so, it appears in the enthalpy balance as a volume flux density.
3. Numerical solution
To integrate the heterogeneous model spatially, the control volume method has been chosen. It consists of establishing exact balances in little volume elements. This method seemed to be the most adequate for this kind of problem. In particular, it avoids problems with the center boundary condition in spherical geometry. In our case, control volumes are concentric spherical crowns.
The two models consist then in systems of ordinary differential equations (ODE). They have been solved with respect to time by Gear numerical method using the ODE solver LSODE [5].
The solution of homogeneous model (nine equations and nine variables system) is far faster than that of heterogeneous model (nine times number of control volumes). It is important to know whether the homogeneous model is applicable, or whether the heterogeneous model has to be used. In this way, a dimensionless number adapted to our case has been defined. It has been built on the basis of characteristic times representing the heat conduction inside the particle, the external heat transfers and the chemical reactions [6].
Z= $cond
$cin+$ext
Table 1
Modified kinetic parameters of PVC pyrolysis [7]
Activation energy (kJ kg−1) Pre-exponential factor
Reaction reaction order
7.71×10¹¹ 0.46 136.8 k1 146.5 k2 2.35×10⁹ 1.54 1.62 k3 1.7×10¹³ 239
4. Results and discussion
4.1. Test of the homogeneous model on PVC data
Homogeneous model has been tested with data found in works of Marcilla and Beltran [7], who determined kinetic data for the pyrolysis of PVC with TGA experiments. This kinetic model has been run with the homogeneous model and compared with experimental results [7] in order to validate the chemical part of the model. The reaction scheme given is the following:
PVC !k1 aHCl+bPVC# a=0.111 e=0.380 bPVC# !k2 cG+eRS b=0.889 f=0.257 eRS !k3 fG#+gRS c=0.509 g=0.123
For the three reactions, the Arrhenius law defines each reaction rate.
Ki=Aiexp
$
−Ei
RgT
%
Aiand Eiare respectively the pre-exponential factor and the activation energy of
the ith reaction.
In this reaction scheme, there are three consecutive reactions. There is one primary reaction (reaction rate k1), during which the main part of the
dechlorina-tion (HCl producdechlorina-tion) occurs, followed by two secondary reacdechlorina-tions. During the first one (reaction rate k2) the dechlorination is achieved and the second stage of PVC
pyrolysis begins. The last reaction (reaction rate k3) achieves this last stage.
Marcilla and Beltran calculated their reaction rate in terms of extent of conversion and in our model, kinetics are computed in term of mass of the different materials. Since the reaction orders in the case of PVC were different from unity, pre-expo-nential factors had to be adapted. The kinetic data in terms of mass loss are given in Table 1.
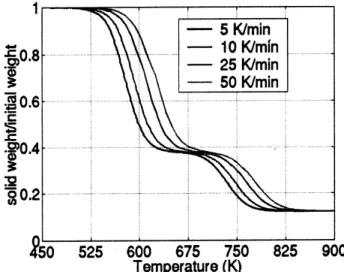
After having verified that the homogeneous model could be used in this case (the particle size was chosen small enough according to the dimensionless number [6]), four simulations were realized with different heating rates of external inert gas (respectively 5, 10, 25 and 50°C min− 1 as operating conditions of [7]). Figs. 1 and
2 represent respectively the evolution of solid mass fraction as a function of temperature obtained by calculation and experiment.
Marcilla and Beltran experimental results and homogeneous model results are in very good agreement. However, this test allows us to only validate the chemical part of our models, no data concerning heat transfer were found. We can observe that the homogeneous model is able to simulate TGA experiments.
4.2. Test and !alidation of the heterogeneous model on wood data
Tests have been carried out with data on wood found in works of Miller and Bellan [1] and Di Blasi [2]. The following reaction scheme has been used [1,2]:
This scheme is a simplified representation of wood pyrolysis: it is known that wood is made of complex chemical products (cellulose, hemicellulose, lignin …), which have been here lumped into a pseudo specie called WOOD. This scheme has been used only to qualitatively observe the heterogeneous model behavior.
Fig. 1. Homogeneous model results on PVC.
Table 2
Pre-exponential factors, activation energies and heats of the reactions (wood case) [1] pre-exponential factor
Reaction activation energy (kJ heat of reaction (kJ kg−1)
(s−1) mol−1) −418 K1 1.43×10⁴ 8.86×10⁴ −418 1.127×10⁵ K2 4.13×10⁶ 1.065×10⁵ 7.38×10⁵ −418 K3 1.08×10⁵ 4.28×10⁶ +42 K4 +42 1.08×10⁵ K5 105
In this example, we can distinguish only one initial component (N=1), one solid residue (M=1), and two gaseous species (L=2). WOOD is degraded by three primary reactions, which respectively produce two gaseous pseudo-species, i.e. an non-condensable gas (GAS) and a condensable (TAR), and a solid residue (CHAR). The secondary reactions represent the transformation of TAR in GAS or CHAR. This scheme groups parallel and consecutive reactions.
Table 2 gives the pre-exponential factor, activation energy and heat of reaction of each reaction [2]. We can note that primary reactions are endothermic and that secondary reactions are exothermic.
Table 3 gives heat capacities, molecular weights (for gases), thermal conductivi-ties, viscosities (for gases), porosity and permeability [1,2].
The chosen operating conditions are the following: The particle diameter is 3 cm,
The heating rate is of 20 K min− 1 from ambient temperature to 900 K,
The velocity of the inert sweeping gas is 0.001 m s− 1,
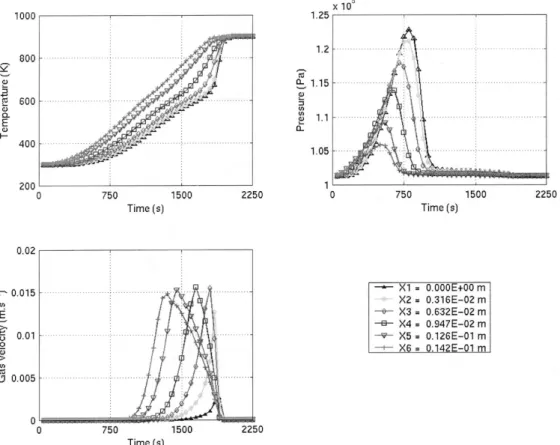
The different figures presented below show the apparent density of each com-pound, the temperature, the pressure and the velocity of the gases as a function of time. On each figure, the evolution of the value considered is represented at six different points, uniformly located on a radius from the center to the surface of the particle (X1 represents the particle center and X6 the external surface, the same legend is used for Figs. 3–7).
The influence of thermal conductivity can be observed in the graph relative to the particle temperature (Fig. 3). There is a delay between the temperatures at the surface and at the center of the particle. This delay appears on each graph. The effect of the endothermicity of the primary reactions can be observed in the temperature curve. It corresponds to the beginning of the wood degradation. For example, at a time of 1500 s, the temperature rate rise for the center of the particle slows down. At the same time, the primary reaction begins in the center of the particle (see Fig. 4).
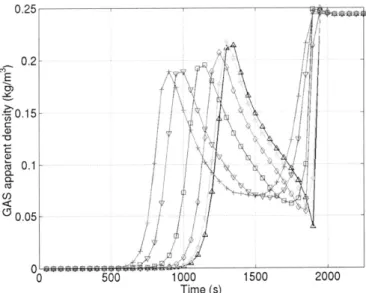
In Figs. 5–7, evolutions of apparent densities of nitrogen, GAS and TAR are represented as functions of time. At the initial moment, particle pores are filled with nitrogen: the pyrolysis has not started and so, there is no TAR or CHAR produced yet. For times going from 0 to approximately 600 s, the temperature of the particle increases but it is not sufficient to induce pyrolysis. The increase in temperature
Table 3 Heat capacities, molecular weights, thermal conductivities and viscosities, porosity and premability [1,2] (wood case) a Specy Viscosity (Pa s) [1] Molecular mass (kg mol − 1) Porosity Permeability (Da) [2] k * (W m − 1K − 1) Cp (J kg − 1K − 1) [1] [2] 10 − 5 1.046 × 10 − 1 2.3 × 10 3 Wood 0.7 0.9 1.1 × 10 3 10 1.046 × 10 − 1 CHAR 3× 10 − 5[1] GAS 1.1 × 10 3 18 × 10 − 3[1] 2.5 × 10 3 18 × 10 − 3[1] 3× 10 − 5[1] TAR 3× 10 − 5 Nitrogen 28 × 10 − 3 Janaf [6] aSome figures of this table can seem strange but they were taken in literature and are not of primary importance for testing the models.
implies an increase of pressure (perfect gas law) and then a pressure gradient between gas inside the particle and the exterior: nitrogen is evacuated outside (Darcy’s law), which explains the decrease of nitrogen apparent density in Fig. 5. Meanwhile, from 0 to 700 s, a slight increase in nitrogen apparent density can be observed at the neighborhood of particle center: a temperature gradient exists inside the particle (external surface is hotter than center), which implies a pressure gradient from the center to the external surface. Some nitrogen flows towards particle center. This phenomenon spreads with the temperature front.
After 600 s, pyrolysis begins. GAS starts to be produced before TAR because of the lower activation energy of its formation. In a first step, nitrogen is replaced by GAS inside the pores: an increase of the apparent density of GAS can be observed in Fig. 6 at the very time when nitrogen apparent density decreases (Fig. 5). As the temperature keeps increasing, TAR starts to be produced rapidly: there is then a mixing of GAS and TAR in the particle pores. GAS, which was produced alone, has to share the porosity with TAR: GAS apparent density decreases and TAR apparent density increases (Figs. 6 and 7). At this moment, the production of gaseous products is maximum, which generates a pressure and so a velocity augmentation as can be seen in Fig. 3.
Fig. 3. Temperature, pressure and velocity as a function of time calculated for different points along the particle radius.
Fig. 4. Apparent density of solids as a function of time calculated for different points along the particle radius.
In the last stage, the apparent density of TAR decreases and the apparent density of GAS increases: under the pressure gradient produced by the augmentation of temperature, a part of TAR produced by primary reactions is evacuated outside the particle, even when the other part is transformed into GAS and CHAR by secondary reactions (temperature is now sufficient for secondary reactions to occur). This phenomenon can be observed in Fig. 7 by the jump of apparent density of GAS. The increase of CHAR apparent density due to secondary reactions is not
Fig. 5. Apparent density of nitrogen as a function of time calculated for different points along the particle radius.
Fig. 6. Apparent density of gas as a function of time calculated for different points along the particle radius.
visible on Fig. 4 because of orders of magnitude difference (very low mass of char is produced). Finally, when all TAR is evacuated or transformed in GAS, only GAS remains in the pores in pressure equilibrium with the surround at the final temperature.
Fig. 7. Apparent density of tar as a function of time calculated for different points along the particle radius.
5. Conclusion and perspectives
The first results obtained with the two models are satisfying and are in good agreement with the literature. It simulates TGA experiments and can be useful to verify if the particle is really homogeneous or not. Experimental kinetic and thermophysical data are being determined to complement the model, and validate it over the operating range.
Moreover, new phenomena will be soon included in the models (particle shrink-age).
After validation of the two models, they will be included in a global model of a packed bed pyrolysis reactor.
References
[1] R.S. Miller, J. Bellan, Combust. Sci. Tech. 119 (1993) 331–373. [2] C. Di Blasi, Chem. Eng. Sci. 51 (7) (1995) 1121–1132.
[3] C. Di Blasi, Int. J. Heat Mass Trans. 41 (1998) 4139–4150. [4] W.C.R. Chan, M. Kelbon, B.B. Krieger, Fuel 64 (1985) 1505–1513.
[5] A. Hindmarsh, ODEPACK, a systematized collection of ODE solvers, in: J.S. Stepleman, et al. (Eds.), Scientific Computing, IMACS North–Holland, Amsterdam, 1983, pp. 55–64.
[6] P. Mousque`s, J.L. Dirion, D. Grouset, Mode´lisation de la pyrolyse de particules solides, in: Proceedings of the Congre`s Franc¸ais de Thermique, SFT2000, Lyon, 15–17 mai, 2000.
[7] A. Marcilla, M. Beltran, Polymer Degradation Stability 48 (1995) 219–229.
.